HAL Id: hal-01827766
https://hal.inria.fr/hal-01827766
Submitted on 3 Jul 2018
HAL is a multi-disciplinary open access
archive for the deposit and dissemination of
sci-entific research documents, whether they are
pub-lished or not. The documents may come from
teaching and research institutions in France or
abroad, or from public or private research centers.
L’archive ouverte pluridisciplinaire HAL, est
destinée au dépôt et à la diffusion de documents
scientifiques de niveau recherche, publiés ou non,
émanant des établissements d’enseignement et de
recherche français ou étrangers, des laboratoires
publics ou privés.
Browsing Linked Data Catalogs with LODAtlas
Emmanuel Pietriga, Hande Gözükan, Caroline Appert, Marie Destandau,
Šejla Čebirić, François Goasdoué, Ioana Manolescu
To cite this version:
Emmanuel Pietriga, Hande Gözükan, Caroline Appert, Marie Destandau, Šejla Čebirić, et al..
Brows-ing Linked Data Catalogs with LODAtlas. ISWC 2018 - 17th International Semantic Web Conference,
Oct 2018, Monterey, United States. pp.137-153. �hal-01827766�
Emmanuel Pietriga1, Hande G¨oz¨ukan1, Caroline Appert1, Marie Destandau1,
ˇ
Sejla ˇCebiri´c2, Fran¸cois Goasdou´e3,2, and Ioana Manolescu2
1Univ. Paris-Sud, CNRS, Inria, Universit´e Paris-Saclay, France
{emmanuel.pietriga,hande.gozukan,marie.destandau}@inria.fr,[email protected]
2
Inria and ´Ecole Polytechnique, France [email protected],[email protected]
3
Univ. Rennes 1, France [email protected]
Abstract. The Web of Data is growing fast, as exemplified by the evo-lution of the Linked Open Data (LOD) cloud over the last ten years. One of the consequences of this growth is that it is becoming increasingly dif-ficult for application developers and end-users to find the datasets that would be relevant to them. Semantic Web search engines, open data cata-logs, datasets and frameworks such as LODStats and LOD Laundromat, are all useful but only give partial, even if complementary, views on what datasets are available on the Web. We introduce LODAtlas, a portal that enables users to find datasets of interest. Users can make different types of queries about both the datasets’ metadata and contents, aggregated from multiple sources. They can then quickly evaluate the matching datasets’ relevance, thanks to LODAtlas’ summary visualizations of their general metadata, connections and contents.
Keywords: Linked Data Catalogs, Dataset Search, Visualization Resource Type: Software Framework, Research prototype/service Permanent URL: http://purl.org/lodatlas
https://gitlab.inria.fr/epietrig/LODAtlas
1
Introduction
Open data catalogs, Semantic Web search engines and related services play an essential role in the development of the Web of Data. They enable a wide range of users to identify datasets relevant to their purposes, effectively supporting “modern semantic approaches [that] leverage vastly distributed, heterogeneous data collection with needs-based, lightweight data integration” [9]. Data publishers can find relevant datasets to link to, thus adding value to their data and enriching the overall ecosystem. Software developers can look for stable datasets to rely upon in their application. Ontology designers can identify and reuse existing concepts from other vocabularies. Data analysts, data journalists and other end-user profiles can find the various datasets, ideally already linked, that will help them answer their questions. The Semantic Web community itself also makes use
of these services for research purposes, this new Web of Data and its dynamics being interesting phenomena to study on their own [26].
Over the last fifteen years, we have seen a variety of resources emerge, some of which have played a foundational role, addressing obvious needs of the com-munity: search engines such as Swoogle [18], SWSE [24], Sindice.com [33]; open data catalogs with some level of support for the specifics of linked data, such as CKAN1-based portals
datahub.io,data.govandeuropeandataportal.eu; services such as LODStats [20] and the LOD Laundromat [5].
Along with the proper means to describe linked datasets using VoID [2], this entire ecosystem should enable users from all of the above profiles to eas-ily find the datasets that are of interest to them. But unfortunately, reality is somewhat different. According to Vandenbussche et al. [35], only 13.7% of the registered 562 public SPARQL endpoints have VoID descriptions.2 Some
ser-vices have been discontinued. Others are still available but no longer updated. Yet other services are evolving, but dropping support for the specifics of linked data in the process [3], as their focus is elsewhere.
The need for linked data catalogs has been asserted again very recently by the LOD community, following datahub.io’s evolution (see [email protected]
discussion thread [3]). The discussion also emphasizes the opportunity to move to a framework that would itself be more reliant on linked data technologies for the management and serving of the metadata describing available datasets. While that would certainly be highly relevant and useful, we would be missing an opportunity by focusing only on technical aspects, leaving aside the more human-centric dimension of dataset search. Indeed, one issue with the services aforementioned is that while they are quite useful, each of them, taken individ-ually, only provides incomplete information. Users consequently have to gather information from multiple such services in order to find the datasets they need. The LODAtlas project has been initiated to explore an alternative user in-terface, aimed at making it easier for a broad range of users to find datasets of interest. LODAtlas aggregates data about datasets from multiple sources. It then lets users explore the resulting linked data catalog in various ways, using keyword search and faceted navigation. Selection criteria can freely mix con-straints on the datasets’ metadata (e.g., description, last modification date), the links that exist between them, and their schema-level [22] content, favoring visual representations of the result-sets using coordinated multiple views [36].
2
Background and Motivation
The visualization of linked data has been an active field of research for many years, with the development of so-called linked data browsers (e.g., [8]) and visualization tools, as well as supporting vocabularies [31] – see Dadzie et al.’s surveys [16,15]. Such user interfaces enable users to navigate on the Web of Data, displaying, in one form or another, the actual RDF statements contained in the
1 Comprehensive Knowledge Archive Network. 2
datasets. Here, we are more interested in interfaces that enable users to identify sources servings datasets relevant to their purposes, that can then be browsed using one of the above tools.
Early Semantic Web keyword-based search engines, such as Swoogle [18] and Falcons [14], were already enabling users to identify data sources and vocabular-ies, even if indirectly: based on keywords input by the user, they would return vocabularies or “documents” containing instance data matching the search cri-teria. Those would be displayed to users as more-or-less flat lists of links to external resources (ontologies, RDF documents), or their content would be ex-posed as raw triples. Sindice.com [33] played a somewhat different role: given a certain RDF resource URI as input, the API would provide the client applica-tion (e.g., a linked data browser) with links to addiapplica-tional data sources contain-ing statements involvcontain-ing that resource URI as subject or object. The followcontain-ing generation of search engines, including SWSE [24] and Watson [17], provided significant improvements such as, e.g., displaying the information contained in the retrieved statements in a much more human-friendly manner (SWSE); and providing useful metadata about the source (Watson). The general concept re-mained essentially the same, however.
A range of recent systems can assist users in the identification of datasets that suit their needs. As it is difficult to gain a clear understanding of the content of a dataset by looking at the raw triples, recent work has focused on providing visual summaries of the content of a given dataset. Given a SPARQL endpoint, LODEx [7] automatically generates a schema-centric, node-link diagram visual-ization of the content behind this endpoint. LODSight [19] and ExpLOD [27] follow conceptually similar approaches, representing similar information as node-link diagrams. The former provides more concise, but possibly less accurate sum-maries than LODEx as it might suggest possible relations that are not actually present in the data. The latter, ExpLOD, provides additional information about the interlinking between datasets. Loupe [30] also enables users to inspect the content of datasets. Rather than node-link diagrams, Loupe generates interac-tive summary tables based on explicit schema-level definitions and an analysis of how schema elements are actually used to describe instance data.
Aether [29] gives a complementary view on SPARQL endpoints, automati-cally generating a set of VoID-derived statistical charts (bar charts, pie charts) about namespace, class and property usage, also enabling the visual comparisons of two endpoints. LODStats [20] also provides statistical metadata about RDF datasets, at a wider scale, and makes those metadata themselves available as a linked dataset using the LDSO vocabulary, which extends VoID.
Other useful datasets and services include LODatio [22,28], a powerful data source search engine. Aimed at a more technical audience, it takes as input a raw SPARQL query that captures which types of resources and properties the user is interested in finding, and returns a ranked list of matching data sources. LODatio also suggests alternative queries based on the one input to narrow or widen the result list. Of interest primarily to dataset creators and ontology engineers, the LOV portal [34] is a very valuable, curated source of information
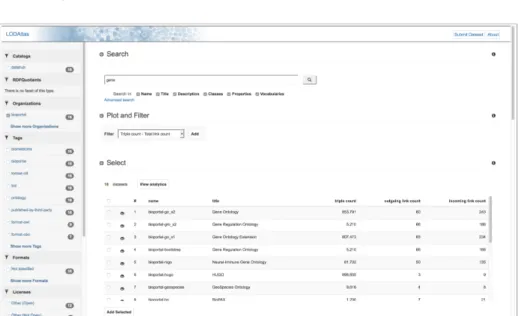
Fig. 1. Searching for datasets containing gene in their title, published by the bioportal.
aimed at facilitating the reuse of vocabularies, that provides data about the interconnections between vocabularies and version history.
Finally, while it primarily serves other purposes, LOD laundromat [6], and more precisely the LOD Wardrobe [5], lets people browse through a list of “cleaned” versions of a significant proportion of the LOD datasets available pub-licly on the Web. The Wardrobe offers some query capabilities, statistical charts and can show raw data fragments.
LODAtlas does not aim at replacing the above services and datasets, but rather at integrating a coherent subset of them into a single Web-based UI to facilitate the search for linked datasets. As described in the next section, LODAtlas takes the perspective of a user shopping for datasets by expressing her various needs (catalog metadata, schema-level constraints, interlinks) using different means (keyword search, URI search, faceted navigation) and assessing candidate datasets through visual summaries of their properties and contents.
3
Browsing the LOD cloud with LODAtlas
LODAtlas lets users browse the datasets found in one or more catalogs. In the following we take, as a running example, dataset descriptions exported from the CKAN-based datahub.io portal before it evolved to the new version,3 as this
older version remains for now one of the most important sources of information about linked open datasets. As discussed in Section5, multiple data catalogs can be added to the same instance of LODAtlas, in which case the provenance of the
3
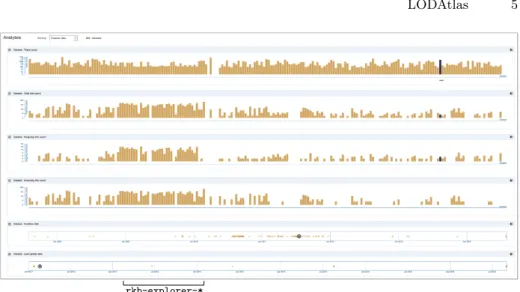
rkb-explorer-*
Fig. 2. Looking at all datasets from Linking Open Data Cloud, sorted by creation date. Hovering dataset near in one chart highlights it (black) in all charts (brushing). rkb-explorer datasets are discussed in Section3.3.
dataset description (which catalog it was imported from) becomes an additional possible search criterion.
3.1 Overview
LODAtlas provides users with two means to browse datasets: using keyword/URI search, and using faceted navigation. Both can be used in conjunction, to iter-atively refine the result list. Figure 1 shows the results of a basic search for keyword gene in the datasets’ name or title, published by the bioportal.
Users can search for keywords and URIs in any combination of: dataset name, title and description; vocabularies, classes and properties used. Results are or-dered to first show exact matches, and then partial ones, if any. When searching for classes or properties, LODAtlas looks for the input value in the class or property URI, as well as in the corresponding rdfs:label from the vocabu-lary definition. Only datasets that actually feature at least one instance of the property or class will be considered exact matches. For example, when searching for foaf:knows in Properties, LODAtlas will return as exact matches only the datasets that feature at least one statement whose property URI is foaf:knows. From an initial list of candidate datasets obtained with keyword/URI search and faceted navigation, users can further refine the results based on other dataset characteristics, that are more efficiently represented and specified using simple visualization widgets. First, users can display charts that summarize (Figure2): the number of triples in each considered dataset, the number of links to other datasets (incoming, outgoing, or both), and timelines showing creation and last update dates. All charts are synchronized: they can be sorted according to any of the above, and users can explore them using brushing and linking [36]: the
dataset hovered by the cursor immediately gets highlighted in all views (see the single black item corresponding to datasetnearin each bar chart and timeline in Figure 2). This set of simple interactive visualizations can further help identify datasets of interest, and can yield interesting observations, as discussed later in Section3.3.
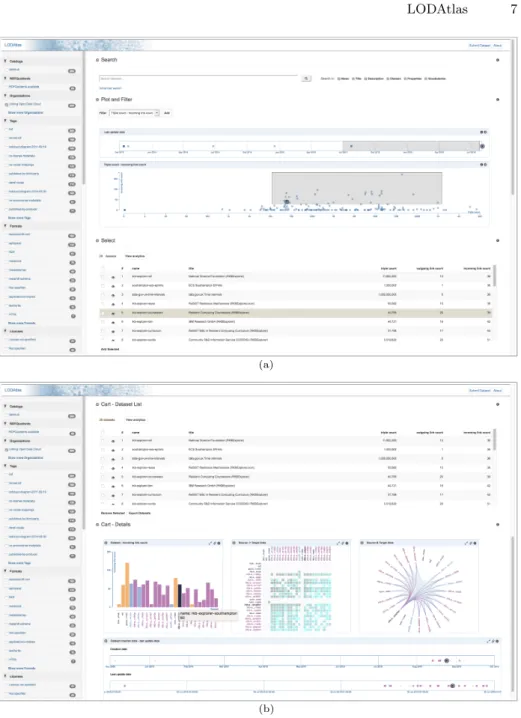
Based on insights gained from this view on the candidate datasets, users can then optionally express additional filtering rules to further refine the list (Figure 3-a). Such rules, specified interactively by drawing selection regions in scatterplots and timelines, declare combinations of restrictions on the minimum and maximum numbers of: triples, counts of links to other datasets, creation date and last update date. Once satisfied, the user can then select some or all of the remaining datasets in the list, and put them in what we call the dataset cart, which is conceptually similar to customers’ cart on e-commerce platforms. The dataset cart is separate from the previous list of search results, the ra-tionale being that users may want to first populate their cart with some datasets based on a set of selection criteria, and then add or remove datasets incremen-tally, based on other criteria. While it would theoretically be possible to capture the final dataset list with a single elaborate query, from the user’s perspective this would be quite tedious. Making it possible for users to explicitly store datasets of interest in a cart, temporarily forget about them and continue exploring freely, strongly favors the exploration of the catalog.
In our case, there is obviously no intention to sell the datasets in the cart. The latter should only be seen as a metaphor that will be familiar to many users. “Checking out” on LODAtlas only means exporting the cart as simple VoID descriptions of the chosen datasets, for later re-use in any context. Those VoID exports contain a limited set of statements, relying on foaf:homepage, as an inverse functional property, to automatically connect to other descriptive statements about the datasets, found elsewhere on the Web.
Before checking out (which remains optional), the contents of the cart can also be visualized in more detail, helping users get a better idea of how the chosen datasets are interlinked and how much data they hold individually. Figure 3-b shows some of the available visualizations. From left to right: a bar chart showing the triple count for each dataset (when hovering a dataset, the other ones change color depending on whether they feature incoming links, outgoing links, both, or none); an adjacency matrix giving an overview of which datasets are connected to which ones; a radial network layout showing the same information in a more intuitive, but less scalable, manner.
3.2 Visual Summaries of a Dataset’s Contents
The selection of a dataset is not only based on triple count, number of links to other datasets, and presence of some keywords. In their search for datasets, users will often want to get more detailed information about what is in the dataset, as suggested by services such as LODSight [19] and LODatio [28].
Any dataset can be inspected in more detail by clicking on the eye-like icon associated with it (Figure 1). This pops-up a new panel that features multiple
(a)
(b)
Fig. 3. (a) Filtering search results using visual, dynamic queries. (b) Putting the se-lected datasets in the user’s cart and looking at their characteristics in more detail.
tabs. The first one (not shown in the paper) is the dataset’s ID card. It displays general metadata about the dataset, including its title and description, license, author and publisher, as well as all resource files associated with the dataset in the catalog description (e.g., partial extracts, full dumps).
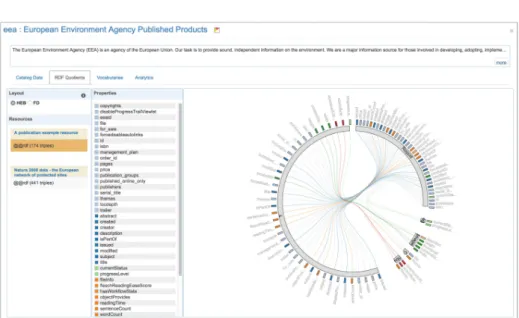
Fig. 4. RDFQuotients-derived visual summary of one of the European Environment Agency’s datasets. The summary shows how properties relate instances of the different classes (arcs sometimes represent instances that have multiple classes). Classes and properties are color-coded by vocabulary, based on namespace. Brushing through the sorted list of properties on the left highlights the corresponding edge in the network.
The next tab, RDFQuotients, features a novel interactive RDF summary visu-alization that has been designed specifically for LODAtlas, shown in Figure 4. Provided that a dump, even a partial one, is available for a dataset, and that the processing workflow described in Figure7 completes successfully, LODAtlas is able to generate this type of visual summary of the contents of the dataset.
The visualization is directly based on a summarization of RDF graphs that is computed using the RDFQuotients framework [11,12]. RDFQuotients work on the standard semantics of an RDF graph G, which can be materialized as an RDF graph called its closure (a.k.a saturation), that comprises G’s explicit triples, plus those derived from them and entailment rules from [23], i.e., G’s implicit triples. The framework defines a summary of G as a quotient graph, which is an RDF graph itself. In particular, it proposes four novel RDF node equivalence relations that allow quotient graphs (i) summarizing both the structure and the semantics of the original graphs and (ii) having more compact summaries than those relying on classical (non-RDF) node equivalence relations, e.g., those based on backward and/or forward bisimulation.
Two of these equivalence relations, called strong equivalence and weak equiva-lence, only consider how nodes are connected to others using data properties, i.e., different from the built-in RDF properties such as rdf:type, rdfs:subClassOf, etc. Two nodes are strongly equivalent whenever their incoming (resp. outgoing) data properties may cooccur on a single summary node, based on the input graph analysis; they are weakly equivalent whenever they have no incoming and
outgoing edge, or their incoming or outgoing data properties may cooccur on a single summary node, or they are weakly equivalent to another node. These two equivalence relations are particularly useful for RDF graphs with untyped or poorly typed data. The two other equivalence relations, called typed-strong equivalence and typed-weak equivalence, consider only types for typed nodes and the aforementioned strong and weak equivalences for untyped nodes; typed nodes are equivalent whenever they have the same types.
The resulting quotient graphs are then transformed into JSON data struc-tures more amenable to visualization with D3 [10]. They can be represented using a node-link diagram based on force-directed layout, or using a radial network layout based on hierarchical edge bundling [25]. The latter is less familiar and requires a bit of training to interpret, but usually scales better while conveying additional information. The hierarchy used as input for edge bundling is that of subsumption relationships between involved classes.
When multiple resource files are associated with a dump for a given dataset, LODAtlas tries to compute summaries for each such file individually. Each of them is listed in that tab, and users can select any one of them to get the corresponding visual summary. While in some cases the summaries will look very similar, there are also cases where the resource files associated with a single dataset dump contain complementary but very different subsets of the data. In such cases, having access to individual summaries seems more relevant than merging them all in a single, necessarily more complex one, since there was an attempt at modularizing the dataset in the first place.
The following tab, Vocabularies (not shown in this paper), lists all vocabularies actually used to describe RDF resources in the dataset, featuring direct links to the schemas or ontologies, as well as links to the corresponding entries in LOV (Linked Open Vocabulary [34]), when available. As discussed later, this tab may include more ontology-level information in the future, derived from Chen et al.’s minimal modules and best excerpts [13].
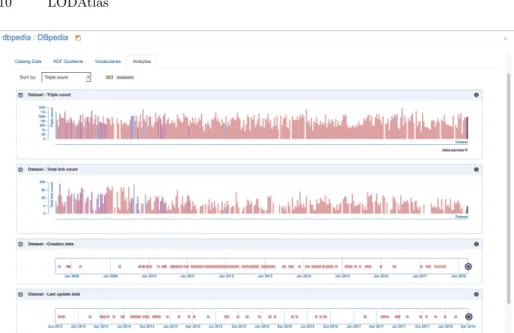
Finally, theAnalyticstab (Figure5) features charts very similar to those in Fig-ure2, but restricted to the datasets linked to the one being looked at in detail. In this context, the latter serves as a pivot, and all other datasets can be color-coded depending on the nature of their link to it, following the same convention as in the bar chart of Figure3-b for incoming, outgoing, and two-way connections.
3.3 Examples of Use
This section illustrates some examples of use for LODAtlas:
– Performing advanced searches that combine criteria about the datasets’ metadata and their contents. Conjunctions of constraints can be specified iteratively using different means, as illustrated in Figure 3-a. For instance, users could search for all datasets that 1) contain dbpedia in their descrip-tion (by entering that string in the search field); 2) feature instances of class foaf:Person (by then selecting the corresponding value in facet Classes); 3)
Fig. 5. According to CKAN data fetched from datahub.io, the last dataset added to the LOD cloud that links to DBpedia is data-persee-fr, a dataset about scientific publications: added March 21st, 2018 and last updated 10 days later, it features a larger-than-average number of triples compared to all datasets linking to DBpedia.
have been updated in the last three months (by adding the corresponding timeline plot and selecting the relevant time span) ; and finally, 4) feature at least 50,000 statements and more than 2 outgoing links to other datasets (by drawing a selection region in the corresponding scatterplot).
– Monitoring datasets recently added to the catalog or updated, that link to a particular dataset of interest. Figure5shows tabAnalyticsfor dataset DBpedia. Using the first timeline, users can quickly find out which datasets have been recently added to the catalog, that feature links (incoming, outgoing, or both) to DBpedia. The second timeline gives similar information about when these datasets have been updated. Brushing in the timeline makes it possible to get a quick estimate about the size and interlinks of those datasets.
– Spotting noteworthy events in a selection of datasets. Going back to Fig-ure2, sorting by creation date immediately reveals a time span that features datasets with a significantly larger number of link counts. Brushing through the histograms indicates that this “surge” corresponds to the addition of RKB Explorer [21] entries in the catalog.
– Comparing & contrasting the contents of related datasets. The RDF-Quotients-based visual summaries show how instances of different classes are effectively described, and connected to, other instances, using which proper-ties. Users can get a first impression about the suitability of different datasets for their purposes. These summaries can also help them understand how those datasets can work together to derive more data, or identify opportunities to link them when they are not already linked.
ElasticSearch Index MongoDB LODAtlas Data Manager LODStats LODAtlas Web Server RDF Quotients
Web Client (UI)
REST
Java API Java API
REST Native Python process Native Java process Java API Any23 Jena Catalogs
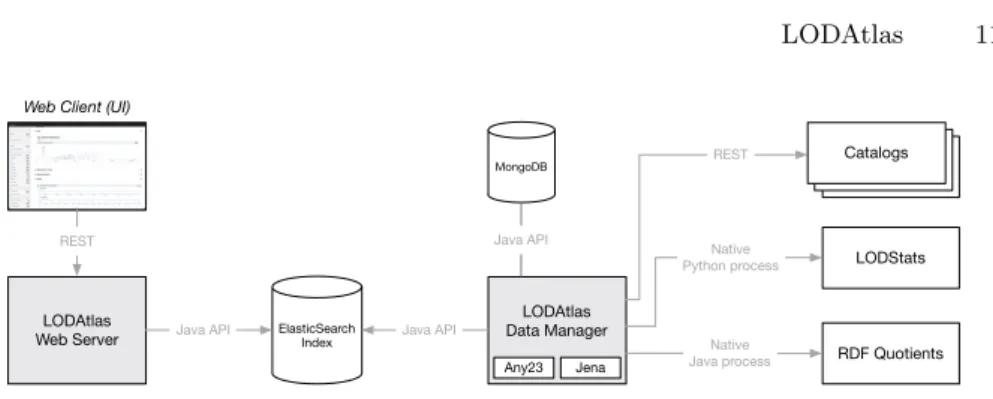
Fig. 6. LODAtlas - System architecture
4
Implementation
LODAtlas is based on Java EE 7 Web Profile edition, and deployed on an Apache Tomcat 8 server. The following Javascript libraries play a key role on the front-end side: D3.js [10] for generating the SVG visualisations; Crossfilter.js for fil-tering the data presented in charts, which effectively enables the brushing and linking features described earlier; JQuery for AJAX calls to server-side REST endpoints; and Bootstrapfor general page layout and icons.
Figure6gives an overview of LODAtlas’ architecture. The backend is imple-mented in Java, adopting a layered architecture. AnElasticSearchserver stores and indexes the data. The Web server’s REST endpoint receives requests and forwards them to the ElasticSearch service, which processes the requests and returns results as Plain Old Java Objects (POJO). These are the converted to JSON and transmitted back to the client. The REST endpoint can also be queried directly by any external tool (http://lodatlas.lri.fr/api/).
The ElasticSearch index gets populated by an independent module called the LODAtlas Data Manager (dm for short). That module is a standalone Java application that creates an aggregated database using several APIs to harvest metadata from different catalogs, and to process dataset dumps when available. The identification of relevant datasets in a catalog and fetching of the cor-responding metadata is based on CKAN API v3.4 Any235 and the Jena RIOT
API6 handle the conversion of dump files to N-Triples, providing support for a
broad range of RDF serialization formats. LODStats [20] is used as an external service to extract classes, properties and vocabularies, and RDFQuotients [11] provide summaries of the RDF dumps.
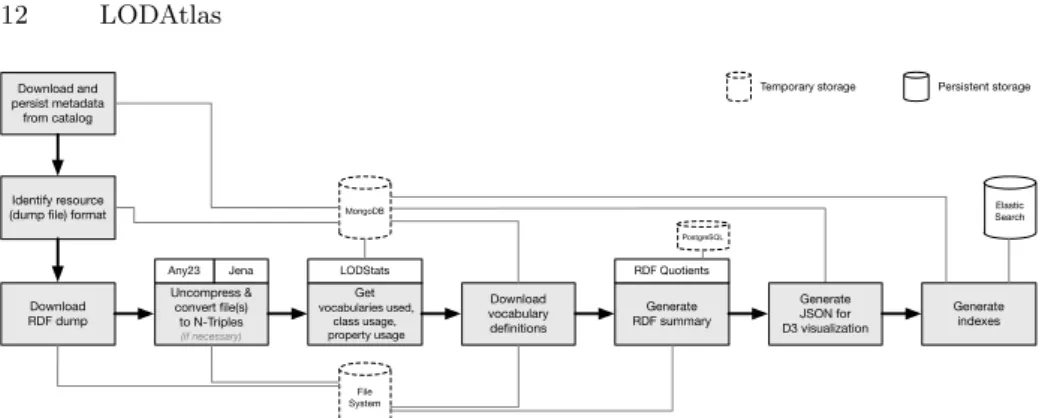
Figure 7 illustrates the processing workflow of a dataset whose description has been found in a catalog and matches the requirements for being considered a linked data dataset (e.g., on datahub.io, having lod as one of the declared tags). Once the JSON metadata has been downloaded from the catalog and temporarily stored in a MongoDB7instance, the dm checks for resource files associated with
4 http://docs.ckan.org/en/latest/api/ 5 https://any23.apache.org 6 https://jena.apache.org/documentation/io/ 7 https://www.mongodb.com
Download and persist metadata from catalog
Identify resource (dump file) format
Download RDF dump Uncompress & convert file(s) to N-Triples (if necessary) Get vocabularies used, class usage, property usage Download vocabulary definitions PostgreSQL File System Jena LODStats Generate RDF summary RDF Quotients
MongoDB SearchElastic
Generate JSON for D3 visualization
Generate indexes
Temporary storage Persistent storage
Any23
Fig. 7. LODAtlas - Dataset processing workflow.
this dataset. Among these resource files, those that are using one of the supported RDF serializations are downloaded, uncompressed (if necessary), and converted to N-Triples. For each resource file, LODStats returns information about the vocabularies, classes and properties used. This information is also temporarily stored in MongoDB, and vocabulary definitions get concatenated in a single file for use by RDFQuotients to compute the summaries. RDFQuotients use their own local PostgreSQL database to make summary computations more efficient. The resulting RDF graph is transformed into a JSON data structure, that also gets stored in MongoDB. This data structure is optimized for generating the interactive summary visualization (Figure4) on the front-end using D3. Finally, the contents of the MongoDB instance get indexed in ElasticSearch, which will be queried by the LODAtlas Web server to generate pages for the front-end.
5
Availability, Sustainability and Future Work
LODAtlas started as a research project initiated by team ILDA8 at INRIA and
LRI (Univ. Paris-Sud & CNRS), with contributions from INRIA team CEDAR.9 The project began long before datahub.io’s recent, major overhaul, and sub-sequent loss of LOD entries in its catalog [3]. Our goal was to investigate al-ternative user interfaces for browsing linked data catalogs in order to facilitate the discovery of relevant datasets. As such, the project had no intention to replace datahub.io for the LOD community. The context has now changed, however: we were able to retrieve, process and store locally all LOD dataset metadata from http://old.datahub.io; LODAtlas’ dataset processing work-flow has been streamlined, and the service has gained maturity through an iter-ative design process of the user interface over several years; we now have access to more computing resources at INRIA for dataset processing.10 In addition,
8 http://ilda.saclay.inria.fr 9
https://team.inria.fr/cedar
10The processing workflow can be run on any mid-range hardware configuration, but
Catalog Linked Datasets (entries created) RDFQuotients (computed) Resource files (total) Resource files (success) datahub.io 1,280a 417 72,303 23,996 data.gov (%)6,772b (%)6,011 (%)6,365 (%)6,099
a querying CKAN API for all datasets tagged with lod. b
querying CKAN API for all datasets featuring rdf in any metadata field.
(%) 71% of data.gov datasets have been processed at the time of writing. The Web site will contain updated numbers, accounting for the whole 9,482 RDF-tagged datasets (as of 2018-06-14).
Table 1. Catalogs featured in LODAtlas instance athttp://purl.org/lodatlas
the design of novel user interfaces for the Web of Data is a central topic of our research team, which means that we are committed to LODAtlas, not just as a service to be maintained, but as a research project aimed at evolving based on feedback from the community. As such, the main instance of LODAtlas at
http://purl.org/lodatlas will be accepting new LOD-related dataset
sub-missions. As is currently the case for LOV [34], we have opted for a lightweight curated model where each submission will be manually checked prior to inclusion by a LODAtlas team member, both for relevance and quality, before triggering the automatic processing of the new dataset. We may reconsider this choice if the service gains traction and the submission volume increases too much, in which case we would rather rely on a community effort.
Another element to consider is that LODAtlas is contributed to the commu-nity as much as a software framework as a research prototype/service. The code is hosted on GitLab at https://gitlab.inria.fr/epietrig/LODAtlasunder the GNU General Public License (GPL) version 3.0, and is also made avail-able as a Docker11 bundle for deployment by anyone interested, for use with
any CKAN-compatible catalog description. See the project’s GitLab page for information about running the demo with docker-compose.
As summarized in Table1, the main LODAtlas instance gathers descriptions from datahub.io and from data.gov. Catalog metadata can be processed for all relevant datasets, though some entries might be missing information depending on the completeness of the original description. LODStats and RDFQuotients processing is more subject to failure (this does not impact the creation of the dataset’s entry in LODAtlas, but means that some features will not be available, such as the visual summary). The processing of datahub.io is complete: we were able to compute RDFQuotients summaries for 33% of the datasets. The
with 2 CPUs and 16GB RAM, our current setup enables us to instantiate up to 4 virtual machines in parallel on the local cloud infrastructure, each machine having 8 CPUs, 1TB of disk space, 117GB RAM. While such computing power is not necessary for all datasets, the processing of some very large dumps – and more particularly the summarization – may require significant resources.
11
processing of data.gov is still ongoing at the time of writing. The current success rate for resource file processing yields RDFQuotients summaries for 89% of the datasets. Coverage thus varies significantly depending on the catalog. There can be many causes of failure: unavailability of any resource file, absence of resource file in one of the supported RDF serializations, failure to process a file for reasons such as, e.g., syntax errors or size limitations (we are currently unable to process individual RDF dumps larger than 10GB).
Future work on LODAtlas will start by considering additional catalogs, such ashttps://www.europeandataportal.euwhich, at the time of writing, is declar-ing 38,170 RDF datasets. We are also in the process of integratdeclar-ing a new version of RDFQuotients, which is providing cardinality information about the actual usage of classes and properties in resource files. This will enable us to: 1) extend search capabilities by adding criteria on the number of instances of a given class or property; and 2) enhance the summary visualizations, representing this car-dinality information by adjusting the property edges’ stroke width depending on the relative number of statements of each sort.
Another possibility we are considering is to show partial views on vocabulary definitions based on solutions such as Chen et al.’s minimal modules and best excerpts [13]. For a given dataset, relevant starting points (classes) could be identified in the instance data, that would serve as input to generate views on coherent subsets of vocabulary definitions, small enough to be meaningfully visualized and understood by users.
In the longer term, as interactive graph visualization is an active research topic in the team (see, e.g., [4,32]), we are also contemplating the possibility to generate an advanced, interactive visualization similar in spirit to the Linking Open Data cloud diagram [1] using the dataset descriptions stored in LODAtlas. The prioritization of new features will depend on feedback from the community.
References
1. Abele, A., McCrae, J.P., Buitelaar, P., Jentzsch, A., Cyganiak, R.: Linking Open Data cloud diagram.http://lod-cloud.net(2017)
2. Alexander, K., Cyganiak, R., Hausenblas, M., Zhao, J.: Describing Linked Datasets with the VoID Vocabulary. W3C Interest Group Note -https://www.w3.org/TR/ void/(March 2011)
3. [email protected] thread datahub.io. https://lists.w3.org/Archives/ Public/public-lod/2018Feb/0001.html(February 2018)
4. Bach, B., Pietriga, E., Fekete, J.D.: Graphdiaries: Animated transitions and tem-poral navigation for dynamic networks. IEEE Transactions on Visualization and Computer Graphics 20(5), 740–754 (May 2014), http://dx.doi.org/10.1109/ TVCG.2013.254
5. Beek, W., Rietveld, L., Bazoobandi, H.R., Wielemaker, J., Schlobach, S.: LOD Laundromat: A Uniform Way of Publishing Other People’s Dirty Data. In: Pro-ceedings of the International Semantic Web Conference (ISWC). pp. 213–228. Springer (2014),http://dx.doi.org/10.1007/978-3-319-11964-9_14
6. Beek, W., Rietveld, L., Schlobach, S., van Harmelen, F.: LOD Laundromat: Why the Semantic Web Needs Centralization (Even If We Don’T Like It). IEEE Internet Computing 20(2), 78–81 (Mar 2016),http://dx.doi.org/10.1109/MIC.2016.43
7. Benedetti, F., Bergamaschi, S., Po, L.: Visual querying lod sources with lodex. In: Proceedings of the International Conference on Knowledge Capture. pp. 12:1–12:8. K-CAP 2015, ACM (2015),http://doi.acm.org/10.1145/2815833.2815849
8. Berners-Lee, T., Chen, Y., Chilton, L., Connolly, D., Dhanaraj, R., Hollenbach, J., Lerer, A., Sheets, D.: Tabulator: Exploring and analyzing linked data on the Semantic Web. In: Proc. 3rd Int. Semantic Web User Interaction Workshop (2006) 9. Bernstein, A., Hendler, J., Noy, N.: A new look at the semantic web. Commun.
ACM 59(9), 35–37 (Aug 2016),http://doi.acm.org/10.1145/2890489
10. Bostock, M., Ogievetsky, V., Heer, J.: D3: Data-driven documents. IEEE Trans-actions on Visualization and Computer Graphics 17(12), 2301–2309 (Dec 2011),
http://doi.org/10.1109/TVCG.2011.185
11. ˇCebiri´c, ˇS., Goasdou´e, F., Manolescu, I.: A framework for efficient representa-tive summarization of RDF graphs. In: ISWC (Posters & Demonstrations) (2017),
http://ceur-ws.org/Vol-1963/paper512.pdf
12. ˇCebiri´c, ˇS., Goasdou´e, F., Manolescu, I.: Query-Oriented Summarization of RDF Graphs. Research Report RR-8920, INRIA (2017),https://hal.inria.fr/ hal-01325900
13. Chen, J., Ludwig, M., Ma, Y., Walther, D.: Zooming in on ontologies: Minimal modules and best excerpts. In: Proceedings of the International Semantic Web Conference (ISWC). pp. 173–189. Springer (2017),http://dx.doi.org/10.1007/ 978-3-319-68288-4_11
14. Cheng, G., Ge, W., Qu, Y.: Falcons: Searching and browsing entities on the se-mantic web. In: Proceedings of the International Conference on World Wide Web. pp. 1101–1102. ACM (2008),http://doi.acm.org/10.1145/1367497.1367676
15. Dadzie, A.S., Pietriga, E.: Visualisation of linked data - reprise. Semantic Web Journal 8(1), 1–21 (2017),http://dx.doi.org/10.3233/SW-160249
16. Dadzie, A.S., Rowe, M.: Approaches to visualising linked data: A survey. Se-mantic Web Journal 2(2), 89–124 (Apr 2011), http://dx.doi.org/10.3233/ SW-2011-0037
17. d’Aquin, M., Motta, E.: Watson, more than a semantic web search engine. Semantic Web Journal 2(1), 55–63 (Jan 2011),http://dx.doi.org/10.3233/SW-2011-0031
18. Ding, L., Finin, T., Joshi, A., Pan, R., Cost, R.S., Peng, Y., Reddivari, P., Doshi, V., Sachs, J.: Swoogle: A search and metadata engine for the semantic web. In: Proc. Int. Conference on Information and Knowledge Management. pp. 652–659. CIKM ’04, ACM (2004),http://doi.acm.org/10.1145/1031171.1031289
19. Dud´aˇs, M., Sv´atek, V., Mynarz, J.: Dataset summary visualization with lodsight. In: The Semantic Web: ESWC 2015 Satellite Events. pp. 36–40. Springer (2015),
http://dx.doi.org/10.1007/978-3-319-25639-9_7
20. Ermilov, I., Lehmann, J., Martin, M., Auer, S.: Lodstats: The data web census dataset. In: Proceedings of the International Semantic Web Conference (ISWC). pp. 38–46. Springer (2016),http://dx.doi.org/10.1007/978-3-319-46547-0_5
21. Glaser, H., Millard, I.C., Jaffri, A.: RKBExplorer.com: A Knowledge Driven In-frastructure for Linked Data Providers. In: The Semantic Web: Research and Ap-plications (ESWC). pp. 797–801. Springer (2008),http://dx.doi.org/10.1007/ 978-3-540-68234-9_61
22. Gottron, T., Scherp, A., Krayer, B., Peters, A.: Lodatio: Using a schema-level index to support users infinding relevant sources of linked data. In: Proceedings of the
International Conference on Knowledge Capture. pp. 105–108. K-CAP ’13, ACM (2013),http://doi.acm.org/10.1145/2479832.2479841
23. Hayes, P.J., Patel-Schneider, P.F.: RDF 1.1 Semantics.https://www.w3.org/TR/ rdf11-mt/(2014)
24. Hogan, A., Harth, A., Umbrich, J., Kinsella, S., Polleres, A., Decker, S.: Searching and Browsing Linked Data with SWSE: The Semantic Web Search Engine. Web Se-mantics 9(4), 365–401 (Dec 2011),http://dx.doi.org/10.1016/j.websem.2011. 06.004
25. Holten, D.: Hierarchical edge bundles: Visualization of adjacency relations in hier-archical data. IEEE Transactions on Visualization and Computer Graphics 12(5), 741–748 (Sep 2006),http://dx.doi.org/10.1109/TVCG.2006.147
26. K¨afer, T., Abdelrahman, A., Umbrich, J., O’Byrne, P., Hogan, A.: Towards a dynamic linked data observatory. In: The Semantic Web: Semantics and Big Data (ESWC). pp. 213–227. Springer (2013), http://dx.doi.org/10.1007/ 978-3-642-38288-8_15
27. Khatchadourian, S., Consens, M.: ExpLOD: Summary-based exploration of in-terlinking and RDF usage in the linked open data cloud. ESWC: The Seman-tic Web, Research and Applications pp. 272–287 (2010),http://dx.doi.org/10. 1007/978-3-642-13489-0_19
28. Leka, M., Schmidt, H., Blume, T., Vagliano, I., Scherp, A.: Searching for Sources of Data on the Web with LODatio+.http://lodatio.informatik.uni-kiel.de
(2018)
29. M¨akel¨a, E.: Aether – generating and viewing extended void statistical descriptions of rdf datasets. In: The Semantic Web: ESWC 2014 Satellite Events. pp. 429–433. Springer (2014),http://dx.doi.org/10.1007/978-3-319-11955-7_61
30. Mihindukulasooriya, N., Poveda Villalon, M., Garcia-Castro, R., Gomez-Perez, A.: Loupe - an online tool for inspecting datasets in the linked data cloud. In: Proceedings of the ISWC 2015 Posters & Demonstrations Track (2015), http: //ceur-ws.org/Vol-1486/paper_113.pdf
31. Pietriga, E., Bizer, C., Karger, D., Lee, R.: Fresnel - A Browser-Independent Pre-sentation Vocabulary for RDF. In: Proceedings of the International Semantic Web Conference (ISWC). pp. 158–171. Springer (2006),http://dx.doi.org/10.1007/ 11926078_12
32. Romat, H., Appert, C., Bach, B., Henry-Riche, N., Pietriga, E.: Animated edge tex-tures in node-link diagrams: a design space and initial evaluation. In: Proceedings of the CHI Conference on Human Factors in Computing Systems. ACM (2018),
http://dx.doi.org/10.1145/3173574.3173761
33. Tummarello, G., Delbru, R., Oren, E.: Sindice.com: Weaving the open linked data. In: Proceedings of the International Semantic Web Conference (ISWC). pp. 552– 565. Springer (2007),https://doi.org/10.1007/978-3-540-76298-0_40
34. Vandenbussche, P.Y., Atemezing, G.A., Poveda, M., Vatant, B.: Linked open vo-cabularies (lov): a gateway to reusable semantic vovo-cabularies on the web. Semantic Web Journal 8(3), 437–452 (2016),http://dx.doi.org/10.3233/SW-160213
35. Vandenbussche, P.Y., Umbrich, J., Matteis, L., Hogan, A., Buil-Aranda, C.: Spar-qles: Monitoring public sparql endpoints. Semantic Web Journal 8(6), 1049–1065 (2017),http://dx.doi.org/10.3233/SW-170254
36. Wang Baldonado, M.Q., Woodruff, A., Kuchinsky, A.: Guidelines for using multiple views in information visualization. In: Proceedings of the Working Conference on Advanced Visual Interfaces. pp. 110–119. AVI ’00, ACM (2000),http://doi.acm. org/10.1145/345513.345271