HAL Id: hal-01860888
https://hal.archives-ouvertes.fr/hal-01860888
Submitted on 24 Aug 2018
HAL is a multi-disciplinary open access
archive for the deposit and dissemination of
sci-entific research documents, whether they are
pub-lished or not. The documents may come from
teaching and research institutions in France or
abroad, or from public or private research centers.
L’archive ouverte pluridisciplinaire HAL, est
destinée au dépôt et à la diffusion de documents
scientifiques de niveau recherche, publiés ou non,
émanant des établissements d’enseignement et de
recherche français ou étrangers, des laboratoires
publics ou privés.
5W 1952nm Brillouin-Free Efficient Single Clad TDFA
Clément Romano, Robert Tench, Jean-Marc Delavaux
To cite this version:
Clément Romano, Robert Tench, Jean-Marc Delavaux. 5W 1952nm Brillouin-Free Efficient
Sin-gle Clad TDFA. Laser Technology for Defense and Security XIV, Apr 2018, Orlando, France.
�10.1117/12.2304910�. �hal-01860888�
5W 1952nm Brillouin-Free Efficient Single Clad TDFA
Clément Romano*
ab, Robert E. Tench
a, Jean-Marc Delavaux
aa
Cybel LLC, 1195 Pennsylvania Avenue, Bethlehem, PA USA 18018;
bInstitut Télécom/Télécom
ParisTech, 46 Rue Barrault, 75013, Paris France
*[email protected], www.cybel-llc.com
ABSTRACT
We report the performance of a two stage single clad (SC) Thulium-doped fiber amplifier (TDFA), delivering an output power of 5 W at 1952 nm without stimulated Brillouin scattering (SBS) for a single-frequency input signal. A slope efficiency greater than 60 %, a signal gain greater than 60 dB and an input dynamic range > 30 dB are achieved. The amplifier topology was optimized with a modelization tool of the SC TDFA performance: experimental results and simulations are in good agreement.
Keywords: Single-frequency, fiber amplifier, Thulium, simulation, single clad, multistage, Brillouin.
1. INTRODUCTION
Accurate simulations of TDFA is possible through fundamental characterization of the studied fibers used in a simple three level model of the rare-earth ion1. Such a modelization tool allows fast and efficient design of high performance amplifiers.
In previous publications we have demonstrated up to 2.6 W of signal output power out of a two stage single clad TDFA2.
In this paper, we investigate a two stage SC TDFA that delivers a record 5 W of output power at 1952 nm without the presence of stimulated Brillouin scattering.
We have carried out our amplifier design by first optimizing the active fiber length of a single stage then followed by a SC booster stage. In that respect, we study the dependence of amplifier performance on slope efficiency, gain, and noise figure for both saturated and unsaturated conditions. Both co- and counter-pumped single stage amplifiers were experimentally and theoretically studied using two different commercial single clad Thulium-doped fibers (TDFs), which were from OFS and iXBlue. Using this study, we then have designed a two stage single clad TDFA capable of providing more than 5 W of saturated output power at 1952 nm. Comparisons of simulation and experimental data for the two stage SC TDFA are in good agreement.
2. ACTIVE FIBER LENGTH DEPENDENCY
In a recent publication3, we showed with our in-house simulation software that varying the active fiber length of our TDFA
allowed us to access different operating bands of the Thulium emission spectrum. In this section we confirm our modelization software by experimentally evaluating the dependence of the amplifier’s performance on the active fiber length. We evaluated several amplifiers with different lengths of SC TDF in co- or counter-pumped configurations using either OFS TmDF200 or iXBlue IXF-TDF-4-125-v1. The pumping wavelength is ~1560 nm and the operating signal wavelength is either 1952 or 2004 nm. Signal and pump powers are measured at the input and output of the active fiber.
2.1 Performance of single stage using OFS fiber
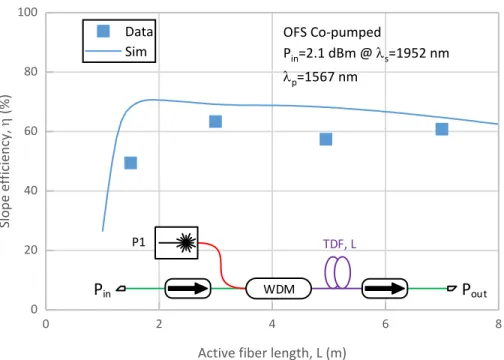
We first investigated the dependence of the slope efficiency on fiber length for a single stage in a co-pumped configuration using the OFS fiber. The inset in Figure 1 shows the setup. Figure 1 shows the evolution of the slope efficiency (η) for an input signal power (Pin) of 2.1 dBm at 1952 nm as a function of the active fiber length (L). The slope efficiency is defined
as the ratio of change in output signal power over change in pump power (η=ΔPout/ΔPpump). The experimental data (blue
dots) compare very well with the simulation (blue line) that predicts a slope efficiency of 70 % for length above 2 m of active fiber. We note that the efficiency drops slightly with increasing fiber length from 70 % to 60 %. Our measured data indicate a slope efficiency of about 60 % for fiber length between 2 and 8 m.
0 2 4 6 8 0 20 40 60 80 100 Data Sim Sl o pe ef fi ci enc y, ( %)
Active fiber length, L (m) OFS Co-pumped
Pin=2.1 dBm @ s=1952 nm p=1567 nm
Figure 1: Slope efficiency versus active fiber length for the OFS fiber in a co-pumped configuration.
As we have shown in our evaluation of a tandem amplifier3 the choice of fiber length determines the amplifier bandwidth
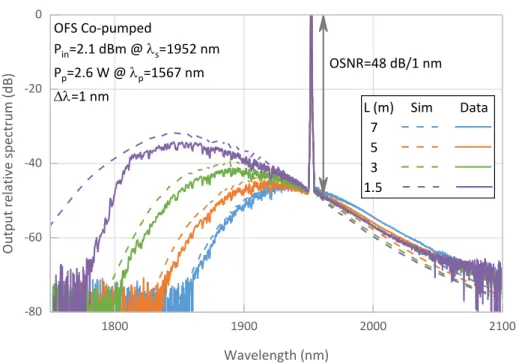
of the TDFA. Figure 2 plots the normalized output spectra for a TDFA with 4 different active fiber lengths at the same input signal and pump power level. We define the bandwidth of the amplifier using a 10 dB criterion below the ASE peak for the amplifier in a saturated condition. As the fiber is shortened we observe that there is not much change in the gain at wavelength about 1952 nm. However the bandwidth shifts toward shorter wavelength and increases from 119 nm for 7 m to 134 nm for 1.5 m, and the peak gain wavelength shifts from 1930 nm for 7 m to 1845 nm at 1.5 m. The experimental and simulated spectral characteristics (ASE peak wavelength λpeak and the 10 dB bandwidth BW) are summarized in Table
1. All simulated spectra agree well with the measured data except for the fiber length of 1.5 m. For an active fiber length of 1.5 m the spectrum is cut off at short wavelength by the transmission bandwidth of the output isolator.
WDM
TDF, L
P1
1800 1900 2000 2100 -80 -60 -40 -20 0 O ut put r ela ti ve s pec tr um ( dB) Wavelength (nm) L (m) Sim Data 7 5 3 1.5 OFS Co-pumped Pin=2.1 dBm @ s=1952 nm Pp=2.6 W @ p=1567 nm =1 nm OSNR=48 dB/1 nm
Figure 2: Measured and simulated spectra of a co-pumped amplifier for different OFS fiber lengths.
L (m) Measured Simulated λpeak (nm) BW (nm) λpeak (nm) BW (nm) 1.5 1845 134 1849 143 3 1895 134 1889 128 5 1915 124 1913 117 7 1930 119 1926 112
Table 1: Experimental and simulated ASE characteristics of the OFS co-pumped amplifier.
The same co-pumped amplifier was then evaluated with an unsaturated input signal power (-20 dBm). The signal gain (G) and noise figure (NF) versus active fiber length (L) are shown in Figure 3. We measured a gain greater than 40 dB for length of active fiber greater than 3 m with a noise figure lower than 4 dB. The gain is found to be a slowly increasing function of the TDF length for lengths greater than 3 m, while the noise figure remains constant.
0 2 4 6 8 0 10 20 30 40 50 Data Sim
Active fiber length, L (m)
G ( dB) OFS Co-pumped Pp=2.6 W @ p=1567 nm Pin=-20 dBm @ s=1952 nm 0 2 4 6 8 10 N F ( dB)
Figure 3: Gain and noise figure versus OFS fiber length for an unsaturated input. 2.2 Performance of a single stage using iXBlue fiber
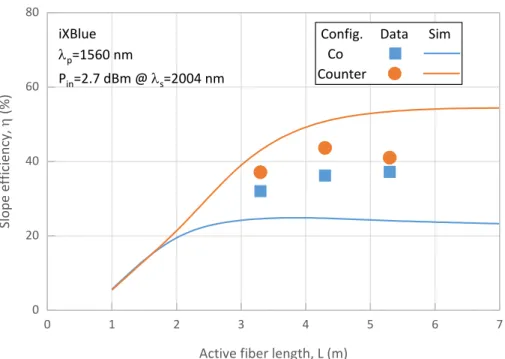
Next we evaluated the performance of a TDFA for both co- or counter-pumping configurations using the iXBlue single clad TDF. Figure 4 shows the slope efficiency versus active fiber length in a co- and counter-pumped configuration versus active fiber length for an input signal power of 2.7 dBm at 2004 nm. For both co and counter-pump configurations we measured a slope efficiency of 40 % for fiber length of about 4 m slightly lower than the simulated η results that indicates in co-pumping configuration 25 % and in counter-pumping configuration 50 %. The simulated η values is overestimated for the co-pumped configuration and underestimated for the counter-pumped configuration, the origin of this behavior is under study.
0 1 2 3 4 5 6 7 0 20 40 60 80 Sl o pe ef fi ci enc y, ( %)
Active fiber length, L (m)
Config. Data Sim Co Counter iXBlue
p=1560 nm
Pin=2.7 dBm @ s=2004 nm
Figure 4: Slope efficiency versus iXBlue fiber length in a co- and counter-pumped configuration.
Figure 5 shows the performance of an amplifier in a co-pump configuration for three fiber lengths: 3.3, 4.3, and 5.3 m. The experimental and simulated results agree well for Pin of -9, -19 and -29 dBm and yield a gain greater than 20 dB. The
noise figure measurements are in agreement with the simulation results. We observe almost no dependency of gain and noise figure to the active fiber length between 3 m and 7 m.
0 1 2 3 4 5 6 7 0 6 12 18 24 30 Pin (dBm) Data Sim -9 -19 -29
Active fiber length, L (m)
G ( dB) iXBlue Co-pumped Pp=0.66 W @ p=1560 nm s=2004 nm 0 2 4 6 8 10 12 N F ( dB)
Figure 5: Gain and noise figure of the iXBlue co-pumped amplifier versus active fiber length.
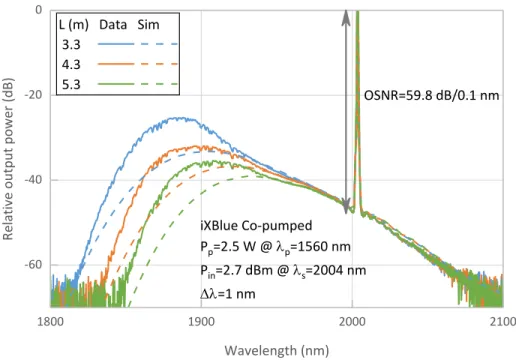
Figure 6 plots the output spectra of the co-pumped iXBlue amplifier for different lengths of active fiber. As the fiber length increases the ASE is reabsorbed and its amplitude decreases, shifting the peak and the bandwidth to higher wavelengths.
Comparison of the experimental data (solid lines) and the simulation (dashed lines) shows a difference in the 1850-1950 nm wavelength range. This difference is under study. The OSNR does not change with the fiber length and is 59.8 dB/0.1 nm. The spectral characteristics of the iXBlue co-pumped amplifier are summarized in Table 2.
1800 1900 2000 2100 -60 -40 -20 0 R ela ti ve out put po wer ( dB) Wavelength (nm) L (m) Data Sim 3.3 4.3 5.3 iXBlue Co-pumped Pp=2.5 W @ p=1560 nm Pin=2.7 dBm @ s=2004 nm =1 nm OSNR=59.8 dB/0.1 nm
Figure 6: Output spectrum of the iXBlue co-pumped amplifier for different active fiber length.
L (m) Measured Simulated λpeak (nm) BW (nm) λpeak (nm) BW (nm) 5.3 1908 123 1931 134 4.3 1897 117 1920 130 3.3 1887 96 1902 133
Table 2: Experimental and simulated ASE characteristics of the iXBlue co-pumped amplifier.
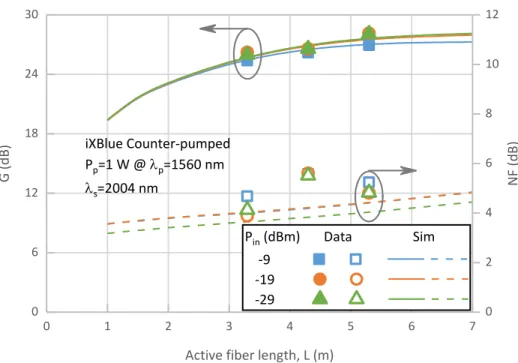
We then study the gain and noise figure of the iXBlue single-clad amplifier in a counter-pumped configuration. Figure 7 shows the gain and noise figure of the amplifier for different input signal power versus the active fiber length. The amplifier has a gain higher than 25 dB and noise figure lower than 6 dB for an unsaturated input signal power. Good agreement is observed between the experimental data and the simulation. In comparison to the co-pumped configuration, the counter-pumped amplifier delivers higher gain because of the higher pump power. In contrast the co-counter-pumped amplifier pump power was limited by the onset of lasing.
0 1 2 3 4 5 6 7 0 6 12 18 24 30 Pin (dBm) Data Sim -9 -19 -29
Active fiber length, L (m)
G ( dB) 0 2 4 6 8 10 12 N F ( dB) iXBlue Counter-pumped Pp=1 W @ p=1560 nm s=2004 nm
Figure 7: Gain and noise figure of the iXBlue counter-pumped amplifier versus active fiber length.
The output spectra of the amplifier in a counter-pumped configuration were measured and simulated for the different lengths studied and are displayed in Figure 8. Once again the OSNR does not change with the fiber length. The simulated and measured spectral characteristics are listed in Table 3. In comparison to the co-pumped configuration we observe a rather small change in the spectra as the fiber length increases. The ASE has a peak around 1860 nm for the experimental data and around 1850 nm for the simulation for all studied fiber length. As the λpeak, the 10 dB ASE bandwidth is not length
dependent in a counter-pumping configuration. In a counter-pumping configuration most of the ASE is generated within the last few meters of the active fiber.
1700 1800 1900 2000 2100 -60 -40 -20 0 O ut put r ela ti ve pow er ( dB) Wavelength (nm) L (m) Data Sim 3.3 4.3 5.3 iXBlue Counter-pumped Pp=2.5 W @ p=1560 nm Pin=2.7 dBm @ s=2004 nm =1 nm OSNR=53.8 dB/0.1 nm
L (m) Measured Simulated λpeak (nm) BW (nm) λpeak (nm) BW (nm) 5.3 1866 160 1858 166 4.3 1867 156 1858 163 3.3 1866 144 1856 155
Table 3: Experimental and simulated ASE characteristics of the iXBlue counter-pumped amplifier.
Comparing the OFS and iXBlue single clad fibers we observed that for the tested configurations our simulation predicted the performance of the amplifier accurately. However, the simulated slope efficiency shows some difference with the measured values. In Table 4 have summarized the measured slope efficiency on single stage SC TDFA for both iXBlue and OFS fibers at two operating wavelengths. Both SC fibers exhibits a 60 % slope efficiency at 1952 nm whereas our simulation predicted about 75 %. At 2004 nm for the iXBlue fiber, the simulation underestimated slope efficiency in a co-pumping configuration and overestimated in a counter-co-pumping configuration. The difference of slope efficiency between the two wavelengths is attributed to the saturation power which is higher at 2004 nm than at 1952 nm. From our experimental evaluation of co-pumped amplifier, we noted that the 10 dB ASE bandwidth is large: 120 nm for the iXBlue fiber versus 130 nm for the OFS fiber. We remarked that the bandwidth increases with shorter fiber length, for both SC fibers. The bandwidth with the iXBlue fiber shows a stronger dependency on fiber length than with the OFS fiber. In contrast, the bandwidth of the iXBlue fiber in a counter-pumped configuration didn’t change with respect to the active fiber length. λs (nm) 1952 2004 TDF η (%) OFS 63 / iXBlue 62 44
Table 4: Measured slope efficiency of both SC TDF at two operating wavelengths for Pin≈2 dBm
3. EXPERIMENTAL TWO STAGE AMPLIFIER CONFIGURATION
In our previous publications we have reported output power as high as 2.6 W for a multi-stage topology. In the next section we demonstrate a two stage amplifier where we increase the output power to more than 5 W.
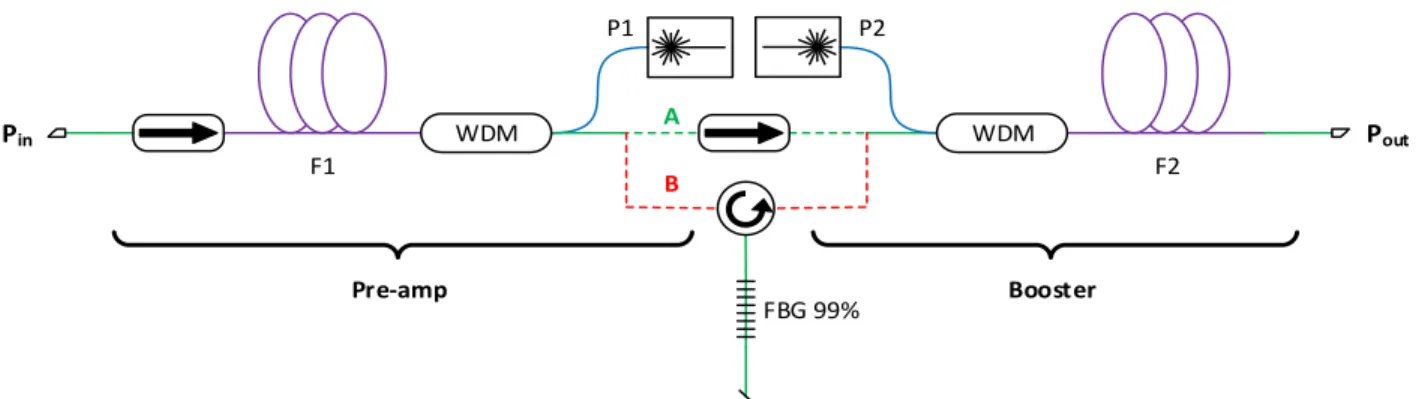
The two stage amplifier topology is shown in Figure 9. Signal light from a single-frequency narrow linewidth discrete mode laser (DML) is coupled through an optical isolator into the first stage. This high gain stage is counter-pumped with a multi-watt ~1560 nm in-band fiber laser (P1). The fiber in the first stage (F1) is a 4.3 m long iXBlue fiber. Two configurations are considered depending on the inter-stage element: either the signal output of the first stage is coupled through an isolator (referred as TDFA-A), or through an ASE filter (referred as TDFA-B). The ASE filter is made of a circulator and a high reflection FBG centered at the seed wavelength. The second stage uses 2 m of iXBlue SC TDF as F2 which is co-pumped with a multi-watt pump (P2) at ~1560 nm. Input and output signal powers are measured internally at the input and output of the active fibers. Pump powers stated are the values coupled into the Thulium-doped fibers.
P1 F1 Pin Pre-amp Booster WDM FBG 99% P2 WDM A B Pout F2
Figure 9: Topology of our two stage TDFA operating at 1952 nm.
An important consideration in high output power amplifier is the onset of Stimulated Brillouin Scattering, which limits the maximum output power. The linewidth of our single frequency input signal at 1952 nm was measured to be 7 MHz which is smaller than the fiber Brillouin gain bandwidth of 20 MHz4.
We consider the Brillouin to be generated and amplified into the active fiber F2. The output pigtail is too short to be considered (L<0.5 m). The Brillouin threshold ( SBS
th
P ) of the booster stage was estimated following4 Eq. 1 where
isthe threshold parameter (21 u.a.), Aeff is the optical mode area (12.6 µm²), Leff is the effective fiber length, and peak B
g is the peak Brillouin gain coefficient (12.2 µm/W). Aeff was calculated using the core diameter 4 µm and the NA 0.27 of the fiber given by the manufacturer. Leff was calculated using5 Eq. 2 where
out
P is the output power of the active fiber, P z
is thepower profile along the fiber, and
L
the fiber length. The evolution of the signal power through the active fiber was given by our simulation tool. For an output power of 5 W the effective length of fiber was calculated to be 1.73 m. The SBS threshold was calculated to be 12.5 W, far above our output power goal.. . eff SBS th peak B eff A P g L (1)
0 1 . L eff out L P z dz P
(2)4. EXPERIMENTAL AND SIMULATED RESULTS
4.1 Pre-amplifier stage performance
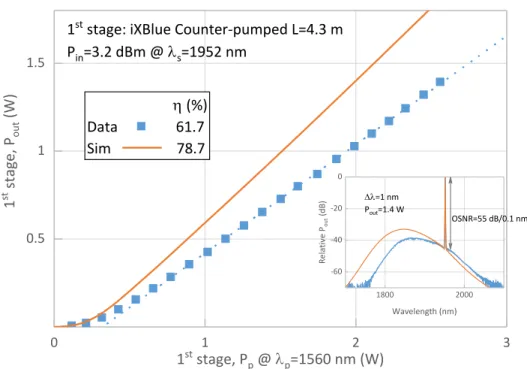
In out two stage TDFA, the first stage was designed to be a pre-amplifier focused on high signal gain at 1952 nm. Figure 10 plots the output signal power versus pump power for a saturating input signal. We demonstrate a slope efficiency of 62 % for the pre-amplifier in a saturated mode, delivering 1.4 W of output signal power for a pump power of 2.6 W.
0 1 2 3 0.5 1 1.5
(%)
Data
61.7
Sim
78.7
1
sts
ta
ge,
P
ou t(
W)
1
ststage, P
p@
p=1560 nm (W)
1
ststage: iXBlue Counter-pumped L=4.3 m
P
in=3.2 dBm @
s=1952 nm
1800 2000 -60 -40 -20 0 R ela tiv e Pou t ( d B ) Wavelength (nm) OSNR=55 dB/0.1 nm =1 nm Pout=1.4 WFigure 10: First stage output power versus pump power at 1952 nm.
In order to prevent the onset of lasing and have a high input signal dynamic range, the pump power (Pp) was set to 1 W.
The measured and simulated gain (G) and the noise figure (NF) versus Pin are plotted in Figure 11. The pre-amplifier
demonstrates a small signal gain greater than 35 dB with a noise figure lower than 7 dB. The simulation shows a difference with the measured data less than 1.5 dB.
-30 -20 -10 0 0 10 20 30 40 Data Sim Pin @ s=1952 nm (dBm) 1 st stage , G ( dB) 1 st stage P p=1 W @ p=1560 nm 0 5 10 15 20 1 st stage , NF ( dB)
This pre-amplifier delivers gains higher than 35 dB for an unsaturated input signal combined with a noise figure lower than 7 dB and a high input dynamic range of 33 dB. These characteristics make this pre-amplifier highly suitable as an input for our booster stage.
4.2 Two stage amplifier performance
Following the evaluation of the pre-amplifier performance, its pump power was set to Pp=1 W in the two stage
configuration in order to have an input signal dynamic range greater than 30 dB. Figure 12 plots the output power versus pump power for a saturated input signal for both TDFA-A & TDFA-B. We measured an output power greater than 5 W for both topologies with a slope efficiency η of 58 %, while our simulated slope efficiency is 78 %. The inset in Figure 12 shows the output spectra of both TDFA-A (in blue) and TDFA-B (in orange) for an output power of 5W at 1952 nm. The TDFA-A output spectra exhibits an OSNR of 53 dB with a 10 dB ASE bandwidth of 128 nm.
0 2 4 6 8 10 0 2 4 6
=78.5 %
Data Sim
TDFA-A
TDFA-B
Two
st
age,
P
ou t(
W)
2
ndstage, P
p@
p=1567 nm (W)
1
ststage: P
p=1 W @
p=1560 nm
P
in=3.2 dBm @
s=1952 nm
=58 %
1800 1900 2000 2100 -60 -40 -20 0 R ela tiv e Pou t ( d B ) Wavelength (nm) =1 nm Pout= 5.5 W OSNR=53 dB/0.1 nmFigure 12: Two stage amplifier output signal power versus pump power for both TDFAs.
In order to illustrate the power stability of TDFA-B the output power was set at 5 W and recorded over a 6 hour period. The power stability was measured to be better than 2 % p-p showing no thermal effects in the amplifier. No SBS was observed for a single-frequency input signal at 1952 nm.
0 1 2 3 4 5 6 4.0 4.5 5.0 5.5 6.0 Two stage , P out ( W) Time (h) TDFA-B 1st stage Pp=1 W @ p=1560nm 2nd stage P p=9.5 W @ p=1567 nm Pin=3.2 dBm @ s=1952 nm Stability < 2 % p-p
Figure 13: Output power stability of TDFA-B for a saturating input signal.
Figure 14 plots the measured and simulated slope efficiency as a function of the input signal power for TDFA-A and TDFA-B. We measured a slope efficiency of 58 % for an input signal power greater than -10 dBm with TDFA-A. Even though TDFA-B introduces a higher inter-stage loss we clearly observe an improvement of the slope efficiency for Pin<-10 dBm of the booster stage over TDFA- A due to the ASE power generated by the pre-amplifier. In order to have a
good power extraction (η = 58 %) within the second stage the input signal power should be greater than -20 dBm. The simulation shows a maximum slope efficiency of 80 %. This difference between the experimental and simulated η is under investigation. It could be caused by loss mechanisms not included in the simulation.
-30 -20 -10 0 0 20 40 60 80 100 Data Sim TDFA-A TDFA-B Two stage , ( %) Pin @ s=1952 nm (dBm) 1st stage P p=1 W @ p=1560 nm 2nd stage p=1567 nm
Figure 14: Two stage slope efficiency versus input signal power for both TDFAs.
We then compare the gain and noise figure versus Pin for both TDFAs in Figure 15. The results confirm that the addition
of the ASE filter improves the amplifier dynamic range. Indeed, the input signal dynamic range improves to > 30 dB compared to the 15 dB with an inter-stage isolator only.
-30 -20 -10 0 0 20 40 60 Data Sim TDFA-A TDFA-B Pin @ s=1952 nm (dBm) Two stage , G ( dB) 1st stage P p=1 W @ p=1560 nm 2nd stage P p=9 W @ p=1567 nm 0 5 10 15 20 Two stage , NF ( dB)
5. CONCLUSION
We have demonstrated a simple and robust two stage single clad amplifier delivering more than 5 W of output power at the 1952 nm signal wavelength. The performance of the two stage amplifier with two topologies were investigated: the first with an inter-stage isolator and the second with an inter-stage ASE filter. The ASE filter allowed us to demonstrate an input signal dynamic range greater than 30 dB with a slope efficiency in the booster stage of about 60 %. In addition a gain greater than 60 dB and NF lower than 7 dB were demonstrated. The output power stability at Pout=5 W was
investigated and found to be better than 2 % over 6 hours. No Brillouin or other non-linear effects were observed with a single-frequency input signal.
The design of this two stage amplifier was guided by an experimental and theoretical study of single stage amplifier performance dependence on the active fiber length. The performance of the single stage amplifiers based on OFS TmDF200 or iXBlue IXF-TDF-4-125-v1 either co or counter-pumped were investigated. The comparison between experimental and simulated gain, noise figure, output power and slope efficiency shows overall in good agreement. Since the two stage amplifier output power was not limited by the available pump power, we should be able to scale the amplifier to higher output power. In the future, we intend to investigate other single clad fibers for the booster stage to improve the efficiency.
6. ACKNOWLEDGEMENTS
We thank iXBlue for the single clad TDF, and the FBGs, OFS for the single clad TDF, and Eblana Photonics for the single-frequency DML sources around 2 µm.
7. BIBLIOGRAPHY
[1] Romano, C., Tench, R. E., Delavaux, J.-M., Jaouën, Y., “Characterization of the 3F4 – 3H6 Transition in Thulium-doped Silica Fibres and Simulation of a 2μm Single Clad Amplifier,” ECOC, Paper P1.SC1.2, Gothenburg (2017).
[2] Tench, R. E., Romano, C., Delavaux, J.-M., “Broadband 2 W Output Power Tandem Thulium-doped Single Clad Fiber Amplifier at 2 μm,” IEEE Photonics Technol. Lett. 30(5), 503–506 (2018).
[3] Tench, R. E., Romano, C., Delavaux, J.-M., “Optimized design and performance of a shared pump single clad 2 µm TDFA,” Opt. Fiber Technol. 42(February), 18–23, Elsevier (2018).
[4] Sincore, A., Bodnar, N., Bradford, J., Abdulfattah, A., Shah, L., Richardson, M. C., “SBS Threshold Dependence on Pulse Duration in a 2053 nm Single-mode Fiber Amplifier,” J. Light. Technol. 8724(c), 1–1 (2017).
[5] Lucas, E., Lombard, L., Jaouën, Y., Bordais, S., Canat, G., “1 kW peak power, 110 ns single-frequency thulium doped fiber amplifier at 2050 nm,” Appl. Opt. 53(20), 4413 (2014).