S
1,2, 4 D con sto com Fu cou sys con com sim usi “co pow exc is m ene rep con glo by gro ma Ch ins sun new com agg add of inc resSmart
a hyb
,3 Electrical E Department of Abstract— A nverters to ele orage, while th mmunity. This uzzy Logic-bas upled in term stem performa ntroller consis mpared in the mulator of the ing real meteo oupled strategKeywords—P
Energy consu wer; energy cept coal. For more pathetic ergy consump port of the Int nsumption of obal energy ut 2040 concer owth rate[1]. Fig. 2 demon ain 10 nation hina, Japan, an stallers. Nine nlight-based e w establishm mpletion, five gregate limit, ditional 22.7 G sunlight bas cluded so rapid sulted in diffi
t powe
brid ph
Saidi A Engineering D f Electrotechn n off-grid ener ectric and hydr he hydraulic s study puts fo ed Energy Ma s of energy m ance. In this p sts of a “smartway they shar hybrid energy orological data gy” clearly outp PV, Wind, Batte
I. INT
umption has r production h
oil and gas, g than energy ption in the y ternational En f Algeria will tilization has rning oil and
Fig. 1.World nstrates the P s in the year nd the USA t countries hav energy to their ments keeps o e nations con from top 2 co GW to the end ed power in dly that grid in ficulties. Ther
er man
hotovo
Ahmed1, Che epartment , E ic, universityrgy system bas raulic network part is made orward the pr anagement Str making necessa paper, a kind t” power-shari re the hybrid p y system has b a of the Adra performs the c erie, Power ma TRODUCTION
risen for all fu has also incre
global consum production. F year 2013, and nergy Agency l double by been predicte d coal consum Energy Consum V installed ca r 2013. It pla turned into the ve included m r matrices, and on broadenin nsumed no les ountries in 201 d of 2013 with n operation. C ntegration and re is expandin
nagem
oltaic/
ca
elali Benacha ENERGARID L of badji mokh ahmed sed on renewab ks. The electric of 5HP moto rime importan ategy (FLEMS ry to manage of manageme ing between th power sources been developed ar region and classical manag nagement, fuzz fuels except nu eased for all mption develop Fig. 1 depicts d According t y (IEA), the e 2040. Meanw ed to grow by mption in abs mption apacity and th ainly portrays e leading thre more than 1 G d the circulati ng. By the ss than 10 G 12. Asia introd h just about 42 Capacity has d diminishmen ng enthusiasmment us
/wind
ase stu
aiba2, Cherif Laboratory, TA htar Annaba- A dsaidi@outloo ble photovolta c network is c or-pumps expe nce of Water/P S) is proposed. the power flo nt strategies b he electrical an between the st d and tested us a practical lo gement strateg zy logic,motor-p uclear fuels pment world to the energy while, y 25% solute he top s that ee PV GW of ion of year's GW of duced 2 GW been nt has m for sm obj [2] top foll cou for Ch exp Fsing fu
stand-udy
f Benaudjafer TAHRI Moham ALGERIA ok.com aic (PV) and wi omposed of co ected to meet Power flows m . Thus, both el ows provided b based on artifi nd hydraulic n torage devices sing a MATLA oad demand p gies. pumps. all-scale PV i jective is to pu , [3] Fig. 3 demon p 10 nations lowed by Ger untries for win every indivi ina included panding aggre Fig. 2. PV Cap Fig. 3. Wind cafuzzy c
-alone
r3, Benyahia mmed Universi ind turbines (W onsumers and the freshwate anagement op lectric and hyd by renewable icial intelligen networks with and the electri AB environmen profile. The simin distributed ut more concen nstrates the PV in the year 2 rmany, UK, In nd volume per dual), Sweden an expected 1 gate introduce
pacity and addit
apacity and add
contro
e syste
Samia4 ity - Béchar - WT) generator of a battery b er demand of ptimization. Fo draulic subsyst sources to opt nce control wit regard to the ical/hydraulic nt. Several test mulation resul generation, a ntration towar V capacity and 2013. China ndia, and Can r occupant wer n, Spain, Por 16.1 GW of n ed limit by 21% tions, Top 10 c ditions, Top 10 coller o
em: A
ALGERIA. rs are coupled ank for electri f a small isola or this purposetems are stron timize the over th the fuzzy lo battery SOC a loads. A dynam ts are carried lts show that
and the govern rds the roof m d increments o
drove the m nada. The prin
re Denmark (8 rtugal, and Ire new limit in % to 91.4 GW ountries, 2013[ countries, 2013
f
via ical ated e, a ngly rall ogic and mic out the nment market. of the market, ncipal 863W eland. 2013, W. [4] 3[5]Aro 75. rate ene 40% I Co sen and bas gen tec neu ma and com eac cap ind use "bl for [9] sys Ne pro fuz dev 199 neu to [11 eas stro rul inf thr inf into Th (15 ens dat dat trai est cur ound 14.1 GW .5 GW in com e of drop was ergy created 1 % more than 2 II. LITERA In control sy ontrol (FLC) nsitive to oper d, doesn't requ sed on memb nerally obtain chnique is an ural network athematical m d parallel mputational n ch node based pabilities of dependence fr ed in the mi lack box" nat r defining the [10]. Based o stems, ANNs follow the c euro-Fuzzy M ocessing capab zzy logic mod
velopment pro 93, Jang dev ural learning r develop a fu 1]. The major se of imple- ong generaliza es; e) easie formation for p In this techn ough adaptiv ference, to avo o training dat e validation d 5%) and check
sure the gene taset manages ta. The valid ining dataset. imate final e rrent and desir
W is coordina mmercial oper from 17% in 140.1 billion k 2012.[6]–[8] TURE REVIEW CON ystems based o technique is ration point v uire the preci bership funct ned by a trial error-prone a ks (ANNs) model with com
data proces neurons in lay d on weight fac adaptive an om system pa icroprocessor ture, ANNs fa e structure an on the design complete oppo Models (NFM bilities of AN del. With the N
ocess is reduc eloped an NF regulations to zzy inference r features of mentation; b) ation skills; d) er inclusion problem-solvin nique, in every ve error bac oid over-fitting taset (70%) an dataset is furth king dataset ( ralization cap s the potential dation dataset Root mean error, which red outputs. Fig. 4. AN
ated into the u ration by year 2012 is decre kWh by Chine WS:POWER M NTROL on microproce commonly u variations and ise model of t tions and rul and error app and extended are generall mbinational a ssing. ANNs yers, which is ctors. ANNs w nd nonlinear arameters, and control syste face disadvant nd network in n structure in osite scheme M) combines NNs with infer NFM, the time ced with imp FM called A categorize and e system base ANFIS mode ) accurate an ) easier unders of numeric ng. y period the w ck-propagation g problems the nd validation her classified i (15%). Testing pability of AN l for the mod
is entirely square differ is the differ NFIS Vs STATE utility, with ro r's completion ased in 2013. ese amid 2013 MANAGEMENT essors, Fuzzy used as it is parameter ch the system. F le basis, whi proach. Hence process. Art ly defined abilities of lea s use orga s interconnect with their adv
structure, d d general skil ems. Due to tages without nstruction pro intelligent co to FLC [9], the parallel rence ability o e consumed fo roved accurac ANFIS by app d alter para- m ed on existing els are [9]–[1 nd fast learnin standing with cal and ling weights are up n method. D e data set is di dataset (30% into, testing d g dataset is us NFIS and che del that overfi different from ence is adapt rence between ES. oughly n. The Wind 3; it is AND Logic non-hanges LC is ich is e FLC tificial as a arning anized ted to anced design lls are their rules oblem ontrol [10]. data of the for the cy. In plying meters g data 2]: a) ng; c) fuzzy guistic pdated During ivided %)[13]. dataset sed to ecking its the m the ted to n the sys usin it c sup inje STA A. res res bat pre occ com glo thro sch em inte pow wo mu The to gen stru situ Bes the life util die be ren vol dem disp bal ren dum The req pro Fig.4 depicts stem efficienc ng both ANF came to be u perior battery ecting additio ATE control. Energy mana In case with ources, and a ource. To gu tteries are us emeditated for casion of ove mpletely filled obal structure ough power heme is to prov Family and mploying rene erference of wer without orking of each ust enforce an e power mana Fulfill the d neration of p ucture is na uations fluctu
sides, the dem e procedure ex espan, the po lize the renew esel generator, allowed whic newable based The microgr ltage isolated mand of mic patchable win lance betwee newable energy mp load (wate e microgrid is quired infrast ograms for ene
Fig 5.Bloc s the results o cy with two IS and STAT under- stood and hybrid sy onal energy in agement algor system compo diesel generat uarantee conti sed to stock r the dissipat er production d. Entire prec are associat converters. T vide a remote confirm ener ewable sourc the traditiona a break, the h component n optimum beh agement proce demand irresp power from aturally dynam uate extraord mand is extrem xceptionally f ower supervi wable resource , which must ch adds up t d generators to III. SYSTE rid considere microgrid lo crogrid consu nd and PV p en generatio y utilization a er-pomp), an e s equipped wit tructures to ergy managem k diagram of PV of battery, hy different ene TES. Investiga that the ANF ystem efficien nto the grid t rithm for stand osed of wind a tor is utilized inuous power the excess tive load to n and the sto cedent essenti ted to stay The principal rgy creation ces and hen al source. Fu e scheme mu , mainly load havior to rais edure is intend pective of the renewable. S mic, and m dinarily duri mely inconsis fragile[15], [1 ision algorith es and the sto be requested to exhaust the fulfill the loa
EM DÉSCRIPTI d in this pa ocated in a re umers is sup power plants. n and dem and reducing e energy storage th smart grid t implement ment purposes. V-Wind hybrid ydrogen and h ergy injected ating the outco FIS control a ncy and it is ab
than the tradit d–alone system and PV as the as a hold-up p r delivery, st energy. It is be utilized in orage batterie ials tangled i DC bus spri aim of this without disru nce diminish urther to prov ust yield into ding batteries se its life span
ded for our sc e variations i Surely, the h meanwhile, cl ing the day
tent, which cr 16]. To uptur hm should id orage batteries as small as, e most extrem ad side demand ON aper is a me mote area. En pplied from In order to mand, maxim energy loss thr e system is ap technology an demand resp .[17], [18] d system propos hybrid grids omes, attains ble of tional m main power torage s also n the es are in the ightly entire uption h the viding o the s, and n[14]. cheme n the hybrid limate ytime. reates rn the deally s. The could me in d. edium nergy non-keep mizing rough plied. nd has ponse sed
Fig. 5 shows the components and their connections of the isolated microgrid considered in this paper.
The growing rise of renewable technologies, especially those with uncertain power generation like wind and PV, leads to need for a diversity of storage solutions to smooth intermittency and ensure secure supply. The type of these solutions directly depends on the resources and terrain of particular regions and locations. Among different electricity storage technologies, battery energy storage and pumped-storage system are more common and practical in the real world. Therefore, these technologies have been analyzed and compared here from different points of view in order to justify the choice of pumped-storage system in this work[8], [15].
From environmental point of view impacts of batteries are more related to their disposal at the end of their life, and to the extraction of the resources to produce new batteries. Pumped-storage system may cause more environmental impact. However, in most construction of new pumped-storage, sites are selected where impacts can be mitigated to acceptable levels.[19]–[21]
From technical point of view batteries have shorter installation time, can provide fast response times and usually are located close to generation or load centers [19]. However, they have not demonstrated the ability to provide a full range of ancillary services needed to support the grid yet. A particular consideration for batteries is degradation. Batteries degrade as they age, which decreases the amount of energy they can store. To maintain a steady capacity for storage as batteries degrade, battery plants will require ongoing staged installation and replacement of batteries. In comparison, pumped-storage system is a reliable technology and is able to meet the needs of the grid and provide sustained output for up to a century without degradation.[1], [22]–[25]
IV. PV SYSTEM MODELLING
Fig. 6 shows a simplified scheme of a standalone PV system with DC–DC buck converter.
This section is devoted to PV module modelling which is a matrix of elementary cells that are the heart of PV systems. The modelling of PV systems starts from the model of the elementary PV cell that is derived from that of the P–N junction .[26]
Fig.6. A PV system with a DC–DC buck converter A. Ideal photovoltaic cell
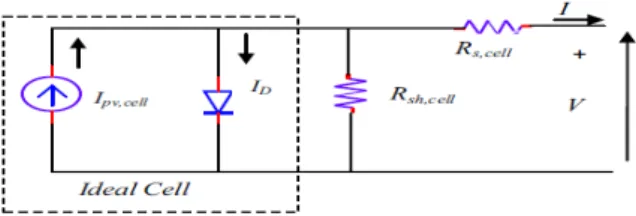
The PV cell combines the behavior of either voltage or current sources according to the operating point. This behavior can be obtained by connecting a sunlight-sensitive current source with a P–N junction of a semiconductor material being sensitive to sunlight and temperature. The dot-line square in Fig. 7 shows the model of the ideal PV cell. The DC current generated by the PV cell is expressed as follows
, , 1 1
The first term in Eq. (1), that is Ipv,cell, is proportional to the irradiance intensity whereas the second term, the diode current, expresses the non-linear relationship between the PV cell current and voltage. A practical PV cell, shown in Fig. 1, includes series and parallel resistances [10]. The series resistance represents the contact resistance of the elements constituting the PV cell while the parallel resistance models the leakage current of the P–N junction.
This model is known as the single diode equivalent circuit of the PV cell. The larger number of diodes the equivalent circuit contains, the more accurate is the modelling of the PV cell behavior, however, at the expense of more computation complexity. The single diode model is shown in Fig. 7 is adopted for this study, due to its simplicity.
Fig. 7. The Equivalent circuit of an ideal and practical PV cell.
B. PV module modelling
Commercially photovoltaic devices are available as sets of series and/or parallel-connected PV cells combined into one item, the PV module, to produce a higher voltage, current and power, as shown in Fig. 8.
The equation of the I–V characteristic of the PV module is obtained from Eq. (1) by including the equivalent module series resistance, shunt resistance and the number of cells connected in series and in parallel.
.
1 . 2 Where Vt the PV cell thermal voltage in Eq. (1) is substituted by that of the module thermal voltage given by and Ns and Np are respectively the number of cells connected in series and in parallel forming the PV module.
The constant an expressing the degree of ideality of the diode may be arbitrary chosen from the interval (1, 1.5) .[27] The light generated current of PV cell depends linearly on the irradiance and is also influenced by the temperature:
3 Ipvn is the nominal light-generated current provided at GSTC, TSTC which refers to the values at nominal or Standard Test Conditions (1 kW/m2, 25°C). The nominal light-generated current is not available in the datasheet of the PV panel but estimated as [28]:
4 -The second term in Eq. (2) is the diode current that is function of the voltage and current coefficients given by the equation below:
∆ ∆
1
ma dev asy sim com spe 11. eno ma abo cha out kW m/s mu per wit for pum rate and fre Hlo is t var the ope V out Where Iscn aximum curren vice at nomina Fig. 8. Equi The Simul ynchronous g mulated wind
mpute the turb eed (w_Wind) . At the wind ough power t achine operate ove the sync aracteris- tics tput torque is W. Practically, s are comme uch viable for
VI. The propose rformances ha th reference rmalisms [32]. Fig. 9 The motor-p mping water ed motor-pum d the efficie quencies 50 oad(Q1) are sho
the crossing p riation of the e pump effici eration of the VII. FUZZY LO In this stud tput FIS wher
is the nomin nt available a al conditions.[ ivalent circuit of V. WIND ink model generator and turbine bloc bine torque ou ) and turbine d speed more to supply the es in generat chronous spe of turbine, for adjusted to de the systems ercially availa low power sta
MODEL OF T
ed models a ave been prev to dynami . 9. Hydraulic Ch pump model n from well to mp power is 2 ency curve Hz and 40 own in Fig.9. point between motor-pump iency. For th pump with a f OGIC ENERGY (FL dy, we have re the given D nal short-circ at the termina [29] PV module. D TURBINE of WTG d is shown ck uses a 2-D ut- put (Tm) as speed (w_Tu than 2 m/s, t e load. As th tor mode, its eed (1.011 p r a 2 m/s wind eliver 0.5 pu o with cut-in sp able in marke and-alone oper THE MOTOR-P are quasi-stat viously comp c models u aracteristics of nominal powe o the tank wa 2 kW. The ch of the mot Hz and the The operating H(Q1) and H frequency (i.e his reason, w fixed frequenc Y MANAGEME LEMS) designed a s DC power and cuit current o als of the pra
developed in Fig. 10. D lookup tab s a function of urb), shown in the WTG pro he asyn- chro s speed is sl pu). Accordin d speed, the tu of power whic peed as low a ets which are
ration. [30].
PUMP
tic models w ared and vali using Bond-G Motor-pump er was selecte ater storage 1 haracteristics H or-pump for load characte g point of pum Hload(Q1). A e. 40 Hz) decr we use the op cy (i.e. 50 Hz) ENT STRATEG single input–s d the FS of the or the actical with The ble to f wind n Fig. oduces onous ightly ng to urbine ch is 3 as 2.8 e very which idated Graph ed for . The H(Q1) r two eristic mping weak reases ptimal .[17] GY single e tank are as arc De con retu Me illu FIS cho has con gen of A 305 tem (irr in t e defined as th the output. chitecture an fuzzification nsidered as the
urns the centr embership Fu ustrated in Fig S output and m osen trapezoid Fig.1 VI The simulatio s been accom nditions (irrad neration record Adrar region i In this paper 5-WHT mode mperature. Fig Fig 11 Fig 12 and radiance and w the simulation he FIS inputs a The designe nd uses th giving a crisp e most popula roid of the ar unctions (MF g.6. Triangle M most of the tw d.[20], [23], [3 0. Input and ou III. SIMULAT on of the prop mplished using diance and wi ded every hou in Southwest A , we have use els to produce 11show the IV 1. I-V and P-V c Fig13 show wind speed) s n of this paper.
and the power ed FIS base he “Centroi p output valu ar Defuzzifica rea under the Fs) of inputs MFs are chos wo inputs. Nev 31]
utput membersh
TION AND RES
posed hybrid R g the real dat
ind speed) an ur for one day Algeria. ed 96 PV Arra e power from V and PV pane characteristics o ws the atmo schemes of 30 . r-sharing facto ed on “Mam id” method ue. This meth ation method w curve. The ch s and outpu en to represen vertheless, we hip functions SULTS Renewable so a of Atmosph nd PV-Wind p y the 30th July ay Sunpower m sun eliminat el characterist of PV Array. spheric cond 0th July 2018 or (α) mdani” for hod is which hosen ut are nt the e have ources herics power 2018 SPR-te the tic. ditions using
Fig 12. The irradiance of 1 day 30th July 2018.
Fig 13. Wind speed of 1 day 30th July 2018.
Fig 14, Fig 15, Fig 16 shows the wind generator current, wind generator voltage, and wind power generator respectively. Fig 17 presents the power generated by PMSG wind turbine for 1 day of wind speed data. The variation in the speed wind under time caused unstable phenomena of the wind system influence on the realiabilité and robustness of wind generator at all.
For this and author reasons, it should add a speed regulator to control and stabilized the rotor speed under this wind speed variation.
Fig 14.Wind generator current.
Fig 15. Wind generator voltage.
Fig 16.Wind generator power
Fig 17, Fig 18, Fig 19 Presents electromagnetic torque, rotor speed and stator current of wind generator presented in PMSG machine.
These schemes show clearly the impact of the wind variation speed in electromagnetic torque and stator current, this variation caused many effects with the time and damaged the machine.
To conserve the wind system, many propositions in the literature are proposed to stabilize wind generation with new techniques of intelligence control.
Fig 17. Electromagnetic Torque of PMSG machine.
Fig 18. Rotor speed of PMSG machine.
Fig 19. Stator current of PMSG machine.
Fig 20 show PV results such as PV voltage, PV current and PV power for 1 day of irradiance (30th July 2018) in ADRAR region.
This result shows the performance of the PV panels (Sunpower SPR-305-WHT) used in this paper without consideration of temperature.
This results will be deferent if take consideration all atmospherics condition including Temperature because of its negative effects.
sys rem Arm mo low com sys pow atm spe Fig 20. The 5 HP W stem. To man mote area, it is Fig 21, Fig mature curre ourning 00.00 wer than the p mpensate with The power stem (PV-win wer load dema mospheric con eed). Fig Fig 23. T PV results, Cu Water-pump pl nage the pow s necessary to
22, Fig 23 ent, and elec 0 AM to 5.00 power consum h the batteries generated by nd system) and and preparing ndition unwe Fig 21. Wat 17. Armature c The electromagn urrent, voltage, ays a very im wer to pump produce a solu Present the w ctromagnetic 0 AM the po med, and in th power. y the hybrid d batteries is g to the critical ll (shading d er-pump speed. current of water netic torque of w and power mportant role i the water fo ution to this is water-pump s torque, From ower producti his time we ne renewable p hight 200% o l situation whe days and no . r-pump. water-pump. in our or the ssue. speed, m the ion is eed to power of the en the wind Fig and by per sys pum inst win in t in t In PV has pow the risi sys aut com sys tak win inp inst tha ava imp the g 24 presents t d wind system Fig 24. Po Fig 25 prese the pump. From 00.00 riod caused by stem is incapa mp work in a f To solve th tantly charged The PV syste nd system sup the peak when the day. this paper, V/Wind desalin s been address wer flows ma eory. The major sc ing is the deve stem, which tonomous sy mmunities. Th stem is to pro king advantage nd speed and s put electric pow
tantaneous po at to maximi ailable generat The power portant role in e load presente
the power gen ms at the run of
ower generated ents the power AM to 05.00 y the battery able to satisfy fault condition his problem, d by the time. em work 12 ho pport the load
n the PV and IX. CO a specific cl nation system sed through a s anagement str cientific challe elopment of a could work ystem espec he sought obje oduce fresh w e of the availa sun irradiation wer, fuzzy rul ower sharing b ze freshwater ted power. management n management ed in water-pu nerated by the f 1 day. d by hybrid PV-r genePV-rated v 0 AM the syst discharge, in y the power d n and rescued we should k ours in the day alone, the batt Wind system
ONCLUSION
lass of stand m has been pre specific and o rategy based o enge that this w an optimized p k in real-tim cially dedic ective through water as much able electric p n conditions. S les have been u between the tw r production system by t of power gen ump. e both photov wind system s power cons tem is in a cr
this time the demand, the w
for damage. keep the bat y, the rest hou teries bank ch ms with a maxi dalone battery esented. This optimized wate on the fuzzy work contribu power manage me for such ated to re h the develope h as possible ower offered So, according used to identif wo motor-pum according to fuzzy logic nerated by RE voltaic sumed ritical wind water-tteries urs the harged imum y-less issue er and logic utes to ement h an emote ed this while along to the fy the mps so o the play S and
Implementing an autonomous water desalination system powered by RESs in remote areas is still being a problematic issue that needs to be carefully addressed to guarantee freshwater supply. Energy management represents the major problem of such a system and the proposed approach in this paper could be used to solve the problem in real-time, but an experimental validation needs to be carried out on the experimental test bench to confirm the simulation results and the feasibility of the proposed FLEMS.
ACKNOWLEDGMENT
This work supported by Tahri Mohammed university and ENERGARID laboratory
REFERENCES
[1] V. Indragandhi, V. Subramaniyaswamy, and R. Logesh,
“Resources, configurations, and soft computing techniques for power management and control of PV/wind hybrid system,” Renew. Sustain. Energy Rev., vol. 69, no. May 2015, pp. 129–143, 2017.
[2] S. E. Reviews, “Renewable and Sustainable Energy Reviews,” vol. 68, no. July 2016, pp. 1–18, 2017.
[3] A. Chauhan and R. P. Saini, “A review on Integrated Renewable
Energy System based power generation for stand-alone applications : Con fi gurations , storage options , sizing methodologies and control,” Renew. Sustain. Energy Rev., vol. 38, pp. 99–120, 2014.
[4] “National Power Sector Report, viewed 2 March 2014, and
provided by Frank Haugwitz, Asia Europe Clean Energy (Solar) Advisory Co. Ltd. (AECEA), and personal communication with REN21, March 2014.”
[5] “Chinese Wind Energy Association (CWEA), provided by Shi
Pengfei, CWEA, personal communication with ren21, 14 March 2014.”
[6] Y. Himri, A. S. Malik, A. B. Stambouli, S. Himri, and B. Draoui, “Review and use of the Algerian renewable energy for sustainable development,” vol. 13, pp. 1584–1591, 2009.
[7] K. S. Krishna and K. S. Kumar, “A review on hybrid renewable
energy systems,” Renew. Sustain. Energy Rev., vol. 52, pp. 907– 916, 2015.
[8] A. Saidi, “Solar-Wind Hybrid Renewable Energy Systems:
Evolutionary Technique,” vol. 64, no. 4, pp. 24–27, 2016. [9] N. Altin, “dSPACE based adaptive neuro-fuzzy controller of grid
interactive inverter,” vol. 56, pp. 130–139, 2012.
[10] “Azar AT. Fuzzy Systems. Vienna, Austria: In Tech; 2010.” [11] J. R. Jang, “ANFIS : Adap tive-Ne twork-Based Fuzzy Inference
System,” vol. 23, no. 3, 1993.
[12] J. R. Jang, “Neuro-Fuzzy Modeling,” vol. 83, no. 3, 1995. [13] J. R. Jang, “Neuro Fuzzy and soft computing.” 1997.
[14] M. Dahmane, M. Ieee, J. Bosche, and M. Dafarivar, “Renewable
Energy Management Algorithm for Stand – alone System,” no. October, pp. 20–23, 2013.
[15] A. Saidi, B. Cherif, and B. Chellali, “Fuzzy intelligent control for solar/wind hybrid renewable power system,” EEA - Electroteh. Electron. Autom., vol. 65, no. 4, 2017.
[16] M. Dhimish, V. Holmes, B. Mehrdadi, M. Dales, and P. Mather,
“Photovoltaic fault detection algorithm based on theoretical curves modelling and fuzzy classification system,” Energy, 2017.
[17] S. Ahmed, C. Benoudjafer, and C. Benachaiba, “MPPT Technique
for Standalone Hybrid PV-Wind Using Fuzzy Controller,” in Artificial Intelligence in Renewable Energetic Systems, 2018, pp. 185–196.
[18] F. Harrou, Y. Sun, B. Taghezouit, A. Saidi, and M.-E. Hamlati, “Reliable fault detection and diagnosis of photovoltaic systems based on statistical monitoring approaches,” Renew. Energy, vol. 116, 2018.
[19] H. Li, Q. An, B. Yu, J. Zhao, L. Cheng, and Y. Wang, “Strategy Analysis of Demand Side Management on Distributed Heating Driven by Wind Power,” Energy Procedia, vol. 105, pp. 2207– 2213, 2017.
[20] I. Ben Ali, M. Turki, J. Belhadj, and X. Roboam, “Optimized fuzzy rule-based energy management for a battery-less PV/wind-BWRO desalination system,” Energy, vol. 159, pp. 216–228, 2018.
[21] W. El-Baz, P. Tzscheutschler, and U. Wagner, “Day-ahead
probabilistic PV generation forecast for buildings energy management systems,” Sol. Energy, vol. 171, no. June, pp. 478– 490, 2018.
[22] M. Zaibi, G. Champenois, X. Roboam, J. Belhadj, and B. Sareni, “Smart power management of a hybrid photovoltaic/wind stand-alone system coupling battery storage and hydraulic network,” Math. Comput. Simul., vol. 146, pp. 210–228, 2018.
[23] A. Tabanjat, M. Becherif, D. Hissel, and H. S. Ramadan, “Energy management hypothesis for hybrid power system of H2/WT/PV/GMT via AI techniques,” Int. J. Hydrogen Energy, vol. 43, no. 6, pp. 3527–3541, 2018.
[24] S. Saravanan and S. Thangavel, “Instantaneous reference current scheme based power management system for a solar/wind/fuel cell fed hybrid power supply,” Int. J. Electr. Power Energy Syst., vol. 55, pp. 155–170, 2014.
[25] B. Sivaneasan, N. K. Kandasamy, M. L. Lim, and K. P. Goh, “A
new demand response algorithm for solar PV intermittency management,” Appl. Energy, vol. 218, no. October 2017, pp. 36– 45, 2018.
[26] A. Saidi, “Comparative study of different load under P&O MPPT algorithm for PV systems,” EEA - Electroteh. Electron. Autom., vol. 64, no. 4, 2016.
[27] G. Wu, K. Y. Lee, L. Sun, and Y. Xue, “Coordinated Fuzzy Logic Control Strategy for Hybrid PV Array with Fuel-Cell and Ultra-Capacitor in a Microgrid,” IFAC-PapersOnLine, vol. 50, no. 1, pp. 5554–5559, 2017.
[28] Z. Cheng, H. Yang, and Y. Liu, “Self-adjusting fuzzy MPPT PV
system control by FPGA design,” Asia-Pacific Power Energy Eng. Conf. APPEEC, pp. 1–4, 2011.
[29] S. Ahmed, C. Benoudjafer, and C. Benachaiba, “Modeling and
Operation of PV/Fuel Cell Standalone Hybrid System with Battery Resource,” in Artificial Intelligence in Renewable Energetic Systems, 2018, pp. 299–307.
[30] F. Keyrouz, M. Hamad, and S. Georges, “A novel unified
maximum power point tracker for controlling a hybrid wind-solar and fuel-cell system,” 2013.
[31] A. Khiareddine, C. Ben Salah, D. Rekioua, and M. F. Mimouni,
“Sizing methodology for hybrid photovoltaic /wind/ hydrogen/battery integrated to energy management strategy for pumping system,” Energy, vol. 153, pp. 743–762, 2018.