HAL Id: hal-01182886
https://hal.archives-ouvertes.fr/hal-01182886
Submitted on 5 Aug 2015
HAL is a multi-disciplinary open access
archive for the deposit and dissemination of
sci-entific research documents, whether they are
pub-lished or not. The documents may come from
teaching and research institutions in France or
abroad, or from public or private research centers.
L’archive ouverte pluridisciplinaire HAL, est
destinée au dépôt et à la diffusion de documents
scientifiques de niveau recherche, publiés ou non,
émanant des établissements d’enseignement et de
recherche français ou étrangers, des laboratoires
publics ou privés.
Optimizing Network Information for Radio Access
Technology Selection
Melhem El Helou, Marc Ibrahim, Samer Lahoud, Kinda Khawam
To cite this version:
Melhem El Helou, Marc Ibrahim, Samer Lahoud, Kinda Khawam. Optimizing Network Information
for Radio Access Technology Selection. IEEE Symposium on Computers and Communications - ISCC
2014, Jun 2014, Madeira, Portugal. �10.1109/ISCC.2014.6912591�. �hal-01182886�
Optimizing Network Information for Radio Access
Technology Selection
Melhem El Helou
∗†, Marc Ibrahim
∗, Samer Lahoud
†and Kinda Khawam
‡∗Saint-Joseph University, ESIB, Campus des Sciences et Technologies, Mar Roukoz, Lebanon
†University of Rennes 1, IRISA, Campus de Beaulieu, 35042 Rennes, France
‡University of Versailles, PRISM, 45 Avenue des Etats-Unis, 78035 Versailles, France
Abstract—The rapid proliferation of radio access technologies (e.g., HSPA, LTE, WiFi and WiMAX) may be turned into advantage. When their radio resources are jointly managed, heterogeneous networks inevitably enhance resource utilization and user experience. In this context, we tackle the Radio Access Technology (RAT) selection and propose a hybrid decision frame-work that integrates operator objectives and user preferences. Mobile users are assisted in their decisions by the network that broadcasts cost and QoS parameters. By signaling appropriate decisional information, the network tries to globally control users decision in a way to meet operator objectives. Besides, mobiles combine their needs and preferences with the signaled network information, and select their access technology so as to maximize their own utility. Deriving network information is formulated as a Semi-Markov Decision Process (SMDP). We show how to dynamically optimize long-term network reward, aligning with user preferences.
Index Terms—Radio access technology selection, Semi-Markov Decision Process, hybrid decision-making approach.
I. INTRODUCTION
Devised with the vision of heterogeneity, next-generation networks integrate and jointly manage various radio access technologies (RATs). To exploit the potential of this conver-gence, efficient RAT selection techniques need to be defined. In the recent few years, many network-centric and mobile-terminal-centric approaches have been proposed. Typically, in [1]–[4], a Semi-Markov Decision Process (SMDP) is used to model the RAT selection problem. The network, independently of end-users, finds an optimal access policy that maximizes its long-term reward function (i.e., its expected utility calculated over an infinitely long trajectory of the Markov chain). Se-lection decisions then meet operator objectives, without nec-essarily aligning with user preferences. However, to enhance user experience, multi-criteria decision-making methods are presented in [5]–[8]. Based on their needs and preferences (e.g., traffic requirements, QoS-maximizing, cost- or energy-minimizing preferences), rational users select their access technology in a way to selfishly maximize their utility. Yet, because mobiles do not have a global vision of the network, their decisions are eventually in no one long-term interest.
In this article, we introduce an SMDP-based hybrid method combining benefits from both network-centric and mobile-terminal-centric approaches. Mobile users are assisted in their decisions by the network that broadcasts cost and QoS pa-rameters. Two mutually dependent decision-making problems are thus brought into play. The first one, on the network side,
consists in deriving appropriate network information so as to guide users decision in a way to meet operator objectives. The second one, where individual users combine their needs and preferences with the signaled network information, consists in selecting the radio access technology to be associated with so as to maximize user utility. As a consequence, RAT selection dynamically integrates operator objectives and user needs and preferences.
The basic idea of our hybrid approach was first presented in [9], where intuitive tuning policies are introduced to dy-namically derive network information as a function of the load conditions. In the present contribution, deriving network information is formulated as a Semi-Markov Decision Process [10]. Our goal is to dynamically optimize the long-term network reward, by trying to globally control users decision. Unlike previous studies [1]–[4] and since the network does not completely control individual decisions, transitions between the states of the SMDP do not only depend on network actions, arrival and departure rates, but also on user needs and preferences. The decision-making on the mobile side, using a multi-criteria decision-making method, is implicitly modeled as probabilistic transition rates.
The rest of this paper is organized as follows: The network model is introduced in section II. Section III presents our hybrid decision framework. The SMDP and the policy iteration algorithm are described in section IV. Numerical results are analyzed in section V. Section VI concludes the document.
II. NETWORKMODEL
A. Network Topology
Consider a heterogeneous wireless network composed of
two OFDM(A)-based radio access technologies. In RAT x,
x ∈ {x1, x2}, the user-perceived signal-to-noise ratio SN Rx
determines the user modulation and coding scheme (modx
,
codx
), and therefore its instantaneous peak rate (i.e., its
perceived throughput when connected alone to RATx). Since
practically the set of possible modulation and coding schemes
is limited, RAT x cell is logically divided into Nx
Z zones
(e.g., concentric rings). Users in zone Zx
k, k = 1, ..., NZx,
are supposed to have an SN Rx between δx
k and δk−1x , and
then to use (modx(k), codx(k)) as a modulation and coding
scheme. Although our solution adapts to different deployment scenarios, we focus on the more realistic and cost effective one where the two RATs base stations are co-localized (i.e.,
geographical cells overlap). The intersection of their respective
zones thus leads to NZ heterogeneous zones.
B. Network Resources
The radio resource is divided into elementary resource units (RUs), requiring both a time and a frequency dimension.
When connected to RAT x in zone Zk, k = 1, ..., NZ, the
maximum amount of bitsmx(k) transmitted on a RU depends
on (modx(k), codx(k)) and is given by:
mx(k) = Nos·Nsc·log2(modx(k))·codx(k)·(1−BLER) (1)
where Nos and Nsc respectively represent the number of
OFDM symbols and subcarriers per RU, and BLER the block error rate obtained as a function of the user-perceived SNR. In our work, and since we are interested in the large time scale radio conditions, an average SNR value per zone is considered for all RUs.
In the time domain, resources are further organized into
frames of length Tx
f. When Nru resource units per frame
are allocated to a user in zone Zk connected to RAT x, its
perceived throughput D is expressed as follows:
D = Nru· m x(k) Tx f (2) C. Traffic Model
In our work, the number of traffic classesNC is two. Users
belong to either streaming (c = 1) or elastic (c = 2) traffic
classes. Class c arrivals in zone Zk follow a Poisson process
of rate Λ(k, c). We assume that streaming sessions have an
average long-term throughput of Rav. Yet, to improve their
content quality, they can benefit from throughputs up toRmax.
Their duration is considered to be exponentially distributed
with a mean of1/µ1.
Elastic sessions, however, adapt to resource availability. Their needs are expressed as comfort throughput denoted by
Rc, and their size is assumed to be exponentially distributed
with a mean of L bytes. Note that their service rate µ2 also
depends on their perceived throughputs.
III. HYBRIDDECISIONFRAMEWORK
A. Network Information
Using the logical communication channel (i.e., radio en-abler) proposed by the IEEE 1900.4 standard [11], network information is periodically sent to all mobile users. In our work, this information is assumed to implicitly integrate operator objectives, guiding users decision.
When a new or a handover session arrives, the mobile de-codes network information, evaluates and then ranks available RATs.
The network is fully described by the exact numbers of class
c users, in zone Zk, that are connected to RATx. Yet, in our
work, only cost and partial QoS parameters are sent to mobiles. This significantly reduces signaling load. Furthermore, by masking RAT load conditions, even QoS parameters may be tuned so that mobiles decisions are consistent with generic
operator objectives (e.g., enhance resource utilization, reduce network energy consumption).
In this setting, cost and QoS parameters signaled by the network are seen as incentives to join available RATs:
• Cost parameters: As flat-rate pricing strategies are proved
to waste resources, and thus not optimal in supporting QoS, a volume-based model is proposed. Mobile users are charged based on the amount of traffic they consume.
In our work,costs are defined on a per kbyte basis.
• QoS parameters: Mobiles are guaranteed an average
min-imum number of RUs, denoted bynmin. They also have
priority to occupy up to an average maximum number of
RUs, denoted by nmax. However, and since RUs may
have different descriptions in the different RATs (i.e.,
different Nos and Nsc), we express QoS parameters as
throughputs:dmin anddmax instead ofnmin andnmax.
They are derived for the most robust modulation and
coding scheme (i.e., as perceived by users in zoneZNZ).
Consequently, when evaluating available RATs, mobiles should combine their individual radio conditions with the
provided QoS parameters: for that they multiplydminand
dmax with a given modulation and coding gain, denoted
byg(M, C).
B. RAT Selection
For RAT x, the network broadcasts the three parameters:
dmin(x), dmax(x), and cost(x). Using the satisfaction-based
multi-criteria decision-making method [12], mobiles compute a utility function for each of the available RATs, and select the one with the highest score. This utility depends on user radio conditions, needs and preferences (i.e., traffic class, throughput demand, QoS-maximizing and cost-minimizing preferences) as well as on the cost and QoS information sent by the network.
In our work, when cost(x) is maintained fixed, dmin(x)
anddmax(x) are dynamically tuned trying to globally control
users decision. Let Nx
I be the number of possible (dmin(x),
dmax(x)) couples that may be signaled to incite mobile users
to join RAT x. In the next section, selecting the (dmin(x),
dmax(x)) couple to be broadcasted for each RAT x is
formu-lated as a Semi-Markov Decision Process (SMDP). The goal is to dynamically optimize the long-term discounted network reward, while mobiles maximize their own utility.
IV. SEMI-MARKOVDECISIONPROCESS
At each user arrival or departure, signaled network informa-tion may vary. The SMDP is then used to dynamically derive QoS parameters in a way that optimizes the long-term network reward. We first start by defining the state space, actions, state dynamics, and reward functions. Then, using the policy
iterationalgorithm, we find the optimal solution.
A. States of the SMDP
A state of RATx is the (NZ × NC × NIx)-tuplen
x(t) for
{k = 1, ..., NZ, c = 1, ..., NC, i = 1, ..., NIx}:
where nx(k, c, i, t) is a stochastic process representing the
number of class c users in zone Zk, having the ith(dmin(x),
dmax(x)) couple, at time t. In the remaining, we assume
stationarity, and thus omitt.
To protect ongoing sessions, an admission control is
per-formed: new arrivals may join RATx with the ith(d
min(x),
dmax(x)) couple to the extent that RAT x available resources
are enough to meet their dmin, while not compromising the
QoS guarantees of ongoing ones. Consequently, the set of
admissible states in RATx is:
Nx a = ( nx∈ NNZ×NC×NIx | NZ X k=1 NC X c=1 Nx I X i=1 nx(k, c, i) · nx min(i) ≤ n x total ) (3) wherenx
min(i) is the number of RUs necessary to guarantee
the dmin of the ithQoS parameters couple, and nxtotal is the
total number of RUs used for data transmission in RAT x.
Let the (NZ × NC × NIx1 +NZ × NC × NIx2)-tuples =
(nx1, nx2) be the state of the heterogeneous network defined
as the concatenation of RAT x1 and RAT x2 substates. The
state spaceS of the network is then defined as:
S = {s = (nx1 , nx2) | nx1 ∈ Nx1 a , n x1 ∈ Nx2 a } B. Action Set
In each state s, an action is taken by the network: QoS
incentives to join each RAT are derived. An action a is the
quadruple defined by a = (dmin(x), dmax(x)), x ∈ {x1, x2},
where dmin(x) and dmax(x) represents the QoS parameters
of RATx as perceived by users in zone ZNZ. Based on their
needs (e.g., traffic class, throughput demand) and preferences, as well as on their modulation and coding scheme (i.e., geographical position), users act differently to these actions.
Obviously,Nx1
I · N x2
I actions are possible. However, given
a state s = (nx1, nx2), not all actions are feasible. We then
denote byA the set of all possible actions and by A(s) ⊂ A
the subset of feasible actions in state s.
When both RATs provide no QoS incentives (i.e.,
dmin(x1) = dmax(x1) = dmin(x2) = dmax(x2) = 0), new
arrivals are blocked and can not join any RAT. C. State Dynamics
As the network does not completely control individual decisions, transitions between the states of the SMDP do not only depend on network actions, arrival and departure rates, but also on user needs and preferences. The decision-making on the mobile side, using a multi-criteria decision-making method, actually appears as probabilistic transition rates.
Letpx(k, c, a) represent the probability that class c users in
zone Zk select RAT x, when action a is adopted. As action
a may be blocking, px1(k, c, a) + px2(k, c, a), ∀k, c, is not
necessarily equal to one: it can be either zero or one. Transition
ratesT (s, s′, a) between states s = (nx1, nx2) and s′are then
expressed as: Λ(k, c) px1(k, c, a) ifs′= (nx1+ ex1(k, c, i), nx2) Λ(k, c) px2(k, c, a) ifs′= (nx1, nx2+ ex2(k, c, i)) nx1(k, c, i) µx1 c (s) ifs′= (n x1− ex1(k, c, i), nx2) nx2(k, c, i) µx2 c (s) ifs′= (nx1, nx2− ex2(k, c, i)) 0 Otherwise (4) where ex(k, c, i) is defined as a (N Z × NC× NIx)-tuple
containing all zeros except for the (k, c, i)th element, that is
equal to one, and new arrivals join RATx with the ith QoS
parameters couple proposed by actiona. Hence, for example,
when a classc user in zone Zkjoins RATx1, with theithQoS
parameters couple proposed by action a, the network moves
to states′ = (nx1+ ex1(k, c, i), nx2).
The state dynamics can equivalently be characterized by the
state transition probabilitiesp(s, s′, a) of the embedded chain:
p(s, s′, a) = T (s, s′, a) · τ (s, a) (5)
whereτ (s, a) is the expected sojourn time for each
state-action pair, defined as follows: ( X x X k X c [Λ(k, c)px(k, c, a) +X i nx(k, c, i)µx c(s)] )−1 (6) D. Reward Function
To formulate optimization objectives, letr(s, a) denote the
permanence reward earned by the network in state s, when
action a is adopted. Unlike the impulsive reward, received
upon transitions, the permanence reward represents the benefit and penalty continuously received by the network whilst in
states (i.e., it is actually defined on a per unit time basis). In
our work,r(s, a) is expressed as the sum of a network utility
N (s, a) and a blocking cost B(s, a). The network utility is given by:
N (s, a) =X x X k X c ux(c)nx(k, c, i)Rx(k, c, i) (7)
where ux(c) is the class c utility earned per unit time in
RATx, and Rx(k, c, i) represents the data rate of class c users
in zone Zk, that have joined RAT x with the ith (dmin(x),
dmax(x)) couple. In fact, mobiles are first provided with their
minimum guaranteed throughput given by dmin · g(M, C).
Then, fair time scheduling is used to provide them with
up to their maximum throughput given by dmax· g(M, C).
Remaining resources may afterwards be equitably shared (i.e., after receiving their maximum throughput, all mobiles have the same priority leading to fair time scheduling).
Furthermore, the blocking cost reflects the penalty of
reject-ing future arrivals. B(s, a) is thus proportional to the arrival
rates in blocking states, and is expressed as follows:
B(s, a) = − b ·X k X c Λ(k, c)(1 −X x px(k, c, a)) (8)
whereb is the cost per unit time inflicted on the network
E. Uniformization
Before we proceed to solving the SMDP problem (i.e., de-termining the action the network should take in each state) us-ing the policy iteration algorithm, the continuous-time Markov Decision Process should be transformed into a discrete-time Markov chain. This can be done using uniformization.
The time is thereby discretized into intervals of constant
durationτ , that is smaller than the expected sojourn times of
all states:0 ≤ τ < τ (s, a), ∀s ∈ S.
Transition probabilities are then modified as follows: ¯ p(s, s′, a) = p(s, s′, a) τ τ(s,a) for s′6= s ¯ p(s, s′, a) = 1 −X s′6=s ¯ p(s, s′, a) Otherwise (9)
wherep(s, s¯ ′, a) represents the probability that the network
moves from state s to s′ withinτ , when action a is adopted.
Moreover, the reward is also modified as follows:r(s, a) =¯
r(s, a)τ , where ¯r(s, a) is the reward earned for a time τ .
F. Policy Iteration Algorithm
A policy π is a mapping from S to A. π(s) represents the
action to take in state s. Let Hπ(s) = s, s1, s2, ..., sn, ... be
a trajectory of the Markov chain, when policy π is adopted.
The long-term discounted reward dr(Hπ(s)) of state s is the
discounted sum of the rewards earned on that trajectory (that
starts froms), and is expressed as follows:
¯
r(s, π(s)) + ψ¯r(s1, π(s1)) + ... + ψnr(s¯ n, π(sn)) + ...
whereψ is the discounting factor (0 < ψ < 1). In our work,
the value function of state s, denoted by Vπ(s), is set as the
expected value ofdr(Hπ(s)) over all possible trajectories.
Our goal is to find an optimal policyπopt, that maximizes
the expected long-term discounted reward of each states:
Vπopt(s) ≥ Vπ(s), ∀s, π
We therefore use the following policy iteration algorithm:
• Step 0 (Initialization): We choose an arbitrary stationary
policy π.
• Step 1 (Value Determination): Given the current policy
π, we solve the following system of linear equations to
calculate the discounted value function Vπ of all states:
Vπ(s) = ¯r(s, π(s)) + ψ X s′∈S ¯ p(s, s′, π(s))V π(s′)
• Step 2 (Policy Improvement): When any improvement is
possible, we update the current policyπ. For each s ∈ S,
we find: ˆ π(s) = arg max a∈A(s) ( ¯ r(s, a) + ψ X s′∈S ¯ p(s, s′, a)Vπ(s′) )
• Step 3 (Convergence test): If π = π, the algorithm isˆ
stopped with πopt= π. Otherwise, we go to step 1.
V. NUMERICALRESULTS
The numerical results were obtained using Matlab on
IGRIDA1. For illustration, we consider a heterogeneous
wire-less network composed of mobile WiMAX (x = W ) and LTE (x = L) RATs. They are supposed to utilize a channel bandwidth of 3 and 5 MHz respectively. For the sake of simplicity, the cell is assumed divided into two zones (i.e.,
NZ = 2). While users with good radio conditions (i.e., in zone
1) are considered adopting the (64 − QAM, 3/4) modulation and coding scheme, users with bad radio conditions (i.e.,
in zone 2) are supposed to employ the (16 − QAM, 1/2)
one. Their peak rates (i.e., their perceived throughput when connected alone to mobile WiMAX and LTE technologies) are depicted in Table I.
RAT 64-QAM: 3/4 16-QAM: 1/2
Mobile WiMAX (3 MHz) 9
.9Mb/s 4.4Mb/s
LTE (5 MHz) 16
.6Mb/s 7.4Mb/s TABLE I
PEAK RATES INMOBILEWIMAXANDLTE
We assume that class c arrivals are uniformly distributed
over the two zones and follow a Poisson distribution of rate
Λc = Λ (i.e., Λ(k, c) = Λ/NZ, ∀k, c). However, to analyze
more finely network performance, different cell arrival rates will be considered.
Moreover, streaming sessions are supposed to have the
following parameters:Rav = 1 Mb/s, Rmax= 1.5 Mb/s and
1/µ1 = 45 s. Rc of elastic sessions are further considered
related to user preferences. On the one side, when users are ready to pay for better performances, they have a comfort
throughput of 1.25 Mb/s. On the other side, when they seek
to save up money, they are content with a comfort throughput
of 0.75 Mb/s. Nevertheless, their session size L is set to 5
Mbytes.
Cost parameters are maintained fixed: cost(W ) = 4 and
cost(L) = 6. Yet, QoS parameters are dynamically tuned
try-ing to globally control users decisions. For RATx, three
pos-sible (dmin(x), dmax(x)) couples belonging to Ixmay be
sig-naled (i.e.,NW
I = N L
I = 3 ). In this work, the following I
W
and IL
sets are considered: IW = {(0, 0), (0.5, 1), (1, 1.5)}
Mb/s andIL = {(0, 0), (0.75, 1.25), (1.5, 2)} Mb/s.
The probabilitiespx(k, c, a), that class c users in zone Z
k
select RATx when action a is adopted, are calculated
accord-ing to the satisfaction-based multi-criteria decision-makaccord-ing method we have introduced in [12]. They mainly depend on user preferences, traffic class and throughput demand. Note
that the probability class c users are ready to pay for better
performances is assumed equal to0.5.
Besides, and since we suppose that no RAT is preferred for
any traffic class,ux(c), ∀x, c, are set to one. The network
util-ity then comes down to the sum of user-perceived throughputs. Furthermore, so as to enlarge the number of states involved in
the value function,ψ is fixed at 0.99.
1A computing grid available to research teams at IRISA/INRIA in Rennes,
For comparison purposes, the staircase tuning policy [9] is also investigated. The highest QoS parameters are first signaled. Next, when the operator bandwidth guarantees – identified as a generic load factor – exceed a predefined
thresh-old S1, these parameters are reduced for the corresponding
RAT following a step function, as shown in Fig. 1. However,
when S2 is reached, they are set to zero. Future arrivals are
thereby pushed to the less-loaded RAT.
Initial parameters
Load factor S1 S2
QoS incentives
Fig. 1. QoS parameters reduction using the Staircase policy A. Performance Evaluation
Figure 2 illustrates the average reward as a function of the
cell arrival rate Λ, for different blocking costs. When b is
zero, the reward function is reduced to the network utility representing the total offered throughput. Otherwise, it also
includes a penalty term proportional to the blocking cost b
and the cell arrival rate.
0 0.5 1 1.5 2 2.5 3 −120 −100 −80 −60 −40 −20 0 20
Cell arrival rate (session/s)
Average reward Staircase policy Staircase policy (2) Optimal policy b = 0 b = 50 b = 20 b = 5
Fig. 2. The impact of the blocking cost on the average reward At low arrival rate, no blocking occurs leading to similar
rewards regardless of b. The reward function, reduced to
the network total throughput, then increases with the cell arrival rate. Yet, as the latter increases further, or equivalently, when the average number of simultaneous sessions augments, network resources are almost always exploited, and not enough may be allocated to future arrivals. Therefore, the blocking probability (i.e., the long-term fraction of time spent in a blocking state) also increases. Moreover, and since the penalty term is proportional to the cell arrival rate, the reward function received by the network whilst in a blocking state is as reduced as the arrival rate increases. For all these reasons, the average reward decreases more when the cell arrival rate increases,
except forb equal to zero. In fact, when b is zero, the average
reward stagnates at high arrival rate. It represents the long-term
sum of user-perceived throughputs. Otherwise, the average reward obviously decreases with increasing blocking costs. We further note that the optimal policy always outperforms
the staircase one with S1= 0.35 and S2= 0.85, denoted as
Staircase policy (2). However, whenS1 andS2 are carefully
set to 0.3 and 0.95, the Staircase policy provides an average
reward that is closer to the optimal one.
0 1 2 3 4 5 0 2 4 6 8 10 12 14 16 18 20
Cell arrival rate (session/s)
Average throughput (Mb/s) Staircase policy Staircase policy (2) Optimal policy, b = 0 Optimal policy, b = 5 Optimal policy, b = 50
Fig. 3. Network total throughput
Besides, the impact of the penalty term on the reward func-tion, and thereafter on the optimal policy, strongly depends on
the blocking cost b. On the one hand, the higher b the more
the network avoids blocking actions, even if at the expense
of the network utility. On the other hand, the lower b, the
more the network tries to maximize its total throughput, even if leading to more blocking states. We respectively depict in figures 3 and 4 the network total throughput and the percentage in number of blocking states as a function of the cell arrival
rate. The optimal policy is illustrated for different b values.
Particularly, whenb is zero, the network total throughput, but
also the percentage of blocking states, are maximized. The
blocking costb may therefore be tuned to control optimization
objectives. Further, the performance of the staircase policy
depends on S1 and S2. When S1 and S2 are respectively
set to 0.35 and 0.85, a lower throughput is achieved in
comparison with when S1 = 0.3 and S2 = 0.95. Actually,
when these thresholds are carefully chosen, the staircase policy can provide quite similar performances as the optimal one (b = 50). They both effectively avoid blocking actions and guide users decisions. In the remaining, we only consider the
case where S1= 0.3 and S2= 0.95.
It is worth noting that for a given b, when the cell arrival
rate is different, the state dynamics and penalty terms are also different. This may lead to dissimilar optimal policies. Thus, and as shown in Fig. 4, the percentage in number of blocking states first increases with the cell arrival rate. Then,
when the latter increases further, forb different from zero, this
percentage decreases as the penalty term becomes relatively very significant.
Moreover, the blocking probability Pb depends not only on
the number of blocking states, but mostly on the stationary distribution achieved by the different policies (i.e., on the
0 1 2 3 4 5 5 10 15 20 25 30 35
Cell arrival rate (session/s)
Percentage of blocking states (%)
Staircase policy Optimal policy, b = 0 Optimal policy, b = 5 Optimal policy, b = 50
Fig. 4. Percentage in number of blocking states
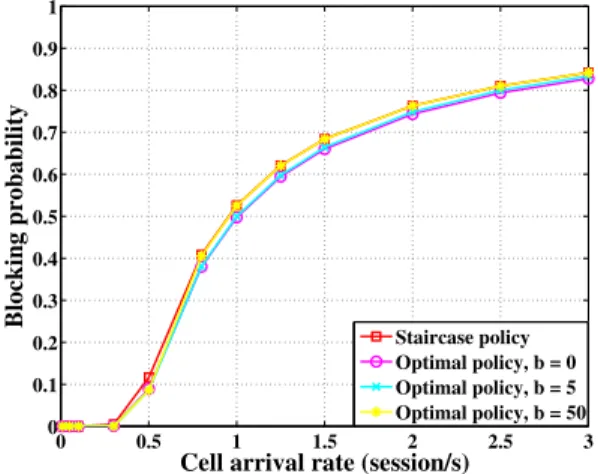
long-term fraction of time spent in the different states). In the following, to efficiently analyze the impact of the blocking cost
on Pb, we separately consider streaming and elastic sessions.
The service time of elastic sessions depends both on their
size assumed to be exponentially distributed with a mean of5
Mbytes, and on their perceived throughputs. As shown before,
the lower b, the higher the network total throughput leading
to lower average service times. When the optimal policy is adopted (i.e., the actions are fixed to the optimal ones), the SMDP may be reduced to a Markov chain, where departure rates increases with decreasing blocking costs. As a result,
for a given cell arrival rate, the lower b, the lower the
long-term number of simultaneous sessions. This also means that,
although the lower b the higher the percentage of blocking
states, the long-term fraction of time spent in these states is
reduced as b is low. Accordingly, the lower b, the lower Pb
for elastic sessions as illustrated in Fig. 5.
0 0.5 1 1.5 2 2.5 3 0 0.1 0.2 0.3 0.4 0.5 0.6 0.7 0.8 0.9 1
Cell arrival rate (session/s)
Blocking probability
Staircase policy Optimal policy, b = 0 Optimal policy, b = 5 Optimal policy, b = 50
Fig. 5. Blocking probability for elastic sessions
Nevertheless, the service time of streaming sessions exclu-sively depends on their duration, considered to be
exponen-tially distributed with a mean of45 s. Thereby, maximizing the
network total throughput will not reduce average service times. Consequently, as the number of blocking states increases with
decreasing b, the blocking probability for streaming sessions
also increases (cf. Fig. 6). The long-term fraction of time spent in all blocking states will actually be higher. Here again, for both traffic classes, the performance of the staircase policy
with carefully chosenS1 andS2 is comparable to the optimal
one (b = 50). 0 0.5 1 1.5 2 2.5 3 0 0.1 0.2 0.3 0.4 0.5 0.6 0.7 0.8 0.9 1
Cell arrival rate (session/s)
Blocking probability
Staircase policy Optimal policy, b = 0 Optimal policy, b = 5 Optimal policy, b = 50
Fig. 6. Blocking probability for streaming sessions VI. CONCLUSION
In this paper, a Semi-Markov Decision Process is used to dynamically derive QoS information for RAT selection in heterogeneous wireless networks. Through numerical results, we demonstrate the network ability to globally control users decisions in a way to maximize its long-term reward. We also show how the blocking cost may be tuned to control opti-mization objectives, aligning with user needs and preferences. Besides, we prove that the intuitive and logical staircase policy,
with carefully chosen S1 and S2 thresholds, provides very
close performances to the optimal one. REFERENCES
[1] M. Ibrahim, K. Khawam, and S. Tohme, “Network-Centric Joint Ra-dio Resource Policy in Heterogeneous WiMAX-UMTS Networks for Streaming and Elastic traffic,” in Proc. IEEE WCNC, April 2009. [2] J. P. Singh, T. Alpcan, P. Agrawal, and V. Sharma, “A Markov Decision
Process based Flow Assignment Framework for Heterogeneous Network Access,” Wireless Network Journal, February 2010.
[3] X. Zhang, H. Jin, X. Ji, Y. Li, and M. Peng, “A Separate-SMDP Ap-proximation Technique for RRM in Heterogeneous Wireless Networks,” in Proc. IEEE WCNC, April 2012.
[4] L. Zhu, F. Yu, B. Ning, and T. Tang, “Cross-Layer Handoff Design in MIMO-Enabled WLANs for Communication-Based Train Control Systems,” IEEE Journal on Selected Areas in Communications, 2012. [5] F. Bari and V. C. Leung, “Automated Network Selection in a
Heteroge-neous Wireless Network Environment,” IEEE Network Journal, January - February 2007.
[6] L. Wang and D. Binet, “Mobility-Based Network Selection Scheme in Heterogeneous Wireless Networks,” in Proc. IEEE VTC, April 2009. [7] O. E. Falowo and H. Anthony Chan, “Dynamic RAT Selection for
Mul-tiple Calls in Heterogeneous Wireless Networks Using Group Decision-Making Technique,” Computer Networks Journal, March 2012. [8] Q.-T. Nguyen-Vuong, N. Agoulmine, E. Cherkaoui, and L. Toni,
“Mul-ticriteria Optimization of Access Selection to Improve the Quality of Experience in Heterogeneous Wireless Access Networks,” IEEE Transactions on Vehicular Technology, May 2013.
[9] M. El Helou, S. Lahoud, M. Ibrahim, and K. Khawam, “A Hybrid Approach for Radio Access Technology Selection in Heterogeneous Wireless Networks,” in Proc. EW, April 2013.
[10] M. L. Puterman, Markov Decision Processes. (John Wiley, 1994). [11] “IEEE Standard for Architectural Building Blocks Enabling
Network-Device Distributed Decision Making for Optimized Radio Resource Usage in Heterogeneous Wireless Access Networks,” IEEE 1900.4-2009. [12] M. El Helou, S. Lahoud, M. Ibrahim, and K. Khawam, “Satisfaction-based Radio Access Technology Selection in Heterogeneous Wireless Networks,” in Proc. WD, November 2013.