HAL Id: dumas-02371027
https://dumas.ccsd.cnrs.fr/dumas-02371027
Submitted on 19 Nov 2019
HAL is a multi-disciplinary open access archive for the deposit and dissemination of sci-entific research documents, whether they are pub-lished or not. The documents may come from teaching and research institutions in France or abroad, or from public or private research centers.
L’archive ouverte pluridisciplinaire HAL, est destinée au dépôt et à la diffusion de documents scientifiques de niveau recherche, publiés ou non, émanant des établissements d’enseignement et de recherche français ou étrangers, des laboratoires publics ou privés.
Pest incidence and biological regulations in an apple
treebased agroforestry system
Camille Perseval
To cite this version:
Camille Perseval. Pest incidence and biological regulations in an apple treebased agroforestry system. Life Sciences [q-bio]. 2019. �dumas-02371027�
AGROCAMPUS OUEST
Année universitaire : 2018-2019 Spécialité :
Ingénieur agronome
Spécialisation (et option éventuelle) : Agroecology
Mémoire de fin d’études
Pest incidence and biological regulations in an apple
tree-based agroforestry system
Par : Camille PERSEVAL
Soutenu à Rennes le 11/09/2019
Devant le jury composé de :
Président : Guénola PERES Maître de stage : Pierre-Eric LAURI
Enseignant référent : Manuel PLANTEGENEST
Autres membres du jury (Nom, Qualité) : Sylvain Poggi, Examinateur
Les analyses et les conclusions de ce travail d'étudiant n'engagent que la responsabilité de son auteur et non celle d’AGROCAMPUS OUEST
Ce document est soumis aux conditions d’utilisation
«Paternité-Pas d'Utilisation Commerciale-Pas de Modification 4.0 France» disponible en ligne http://creativecommons.org/licenses/by-nc-nd/4.0/deed.fr
i
Acknowledgments
I hope that I will not forget anyone...
I thank Pierre-Eric Lauri for guiding me, his availability and advice throughout this internship. Thanks to Benjamin Pitchers, for all the exchanges, discussions and advice given in the GAFAM plot. I would also like to thank Manuel Plantegenest for patiently scattering "little stones" on my path, conductive threads and supports. In the same way, I would like to thank Guénola Pérès for her support. Thanks to Sylvaine Simon and Karine Morel for the time given and the theoretical and practical contributions on the fascinating world of pests and natural enemies in orchards. I am grateful to Tarek Dardouri and Guillaume Frémondière for the knowledge shared on companion planting in orchard. Thanks to Delphine Mézière for the support, advice, and assistance provided in the second part of my work. I would like to thank Sébastien Boinot for the lighting. Marie Gosme, Arnaud Soulier and Tristan Rialland, thank you for the introduction and help to programming ! I am grateful to Pierre Dul for agreeing to make my "little hand" scribe, even 2 hours a week is a lot! Thank you to Pierre Franck and Cécile for their help in Sentinel-prey card confection. I would like to thank Jean-Michel Ricard and Mélissandre Gabet for their help in identifying the spiders. Thanks to Alain Sellier for the technical support and discussions. Thank you to the colleague trainees, for supporting me and for the sharing.
Thanks to Antoine for the precious help on the redaction/organization of my ideas. Thank you, Sylvia Guglielmi, for the shared moments (what a chance that Evelyne de Saint Léger made the link between us !)
I am grateful to the wind that caused the Whale to strand on this piece of land in Mauguio, allowing me to meet very nice people and put the hands in the soil (‘till the nose). “C’est LEPIED !” Thank you, Manon and Laurie, for this golden “ColOccitanie”. I thank the neighbouring roommates, literally explosive (too bad for your windows... good wind in your new apartment!)
Finally, thank you to my family and friends for "supporting" me ! Thank you "big brother" Jonathan for the big breath of oxygen.
ii
Summary
Acknowledgments ... i Summary ... ii Abbreviations ... vi Introduction ... 1 Bibliography ... 11) Challenges for apple production ... 1
2) Implementing Agroforestry Systems with apple trees ... 2
3) Pests and diseases: core challenge in apple production ... 2
4) Biological regulation of apple pests ... 3
5) Questioning the arthropod prevalence in multi-strata FT-AFS ... 4
Context of the study and scientific question ... 5
1) System studied and context of the study ... 5
2) Scientific question ... 5
2.1) Work investigated... 5
2.2) Studying pest incidence, natural enemies and natural regulations, hypothesis (Part 1) ... 5
2.3) Proposal of Agroecological Infrastructures (Part 2) ... 6
Part 1: Studying pest incidence, natural enemies and biological regulations ... 6
1) Material and Methods ... 6
1.1) Description of the experimental site and design of the system experiment... 6
1.1.1) Experimental site, climate and soil characteristics ... 6
1.1.2) Plantation design and plant material ... 7
1.1.3) Core explanatory variable: treatment and Neighborhood Crowding Index ... 7
1.1.4) Cropping management practices ... 8
1.2) Arthropods survey: aphid pests and natural enemies ... 8
1.2.1) Dysaphis plantaginea and Aphis sp incidence ... 8
1.2.2) Incidence of Cydia pomonella ... 9
1.2.3) Dysaphis plantaginea colonies: population dynamics, ants and natural enemies ... 9
iii
1.3.1) Dysaphis plantaginea and Aphis spp incidence ... 10
1.3.1.1) Evolution of the incidence at tree scale ... 10
1.3.1.2) Evolution of the proportion of infested shoots ... 10
1.3.2) First generation Cydia pomonella incidence ... 11
1.3.3) Predators, D. plantaginea and biological regulation of D. plantaginea in D. plantaginea colonies... 11
1.3.3.1) D. plantaginea and predators’ abundances ... 11
1.3.3.2) Phenology of ants ... 11
1.3.3.3) Interactions within the colonies: regulations and myrmecophily ... 11
2) Results ... 12
2.1) Incidence of the 3 main apple pests ... 12
2.1.1) Incidence of D. plantaginea ... 12
2.1.1.1) Evolution of the incidence at tree scale ... 12
2.1.1.2) Evolution of the number of infested shoots at tree scale ... 12
2.1.2) Incidence of Aphis sp ... 13
2.1.2.1) Evolution of the incidence at tree scale ... 13
2.1.2.2) Evolution of the number of infested shoots at tree scale ... 13
2.1.3) Incidence of the first generation of C. pomonella ... 14
2.2) D. plantaginea colony ecosystem: population dynamics of D. plantaginea, abundances of predators and ants, and interactions between taxa ... 14
2.2.1) D. plantaginea, predators’ and ants’ abundance within the colonies ... 15
2.2.2) Phenology of ants ... 15
2.2.3) Interactions of predation and myrmecophily ... 15
3) Discussion ... 16
3.1) Impact of AF on pests, predators and biological regulations ... 16
3.1.1) Incidence of D. plantaginea and Aphis sp ... 16
3.1.2) Incidence of C. pomonella ... 18
3.1.3) Colonies of D. plantaginea: D. plantaginea dynamics, ants and predators ... 18
3.1.3.1) Global abundances of predators and their sequential arrival ... 18
iv
3.1.3.3) D. plantaginea regulations and ants-attendance ... 19
3.2) Limits of the methods used: well suited to disentangle a walnut tree effect? ... 21
3.2.1) System design and age ... 21
3.2.2) NCI variable or treatment? ... 21
3.2.3) Methods used for pest survey ... 22
3.2.4) Validity of the statistical models used ... 22
3.3) Interest of multi-strata AT-AFS with walnut trees for improving pest control ... 23
Part 2: Diagnosis and proposal of Agroecological Infrastructures (AEI)... 24
1) Context and objective of the proposal ... 24
2) Materials and Methods ... 24
3) Diagnosis and proposal ... 25
3.1) Existing AEI within and around the plot ... 25
3.2) Proposal of improvements and new AEI ... 25
Conclusion ... 26
References ... 27
Appendices ... 36
Appendix I: Biology and lifecycle of Cydia pomonella ... 36
Appendix II: Biology and lifecycle of Aphis pomi ... 38
Appendix III: Biology and lifecycle of Aphis spiraecola ... 39
Appendix IV: Biology and lifecycle of Dysaphis plantaginea ... 40
Appendix V: Beating tray at the beginning of D. plantaginea migration ... 41
Appendix VI: Sentinel-prey cards in apple tree canopy ... 45
Appendix VII: Earwig and spider monitoring through strap strips sampling ... 48
Appendix VIII: Microclimate in the plot during the monitoring period ... 51
Appendix IX: Evolution of the incidence at tree scale of D. plantaginea and Aphis sp. Estimates for the NCI of the GLM model ... 54
Appendix X: Sum of the number of ants and of natural enemies according to the NCI ... 55
Appendix XI: Explained variances, correlations and their significance between variables and axes for the PCA designed to study interactions within D. plantaginea colonies ... 56
v Appendix XIII: List of the shrub and tree species in the hedges surrounding the plot ... 60
vi
Abbreviations
AC: Agricultural Control
AEI: Agroecological Infrastructures AF: Agroforestry
AFIR: Agroforestry Inter-Row AFR: Agroforestry Row AFS: Agroforestry Systems AUC: Area Under the Curve
FT-AFS: Fruit-Tree based Agroforestry Systems GLM: Generalized Linear Models
GLMM: Generalized Linear Mixed Models
INRA: French National Institute for Agricultural Research N: Nitrogen
NCI: Neighbourhood Crowding Index NE: Natural Enemies
NS: Not Significant RAA: Rosy Apple Aphid
SYSTEM: the joint research unit “Tropical and Mediterranean Cropping System Functioning and Management”
1
Introduction
AgroForestry (AF) represents an opportunity to increase the resilience and sustainability of current production systems, and promote pest regulation by increasing the plant diversity, especially for fruit production. Inspired from multi-strata tropical AgroForestry Systems (AFS) with perennials and based on the assumption that shade trees can benefit to fruit trees by mitigating microclimatic stresses, an INRA innovative system have been developed by the joint research unit SYSTEM Tropical and Mediterranean Cropping System Functioning and Management. Apple trees were planted as an intermediate stratum under a walnut tree upper stratum. Impact of such design on pest dynamics, Natural Enemies (NE) and biological regulations have not been addressed for the moment. This work is integrated in this effort of knowledge acquirement. We especially focused on Dysaphis plantaginea,
Aphis sp, Cydia pomonella for pests, and on NE present in apple tree canopy and D. plantaginea
colonies.
This work is divided into two parts that are dealt separately:
1) Assessment of the impact of AF context on pests, NE and biological regulations.
2) Proposal of enrichment in AgroEcological Infrastructures (AEI) in order to enhance pest control.
After presenting the knowledge background of this study, the context, scientific question and hypothesis are presented. For part one, the material and methods developed to answer the question is explained. Results are then presented and discussed. To finish, part two makes the diagnosis of existing AEI in the current AFS and propose enrichment of AEI.
Bibliography
1) Challenges for apple production
Apple (Malus domestica) is among the main fruit produced in temperate regions (Lauri and Simon, 2018), with about 83 M tons of fruit produced in 2017 (FAO, 2019). Sustainability and resilience of conventional apple production systems are questioned (Parisi et al., 2014; Gliessman and Engles, 2015; Simon et al., 2016). Protection from pests and diseases is a core challenge, intertwined with the reduction of pesticide use fostered at European and National levels (eg Ecophyto in France) (Ministère de l’Agriculture et de l’Alimentation, 2018; Labeyrie et al., 2018). These products have known detrimental effects on environment and generate risks for human health (Aubertot et al., 2005). In France, the Frequency of Treatment Index is about 35 for apple, as one of the most elevated among temperate fruit-trees (Labeyrie et al., 2018). Redesign of current cropping systems is needed, especially considering agroecological principles that aim at enhancing Ecosystem Services’ (ES) provisioning (eg biological control), diversifying production and decreasing the reliance on external inputs and negative impacts on
Figure 1: Cydia pomonella adult (left, ©Ephytia, 2015) and larva exiting apple fruit (right, ©Washington State University)
Table 1: Main characteristics of the predominant aphids occurring on apple tree (Ricard et al., 2012)
Species Reproduction Number of host Primary host Secondary host
Aphis pomi Holocyclic (1) Monoecious (3) Apple, Pear
-Aphis spiraecola
Anholocyclic in Europe (2) and Holocyclic in the rest of the world
Dioecious (4) Spirea, Citrus
Various species (20 botanical families) including Apple, Pear,
Citrus
Dysaphis plantaginea Holocyclic Dioecious Apple Plantago sp
Eriosoma lanigerum Anholocyclic Monoecious - Apple, Hawthorn
Rhopalosiphum insertum Holocyclic Heteroecious Apple, Pear, Hawthorn Grasses
(2) Anholocyclic: species which lost totally or partially the ability to reproduce through sexual reproduction and that multiplicates parthenogenetically
(1) Holocyclic: species having a complete biological cycle with two types of reproduction (sexual and asexual)
(3) Monoecious species: species achieving the totality of its lifecycle on plant from the same species
2 environment (Hill and MacRae, 1996; Wezel et al., 2009; Simon et al., 2011; Gliessman and Engles, 2015) .
2) Implementing Agroforestry Systems with apple trees
Implying a deliberate integration of trees in agricultural systems, or considering already established ligneous species, AFS represent an opportunity for agrosystem redesign (Dupraz and Liagre, 2011). Van Noordwijk and Sinclair (2016) redefined AF as a “type of land use combin[ing] aspects of agriculture and forestry, including the agricultural use of trees”, highlighting 1) the increase in diversity and complexity, 2) the diversity among AFS (planted species, spatio-temporal arrangement, management and purposes). AFS are assumed to enhance various ES among which provisioning, regulating (eg pest control) and maintenance, and cultural ones (Jose, 2009; Lovell et al., 2018; Haines-Young and Potschin, 2017).
With their high value for AF, fruit trees are the main component of many AFS in tropical areas (Nair, 1991 ; Jha et al., 2011). Yet, in temperate countries, Fruit Tree-based AgroForestry Systems (FT-AFS) represent a tiny fraction of the area covered by orchards (5.98% of the total area planted with fruit in Europe) (Lauri et al., 2019). Lovell et al. (2018) proposed the concept of “Multifunctional Woody polyculture” to name the association of different fruit tree species (and shrubs) and/or with a forest tree species, emphasizing the potential for production, as well as ES provisioning. Though woody polycultures represent 20% of the FT-AFS area, intercropping of fruit trees with forest trees is very scarce (Lauri et al., 2019). In AFS, apple trees are mainly used as the upper stratum, in silvopastoral systems (eg ‘pré-verger’), or associated with annual crops (Lauri et al., 2016 ; 2019).
Taking the example of tropical AFS, the integration of fruit-trees, and especially apple trees as an intermediate layer, under an upper stratum composed of timber/nut tree, might be promising for Mediterranean areas (Lauri et al., 2016). In these regions with high solar irradiance and dry climate, even if competition for light and nutrients can affect fruit tree growth and cropping, the main expected benefits are related to the mitigation of microclimatic stresses for apple tree (Lauri et al., 2016), eg light and heat excess, that can alter fruit quality (sunburn) and leaf functioning (photooxidative damage) (Correlli-Grappadelli and Lakso, 2007; Racsko and Schrader, 2012). Then, it is necessary to assess pests and diseases’ dynamics and possible biological regulations in such systems.
3) Pests and diseases: core challenge in apple production
Various pests and diseases attack apple tree. Key pests of apple, on which I will focus, are the codling moth Cydia pomonella (Lepidoptera, Tortricidae) (Dorn et al., 1999) and aphids (Hemiptera, Aphididae) (Blommers et al., 2004).
C. pomonella larvae causes direct damage to fruit cropping (Kuhrt et al., 2006b) (figure 1). In
Mediterranean regions, three successive generations of C. pomonella can occur each year, which substantially increases the potential for fruit damage (Trillot et al., 2002) (appendix
Figure 2: Aphis pomi (left) and Aphis spiraecola (right) in their apterous forms (© INRA Bernard Chaubet)
Figure 3: Dysaphis plantaginea in apterous (left) and winged (middle) forms (© INRA Bernard Chaubet), and example of damages caused on a floral shoot (leaves curling and depigmentation) by a colony of D. plantaginea
3 The apple tree hosts different aphids (sap-sucker insects), the main being: Aphis pomi, Aphis
spiraecola, Dysaphis plantaginea, Eriosoma lanigerum and Rhopalosiphum insertum (table 1). A. pomi
and A. spiraecola are problematic in case of severe attack or on young trees, leading to leaf curling, depigmentation and sooty mold fungi development (Lathrop, 1928). A. pomi is totally dependent to apple tree whilst A. spiraecola has a wide range of hosts (table 1). They have different lifecycles (appendices II and III), occur during all the growing season of apple tree and are difficult to distinguish (figure 2): molecular tools are required (Naaum et al., 2012).
D. plantaginea – Rosy Apple Aphid (RAA) – is the most damaging aphid on apple tree (figure
3) (Blommers et al., 2004). Holocyclic and dioecious, it spends autumn, winter and spring on its primary host, Malus domestica (Rosaceae), and migrates by the end of Spring/onset of Summer on its secondary host, Plantago sp (Lamiales, Plantaginaceae) (Bonnemaison, 1959). Return migration in autumn from plantain to apple tree is associated to the unique sexual generation, giving overwintering eggs on apple trees. Parthenogenetic reproduction occurs the rest of the year (Bonnemaison, 1959). Information on the lifecycle of RAA is available in appendix IV. Rapid outbreaks of D. plantaginea cause severe damages on apple tree, impacting tree growth and production performances the year of the infestation but also the following years (Blommers et al., 2004; Lathrop, 1928). They generate leaf curling and thickening, and shoots malformations (figure 3), leading to shoot growth arrest (Trillot et al., 2002) and impairing flowering the following year (Bonnemaison, 1959). Finally, honeydew promotes the development of sooty mold fungi (Angeli and Simoni, 2006). As A. pomi, D. plantaginea is myrmecophilous, ie involved in mutualistic interaction with ants: while ants benefit from honeydew, less mortality of aphid colonies and lower predation in presence of ants are reported (Stadler and Dixon, 1999; Stewart-Jones et al., 2008; Miñarro et al., 2010). After inadequate control, 20 to 40% (Blommers et al., 2004), even 80% (Qubbaj et al., 2005) of damaged, non-marketable, fruits are reported. Its high precocity and fecundity lead to a low threshold of tolerance (1 aphid/100 shoots) (Trillot et al., 2002), especially in organic farming (Wyss et al., 1999) where available control levers are restricted (contact insecticides, kaolin…).
4) Biological regulation of apple pests
In this report, we distinguished auxiliaries, Natural Enemies (NE) and predators. Auxiliaries correspond to the fauna beneficial to the agrosystem, including natural enemies (NE) and pollinators for example. NE regroups predators and parasitoids.
Biological regulation represents an opportunity for pest control in orchards. In this report, regulation designate the existence of a “beneficial action of parasites, pathogens and predators in managing pests and their damages (University of California Agriculture and Natural Resources, 2014). As perennial, diverse and multi-strata systems, orchards have great potential for pests and diseases’ populations build up, but also for NE promotion (Nicholls and Altieri, 2004; Simon et al., 2010; Demestihas et al., 2017).
Table 2: Main natural enemies reported as exerting aphid control in fruit trees in Europe (adapted from Ricard et al., 2012). L: Larvae; A: Adult; Juv.: Juvenile. NA: Classification not relevant. For some taxa (eg Carabids, Spiders, Heteroptera), potential for aphid predation depends on the
4 This topic has been extensively studied in orchards (Miñarro et al., 2005; Brown and Mathews, 2007; Simon et al., 2010; Dib, 2010), especially on how to promote natural regulation targeting aphids such as RAA (Wyss, 1995; Albert, 2017; Cahenzli et al., 2019). In orchards, various arthropods have been reported as predating or parasitizing aphids, more especially in the colonies on apple trees (table 2). These NE are parasitoids or predators – the latter categorized as specialists (eg Syrphidae) or generalists (eg spiders) (Box 1). According to their phenology and ecology, the different taxa of NE can act complementary at different periods in D. plantaginea lifecycle either on apple trees (Miñarro et al., 2005) or on Plantago (Ricard et al., 2012). In RAA colonies in South-Eastern France, Syrphidae were the earliest in spring, followed by ladybirds and earwigs (Dib, 2010). Most of the studies conclude that NE exerted predation on RAA, but insufficient to maintain populations under the economic acceptable threshold of 1 aphid colony over 100 shoots (Blommers et al., 2004; Miñarro et al., 2005; Brown and Mathews, 2007; Dib, 2010).
5) Questioning the arthropod prevalence in multi-strata FT-AFS
AFS participate to the spatial and temporal diversification of crop and non-crop habitats, which promotes associated diversity such as arthropods and more especially NE (Stamps, Linit, 1998; Hatt et al., 2018). In a meta-analysis, Pumariño et al. (2015) concluded that NE were more abundant in AFS, and that pest abundance was lower only in AFS with perennials (coffee, cacao and plantain). Though AFS is proposed as a lever to enhance biological control (Altieri and Nicholls, 2004; Jose, 2009; Hatt et al., 2018), results depend on environmental context, system design, management practices, insect pest and NE species (Schroth et al., 2000; Chaplin-Kramer et al., 2011). In AFS with perennial crops, impact of shade trees (upper layer) on pests and diseases of the shaded crop is widely investigated in tropical systems (mainly with cocoa and coffee crops) (DeClerk, 2012; Andres et al., 2016). Contrasting results have been obtained in this area, with shade trees reported either as promoting or hampering pests and diseases. According to Andres et al. (2016), this is linked to different levels of shade cover and management between studies.
This topic has been poorly addressed for FT-AFS in temperate regions, and to our knowledge no evidence exists on pest and NE dynamics and regulations with apple trees grown under a shade tree.
Box 1: Generalities about specialist and generalist predators
Specialist predators are generally density-dependent: their populations increase or decrease in synchrony with that of their prey, and these predators rely totally on one or few taxa of prey – for at least one period of their lifecycle. For some predators, not all the stages feed on aphids, eg larvae of Syrphidae feed on aphids while adults are pollinators (Ricard et al., 2012). Populations of generalist predators are less synchronized with that of their prey, and these predators can act at tipping points in aphid lifecycle (Ricard et al., 2012). For example, spiders are reported to regulate RAA population in autumn during migration return on apple tree (Wyss et al., 1995), and to exert predation on winter eggs and newly hatched fundatrices during Spring onset (Boreau de Roincé et al., 2012). Synchronicity between a prey and its predator is crucial (Boyer et al., 2017): the earliest their predation activity in the pest lifecycle, the most efficient the control by NE is expected (Ricard et al., 2012).
5
Context of the study and scientific question
1) System studied and context of the study
Based on the assumption that shade trees can benefit to apple trees in the Mediterranean zone by mitigating microclimatic stresses, an INRA (French National Institute of Agricultural Research) innovative and unique system is currently tested by the joint research unit SYSTEM, located in the Restinclières AF Platform, South of France (website UMR SYSTEM, 2018). The GAFAM (Growing AgroForestry with Apple-Montpellier/Mediterranean) system consists of forest trees (25-year-old walnut trees - upper layer), apple trees (4-year-old - intermediate layer) and herbaceous legume groundcover (2-year-old sainfoin) associated in an alley cropping AFS. The initial question addressed was the impact of walnut trees on apple tree architecture, ecophysiology and fruit production, related to competition for light. It is also important to integrate the effect on pests and diseases, and on mechanisms of biological regulation.
Pests dynamics and natural regulations topic has not been assessed for such innovative system. To address this question, the system was integrated in the five-year research program ALTO (“Systèmes en ArboricuLture et Transition agrOécologique”) “Arboriculture Systems and Agroecological Transition” - launched in 2018 (Le Bars et al., 2018). Part of Ecophyto call, this project regroups three system experiments, and aims at designing innovative, low- to no-input apple production systems, evaluating them and sharing the knowledge (Le Bars, 2018). The work presented here takes part in this project, addressing biological regulations in this multi-strata Apple tree-based AFS.
2) Scientific question
2.1) Work investigatedThis work was divided into two parts: first, it aimed at studying the impact of AF context on apple tree pests, NE and regulations (part 1). Then, the goal was to propose to enrich the already existing AEI, targeting improvement of biological regulations (part 2).
2.2) Studying pest incidence, natural enemies and natural regulations, hypothesis (Part 1) I first studied if the AF context, through walnut tree shade and presence, affect the incidence of 3 main apple pests – D. plantaginea, Aphis sp (dynamic) and C. pomonella. Then, I concentrated more precisely on RAA population dynamics along with NE – particularly predators – and ants, in marked colonies, to determine if the AF context impact NE and to study the interactions within this ecosystem. NE in apple tree canopy were surveyed with static sampling - beating, strap strips -, and sentinel-prey card method was tested to estimate pests’ predation activity (exploratory work, appendices V to VII).
A continuous variable characterizing the environment in walnut – proxy of AF context – was introduced as explanatory variable (Neighbourhood Crowding Index, see Material and Methods). This variable tightly correlates with ecophysiological and production responses of apple tree: one may wonder if it has also a meaning in terms of arthropod dynamics.
Figure 4: Main hypotheses of the effect of walnut tree presence on arthropods. H1 and H1’’: hypotheses that are going to be tested
Box 2: Agroecological Infrastructures (AEI)
Implementation of AEI is an approach integrated into the framework of “Conservation Biological Control”, which “aims to enhance pest control, by 1) improving resources for natural enemies through habitat enhancement, and 2) reducing pesticide-induced mortality in NE population” (Holland et al., 2016). Maintenance or implantation AEI or Semi-Natural Habitats are a lever to achieve this goal. AEI can be defined as “any agroecosystem’s habitat in or around which a spontaneous vegetation […], or a sown cover crop intentionally not harvested, develops” (Sarthou, 2016). It regroups a diversity of habitats (hedges, wood, grass strips, rocks, water pond…). AEI aim at increasing the diversity and abundance of NE in the crop by increasing floral diversity and providing complementary, supplementary resources such as food, oviposition site and shelter from adverse conditions (eg overwintering, agricultural disturbances…) (Landis et al., 2000; Ricard et al., 2012).
6 Some hypothesis can be proposed regarding the effect of AF context on the studied pests and their NE (figure 4). Only the hypotheses H1 and H1” are going to be tested in this report.
First, it can be supported that walnut tree presence positively impacts arthropods abundance (H1) - either NE or pests (especially the incidence of the latter) by creating a more favourable microclimate for them - typically in AFS (Altieri and Nicholls, 2004) -, and by providing them an undisturbed shelter (Stamps and Linit, 1998; Altieri and Nicholls, 2004). For these reasons, AF context might also lead to changes in the phenology of these arthropods (H1”). Walnut trees can also act complementary as a physical barrier to pest colonization (eg C. pomonella). As hybrid, they are not reservoir for this pest (Ephytia, 2015).
On the other hand, while microclimate alteration has a slight positive effect on apple tree, light and nutrient competition impact negatively its growth (eg leading to more frequent and longer shoot growth cessation) and cropping (Pitchers, unpublished results). This is expected to negatively affect aphid dynamics (bottom-up processes, figure 4). Indeed, these latter are assumed to attack more severely the most vigorous plants (Grechi et al., 2008; Stoeckli et al., 2008).
Top-down processes (ie predation or parasitism by NE, figure 4) are also expected as regulating factors of pests.
In this current report, after presenting the methods used, the impact of AF - in the specific context of the experiment - on the incidence of the 3 pests followed, at apple tree scale, is presented. Then, I focussed on predators and biological regulations in D. plantaginea colonies.
2.3) Proposal of Agroecological Infrastructures (Part 2)
After presenting and discussing the results of part 1, I broaden the scope of my analysis with the proposal of enrichment in AEI that aim at promoting biological regulations in the specific context of the experiment (Box 2) - after a first diagnosis step.
Part 1: Studying pest incidence, natural enemies and biological
regulations
1) Material and Methods
1.1) Description of the experimental site and design of the system experiment
1.1.1) Experimental site, climate and soil characteristics
The system experiment is settled in the Domaine de Restinclières, in Prades-le-Lez town. This town is located at 20 km at the North of Montpellier, South of France (figure 5). The Hérault County Council owns this Domain which covers 220 ha. More than 40 ha are dedicated to agronomic research in AF and managed by INRA, since 1995 - date of tree plantation. The experimental plot ‘A1’ is situated in the South of the Domain (figure 5).
Figure 5: Domaine de Restinclières and experimental (or GAFAM) plot location (© Google Maps, UMR System)
Figure 6: Experimental design. AC: Agricultural control; AFIR: Agroforestry inter-row; AFR: Agroforestry row
Table 3: Number of apple trees per treatment and block. AC: Agricultural Control; AFIR: Agroforestry Inter-Row; AFR: Agroforestry Row
Block
Treatment AC AFIR AFR AC AFIR AFR
Nb of apple trees per treatment 18 40 25 8 45 12
Nb of apple trees per block Nb total
1 2
83 65
7 Lez has a Mediterranean climate and is situated 70 m above sea level. In Prades-le-Lez, mean minimal and maximal temperatures were respectively of 8.7°C and 18.8°C. Mean precipitation was about 745 mm. More information regarding on microclimatic variables on the plot A1 - temperature and radiation taken from a meteorological station - during the monitoring course in 2019 is provided in appendix VIII. Soil presents a clay loamy texture.
1.1.2) Plantation design and plant material
The plot A1 is bordered by hedges and riparian trees of Le Lez and Le Lirou rivers (figure 6). Information regarding the flora surrounding apple trees is provided in the 2nd part of this report.
In the plot, hybrid walnut trees (Juglans regia x Juglans nigra) were planted with cereals in 1995, for wood production - with 13m between the rows and 4m between trees within the row. This was an intercropping design, with an East-West row orientation (figure 6). A thinning operation in 2004 let half of these trees, unevenly. In 2011, alfalfa Medicago sativa replaced cereals.
Apple trees of ‘Dalinette’ variety grafted on G202 rootstocks were planted in April 2016, at a density of 1,125 trees/ha, separated by 1.3m on the row.Roughly, this variety is recommended in organic farming and has been selected for its resistance to scab (Vf gene). The rootstock, vigorous, presents a good ability to grow in poor soil conditions especially in replantation and a tolerance to telluric diseases (Lauri et al., 2019). The variety ‘Story’ was chosen as tree pollinator. In total, 148 apple trees were planted – 141 trees of ‘Dalinette’ and 7 trees of ‘Story’. Three treatments were distinguished (section 1.1.3). Sainfoin Onybrichis viciifolia replaced alfalfa blocks in 2018. Apple tree rows and mixed walnut-apple tree rows are separated by 6.5m. Walnut trees constitutes the upper stratum, covering walnut-apple trees at the intermediate stratum and the legume groundcover at the lower stratum.
1.1.3) Core explanatory variable: treatment and Neighborhood Crowding Index
Initially, three treatments, were distinguished (figure 6, table 3), as discrete explanatory factor: · Agricultural Control (AC): apple trees that receive little shade from nut trees, constituting
the control (internal to the experiment)
· Agroforestry inter-row (AFIR): apple trees planted at 6.5m of the walnut tree rows
· Agroforestry row (AFR): apple trees planted on the walnut tree rows
In order to have a better proxy of the heterogeneity in light interception brought about by walnut trees and of their influence on each individual apple tree, the Neighbourhood Crowding Index (NCI) has been introduced. This type of index is commonly used in forestry to assess competitive effects of neighbouring trees on a focal tree, assuming that competitive effects of these trees – partly related to light interception - increase with neighbouring trees’ size and proximity (Pretzsch, 1997; Canham et al., 2004; Fichtner et al., 2017; Andrés et al., 2018). According to preliminary results of B. Pitchers, this variable tightly correlates with some apple tree traits: architecture (eg number of branches), growth dynamics, and ecophysiology (unpublished results), and seems consistent to capture competitive effects of walnut tree on apple trees.
Figure 7: Scheme of Neighbourhood Crowding Index construction
Figure 8: Neighbourhood Crowding Index variability of the apple trees in the three treatments. Hemispherical pictures provide an objective measurement of the forecasted walnut tree shade variation in each treatment. For each treatment, boxplot figures the median, the interquartile range and the complete range of data variation (ac: Agricultural control, afir: Agroforestry Inter-row, afr: agroforestry row)
8 Here, this index has been calculated for each apple tree, as a continuous variable characterizing the “environment created by walnut trees”. Inspired from Canham et al. (2004), NCI was constructed as the sum of the cross-section area of each neighbour walnut tree within a 15m radius area around the apple tree, weighed by their distance to the apple tree (see equation 1; inspired from Canham et al., 2004) (figure 7). The 15m-radius has been reported by Canham et al. (2004) as enabling to catch the effective range of competitive interactions between neighbouring trees and corresponds approximately to the height of walnut trees. The cross-section area at breast height is used, as a proxy of walnut tree vigour, height, crown projection and forecasted shade at the equinox, and a scaling parameter for competitive effects (Canham et al., 2004; Fichtner et al., 2017).
Equation 1: !" = # $ (!%&'× ) *+ , '-) . = # $ #(DBH'/× 0 × ) 1× ) *+ , '-) . (Within a 15m radius)
With CSAi: Cross Section Area of the walnut tree i DBHi: Diameter at Breast Height of the walnut tree i di: distance between the apple tree and the walnut tree i
Most of pests and NE monitoring were made on a sample of 45 ‘Dalinette’ apple trees (15 per treatment) also followed by B. Pitchers. These trees were selected as having a relatively homogenous basal diameter for sap-flow measurements and then as being distributed along a gradient of NCI.
Initial treatments correspond to NCI classes that represent the gradient of competition, though they are overlapping slightly (figure 8). To render figures more readable, results on the evolution of arthropod abundances across the season were represented based on treatment distinction, while statistical analyses were done considering NCI as the independent continuous variable that represents more precisely AF context.
1.1.4) Cropping management practices
Apple trees are under organic and “low-input” management (Parisi et al., 2014), with advices from the CETA Hérault-Vidourle. No pruning or training operation on the apple trees themselves have been made. Figure 9 presents Cropping Management Practices on the plot in 2019.
1.2) Arthropods survey: aphid pests and natural enemies Monitoring had to be stopped from May 31st to June 17th.
1.2.1) Dysaphis plantaginea and Aphis sp incidence
Incidence of Aphis sp1 and D. plantaginea was followed dynamically at apple tree scale. It was assumed that not only NCI impacted the proportion of infested shoots, but also the type of shoots (floral vs vegetative) and the side of the tree (South vs North). From 0 to 4m high, shoots were browsed for absence/presence of each type of aphid. This monitoring was done on a sample of 45 apple trees (15 per treatment). A shoot was considered as infested when at least one aphid was noticed.
1 : It was not possible to determine according to morphological criteria whether the aphid Aphis spp infesting the plot was Aphis spiraecola and/or Aphis pomi.
9 The variable measured was thus the number of infested shoots – per aphid taxa, azimuth (ie North/South) and type of shoot (ie vegetative or floral). This survey was made weekly from the 10th of April to the 27th of June. D. plantaginea migrating in June (Bonnemaison, 1959), by the end only Aphis sp was followed.
Total number of vegetative and reproductive shoots was counted in June – per azimuth and type of shoot – in order to calculate the proportion of infested shoots for each apple tree.
1.2.2) Incidence of Cydia pomonella
At the end of the 1st generation of C. pomonella (July 8th), according to the BSV of the CETA Hérault-Vidourle, C. pomonella incidence on fruit was measured: on all the apple trees, all the fruit – after manual fruitlet thinning – were browsed for C. pomonella stings.
1.2.3) Dysaphis plantaginea colonies: population dynamics, ants and natural enemies
Marked colonies of D. plantaginea were monitored visually, weekly from April to the migration on plantain, based on the method used in previous studies. This allowed to access to aphid population dynamics and study the link with NE and ants (Dib, 2010; Albert, 2017).
Infested shoots were marked - between 0 to 1.7 m (for practical reasons) - at the phenological stage F/G of the apple tree, found by browsing all the trees of Dalinette variety planted in 2016 (119 trees), during 2 successive weeks. The 1st week, one colony on floral shoot on each tree detected as infested was marked. Initial idea was to have 30 shoots/treatment to cover the gradient of NCI. Vegetative shoots were first discarded, assuming dynamics to differ between inflorescence and vegetative shoots. At this first marking date, the effective in AC (n=14) and AFR (n=6) treatments were low. Thus, the 2nd week, it was decided to increase the number of shoots marked in AC and AFR, by adding one colony (when found) per infested tree and including vegetative shoots in the marked sample. Finally, the number of shoots marked was the following: 19 in AC, 41 in AFIR, 24 in AFR .
When one colony disappeared, it was replaced by another, ideally in the same tree or in a neighbour tree which had not already 2 marked colonies.
In the marked colonies, were counted the abundances of: · D. plantaginea (wingless and winged individuals) · Aphis sp, if present
· Ants
· Abundance by taxon of predators2 observed previously (Dib, 2010; Albert, 2017), and their stage (ie egg, larva, adult): Coccinellidae, Anthocoridae, Miridae, Nabidae, Syrphidae, Cecidomyidae, Chrysopidae, Hemerobiidae, Forficulidae, Hymenoptera, Arachnida.
2 : Number of parasitoids was not counted though few mummies were observed by the end of D. plantaginea migration, as their occurrence is reported as varying between studies (Albert, 2017) and delicate to assess
Table 4: Type of analysis/Model equations tested for each type of monitoring
Analysis Model equation Distribution family Link function
Incidence at tree
scale GLM Infested tree (0 or 1) ~ NCI (scaled) Binomial Logit
Proportion of
infested shoots GLMM
cbind(number of infested shoots, nuber of uninfested shoots) ~ NCI (scaled) + Azimuth + Type of shoots +
(1 | apple tree)
Betabinomial Logit
GLM cbind(nb of fruits damaged, nb of
fruits undamaged) ~ NCI (scaled) Betabinomial Logit
logAUC of D.
plantaginea GLMM
logAUC D. plantaginea ~ NCI (Scaled)
+ (1 | apple tree) Gaussian Identity
Abundance of ants and Natural
Enemies
GLMM
Nb of individuals for a given taxa ~ NCI (Scaled) + AUC D. plantaginea (Scaled)
+ (1 | apple tree)
Poisson Log
Phenology of
ants GLMM
Nb of ants ~ NCI + Abundance of D.
plantaginea Poisson Log
PCA Illustrative variables: NCI and relative
growth rate of D. plantaginea . Active -
-LM (first date) and GLMM
Relative growth rate of D. plantaginea
~ Predator + Ants + (1 | apple tree) Gaussian Identity
Variables studied Incidence D. plantaginea and Aphis spp Incidence C. pomonella D. plantaginea colonies Regulations
10 1.3) Statistical analyses
R software was used for statistical analyses (R Core Team). Generalized Linear Models (GLM) and Generalized Linear Mixed Models (GLMM) were mostly used (glmmTMB Package; Magnusson et al., 2019) with the choice of statistical laws depending on the studied variables (see below). Also, PCA was used (FactoMineR package; Husson et al., 2019). GLMM was used to introduce tree as a global random factor. For these models, normality and homoscedasticity conditions of the residuals are not expected (Zuur et al., 2009). Yet, model validation process is still debated, especially for GLMM (Zurr et al., 2009; J. Peyhardi, J.B Durand and C. Della Vedova, personal comm.). NCI was used as core explanatory continuous covariable in all these models. Based on Schielzeth (2010) recommendations, quantitative covariables (NCI, Area Under the Curve D. plantaginea) were first scaled (centred and standardized), except for models designed to study interactions between organisms (it would have modified the true estimates).
Binomial distribution was assumed to fit proportion and binary variables, Poisson distribution to fit count variables and normal distribution to fit continuous variables. Then, independence on the residuals, as well as overdispersion, were checked. Betabinomial (binary and proportion variables) and Negative binomial (count variables) distributions were used to tackle overdispersion (Zuur et al., 2013).
Considering the number of explanatory variables, and potentially the high number of possible interactions, even when restricting to order-two interactions, the choice was made to concentrate our analyses on the proper effects of explanatory variables.
Non-significance (NS) threshold was fixed at 5%.
1.3.1) Dysaphis plantaginea and Aphis spp incidence 1.3.1.1) Evolution of the incidence at tree scale
For each aphid taxa a new variable was created, corresponding to whether the tree was infested (1; at least one shoot with aphid) or not (0). The effect of NCI on the probability of a tree to be infested was assessed with a logistic regression, at each date (table 4). For RAA this was made on all dates while for Aphis spp this was possible only for the first and last two dates (all the trees infested the other dates).
1.3.1.2) Evolution of the proportion of infested shoots
This analysis was made on a sub-sample of trees (all infested; exclusion of not infested trees). Proportion of infested shoots were only calculated for dates for which the number of infested trees was above 5 trees per treatment (n = 15 trees per treatment). Model outputs were only interpreted for dates for which median proportion of infested trees were above 5%, to minimize observation bias. Four observations per tree were made (combination between azimuth and type of shoots), implying dependency in the data: observations within a same tree were more linked than observations between different trees. To include this dependency, a GLMM was used (Zuur et al., 2009), with apple tree as random effect, assumed to be a constant (random intercept).
11 All other factors were fixed (table 4). The aim being to compare between dates the effect and significance of the different variables, the same model was tested on each date separately, and no model selection was made.
1.3.2) First generation Cydia pomonella incidence
A GLM was tested on the number of fruits damaged over the total number of fruits (table 4)
1.3.3) Predators, D. plantaginea and biological regulation of D. plantaginea in D.
plantaginea colonies
1.3.3.1) D. plantaginea and predators’ abundances
For RAA, thanks to splinefun R function, a curve of the evolution of the number of D.
plantaginea was fitted, to access the Area Under the Curve (AUC) on all the survey period for each
colony. For ants and predators, the sum of each taxa over the entire monitoring period was computed for each colony. Then, a model GLMM was implemented for each taxon (RAA and predators) to test the effect of NCI (table 4). RAA AUC was integrated as a covariable in the model testing the effect on predators’ taxa, as RAA conditions the presence of predator (Albert, 2017). GLMM was necessary to account the fact that, in some apple trees, 2 colonies were surveyed: apple tree was integrated as intercept random effect (hypothesis of constant effect).
1.3.3.2) Phenology of ants
The analysis of the effect of AF on arthropod phenology could be made only on ants (not enough individuals in the other taxa of predators). For that, each date was analysed separately with a GLMM model, with ants’ abundances at each date explained by the NCI and the abundance of D. plantaginea in each colony (table 4). When median number of individuals were equal to 0, model outputs were not considered.
1.3.3.3) Interactions within the colonies: regulations and myrmecophily
For this analysis, the last date was discarded, being the end of D. plantaginea migration (June 27th). First, the relative growth rate of D. plantaginea was calculated thanks to a curve fitting (splinefun function, R) on the evolution of the number of D. plantaginea individuals in each colony (Equation 1 and 2; Albert, 2017). This latter can be considered as representing RAA population dynamics (Albert, 2017).
Equation 1: !(")
" = #r(t) × $(%)
with r(t) the relative growth rate at t :#&(%) = !(") !(")#×# "
Equation 2: &(%) = # !(") !(")#× " with !(")
" the first derivative of the evolution of the number of RAA at t $(%) the number of RAA observed at t.
Then, our aim was to have an overview of the potential predation and myrmecophily within the colonies (Albert, 2017). A first visualisation was made thanks to PCA (FactoMineR package), on each
Figure 10: Evolution of the number of infested trees by D. plantaginea according to the treatment. Monitoring had to be stopped between May 27thand June 17th. n = 15 trees per treatment
Figure 11: Evolution of the proportion of infested shoots by D. plantaginea per tree (median and interquartile range by treatment).
Figure and analysis were made excluding not infested trees. Results of significance using GLMM date per date are provided (n=45 trees). In blue: all the date with a median less than 5% of infested shoots are hardly interpretable.
ac: Agricultural control; afir: Agroforestry Inter-row; afr: Agroforestry row.
NCI: NCI effect; N: More infested shoots on the North side(Azimuth effect); I: Inflorescence more infested (Shoot type effect). NS: Not Significant; *: <0.05; **: <0.01; ***: <0.001
f th f fe ed ho by D. la ( di
Table 4: Evolution of the proportion of infested shoots by D. plantaginea per tree.
Effects of NCI, azimuth and shoot type on this proportion (n=45 trees). For each factor, the estimate (with significance) is given as a difference between a treatment indicated after the name of the variable and the reference treatment indicated between parentheses using GLMMs. Analysis was
made excluding not infested trees. In blue: all the date with a median less than 5% of infested shoots are hardly interpretable.
In bold: significant effects. NS: Not Significant; *: <0.05; **: <0.01; ***: <0.001 NCI Azimuth: South (North) Shoot type: Vegetative
(Inflorescence) 10/04/2019 0.50 (***) -0.294(NS) -1.78(***) 18/04/2019 0.372 (**) -0.303 (NS) -1.26 (***) 24/04/2019 0.278 (*) -0.212 (NS) -0.788 (***) 02/05/2019 0.235 (NS) -0.362 (*) -0.983 (***) 09/05/2019 0.340 (NS) -0.301 (NS) -0.707 (***) 16/05/2019 0.259 (NS) -0.156 (NS) -0.802 (***) 23/05/2019 0.175 (NS) -0.173 (NS) -0.917 (***) Date Estimate (significance)
12 date separately (from the 15th of April to the 27th of May) with the number of individuals in each taxon of arthropods (active variables), the relative growth rate of D. plantaginea and NCI (illustrative variables). For each date, only taxa observed more than 5 times were included as active variables (if not, they were put as illustrative variable). Significance threshold for correlation with the dimensions was fixed at 5%. To go further, interactions were analysed based on the hypothesis that the population of RAA within a colony evolves according to its intrinsic growth rate r, and to the number of predators and ants. It can be assumed that predators (P) will eat a number of aphids that will depend on the total number N of aphids (e), e being expected to be negative (Equation 3 and 4). Similarly, ants (A) might have the same kind of effect but either positive or negative (h) according to the period (Equation 3 and 4).
Equation 3: !(")
" = #$(%) + &'$(%) × *(%) + ,-(%) × $(%) which gives
Equation 4: !(")
!(")× "= # + '*(%) + ,-
Except for the first date were LM was required (a unique colony per apple tree), a GLMM was performed (several colonies per tree) on this hypothesis at each date separately (to be consistent with the PCA). Relative growth rate was assumed to follow a gaussian distribution, and apple tree as being a constant random effect (random intercept).
2) Results
2.1) Incidence of the 3 main apple pests
2.1.1) Incidence of D. plantaginea
2.1.1.1) Evolution of the incidence at tree scale
Regardless the date, the proportion of infested trees (ie having at least one shoot with D.
plantaginea) seemed to vary but not to be linked to the AF context (figure 10) (n = 15 trees per
treatment). At some dates, almost all trees were infested (ie May 16th). Probability to be infested for a given tree was not significantly correlated to the NCI, as confirmed by the GLM performed (appendix IX).
2.1.1.2) Evolution of the number of infested shoots at tree scale
The evolution of the proportion of infested shoots was similar over the three treatments and variable within treatment (figure 11). Only three dates were interpretable, ie having a median proportion of infested shoots above 5% (from May 9th to May 23rd). The analysis date per date outlined no significant effect of the NCI after May 2nd, as for the Azimuth (figure 11 and table 4). For all the dates, vegetative shoots were significantly less infested in proportion than floral ones (negative estimates).
Figure 13: Evolution of the proportion of infested shoots by Aphis sp per tree (median and interquartile range by treatment).
Figure and analysis were made excluding not infested trees. Results of significance using GLMM date per date are provided (n=45 trees). In blue: all the date with a median less than 5% of infested shoots are hardly interpretable.
Monitoring had to be stopped between May 27thand June 17th. ac: Agricultural control; afir: Agroforestry Inter-row; afr: Agroforestry row. NA: date for which there were not enough observations to run the model. NCI: NCI effect; N: More infested shoots on the North side(Azimuth
effect); I: Inflorescence more infested (Shoot type effect). NS: Not Significant; *: <0.05; **: <0.01; ***: <0.001
Table 5: Evolution of the proportion of infested shoots by Aphis sp per tree.
Effects of NCI, azimuth and shoot type on this proportion (n=45 trees). For each factor, the estimate (with significance) is given as a difference between a treatment indicated after the name of the variable and the reference treatment indicated between parentheses using GLMMs. Analysis was made excluding not infested trees. Monitoring had to be stopped between May 27thand June 17th. In blue: all the date with a median less than 5% of
infested shoots are hardly interpretable.
In bold: significant effects. NS: Not Significant; *: <0.05; **: <0.01; ***: <0.001 NCI Azimut: South (North) Shoot type: Vegetative
(Inflorescence) 10/04/2019 18/04/2019 24/04/2019 0.486 (***) -0.244 (*) -0.263(*) 02/05/2019 0.473(***) -0.311 (*) -0.591 (***) 09/05/2019 0.306 (***) -0.529 (***) -1.06 (***) 16/05/2019 0.224 (**) -0.178 (NS) -0.976 (***) 23/05/2019 0.111 (NS) -0.241 (*) -1.06 (***) 20/06/2019 0.365 (**) -0.173 (*) -0.733 (***) 27/06/2019 Estimate (significance)
Not analyzed: less than 5 trees infested per treatment NA - Not analyzed: 84 observations only (model failure)
NA - Not analyzed: 84 observations only (model failure) Date
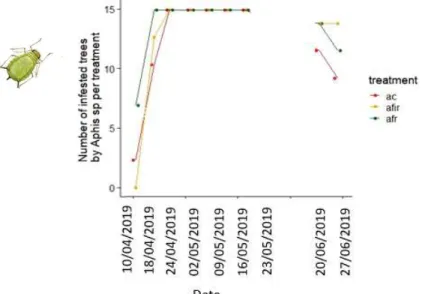
Figure 12: Evolution of the number of infested trees by Aphis sp according to the treatment. Monitoring had to be stopped between May 27th and June 17th. n = 15 trees per treatment
13
2.1.2) Incidence of Aphis sp
2.1.2.1) Evolution of the incidence at tree scale
The effect of NCI at tree scale for Aphis sp (probability of a given tree to be infested) could be analysed for the two first and two last dates only, since for the other dates all the trees of the sample were infested (ie having at least one shoot with Aphis sp) (figure 12). Evolution of the number of infested trees showed a similar pattern between treatments. For the dates analysed with GLM, the probability of being infested for a tree was not significantly affected by NCI (appendix IX).
2.1.2.2) Evolution of the number of infested shoots at tree scale
The proportion of infested shoots followed a similar trend between treatments, with variability within each treatment (figure 13). Only 5 dates were interpretable ie having a proportion of infested shoots above 5%: April 24th to May 23rd. There was a positive correlation with the NCI except on May 25th (figure 13 and table 5). Also, North side was significantly more infested for 4 dates between April 24th and May 23rd. Eventually, vegetative shoots were significantly less infested than floral ones, as for
Figure 16: Evolution of the number of D. plantaginea individuals per colony (left) and the relative growth rate of D. plantaginea colonies (right) (median and interquartile by treatment). Monitoring had to be stopped between May 27th and June 17th.
n = 84 colonies at each date. First alate were observed on May 6th (arrow and alate D.plantaginea drawing above the curves)
Figure 17: Evolution of the relative abundances of the different taxa of predators observed in D. plantaginea colonies.
Absolute number of individuals observed are provided for each date (n= 767 observations)
Figure 14: Cydia pomonella damages on fruit at the end of the first generation.
Number of fruits damaged per tree according to the total number of fruits in the tree. ac: Agricultural control; afir: Agroforestry inter-row; afr:
Agroforestry Row
Figure 15: Cydia pomonella damages on fruits at the end of the first generation.
Proportion of damaged fruits per tree according to the NCI (n=117 trees). In red: trees with less than 5 fruits. In black: trees with more than 5 fruits.
14
2.1.3) Incidence of the first generation of C. pomonella
Few trees were observed with fruit damaged from C. pomonella (30 trees with damages over 117). Several trees had less than 5 fruits (25 trees), especially in AFR, with high NCI (> 2,000 cm²/m) (figures 14 and 15): for these latter, calculation of damages proportions might be biased. 1,606 fruits were browsed. 419, 1052 and 135 fruits belonged to AC, AFIR and AFR treatments, respectively. This corresponded to 5.49%, 2.76% and 0.741 % damaged fruits in each treatment, respectively. For trees with a NCI between 0 and 2,000 cm²/m, there was no clear trend between NCI and the proportion of damaged fruits (figure 15).
The GLM confirmed an absence of effect of NCI on C. pomonella (estimate: -0.452; NS). 2.2) D. plantaginea colony ecosystem: population dynamics of D. plantaginea, abundances of predators and ants, and interactions between taxa
The evolution of D. plantaginea individuals within the colonies, as well as that of the relative growth rate of colonies are presented in figure 16. Representation with the treatments aims at rendering it more readable (compared to a representation with the NCI). The last date was not represented for the relative growth rate (no sense to calculate it). Evolutions for both parameters were slightly similar between treatments, with a great variability. There was first an increase in the number of individuals and then a decrease that followed with a delay the observation of first alate (May 6th). Relative growth rate of D. plantaginea followed the same dynamic with a decrease in all treatments since first alate observations, becoming negative the last dates.
In total, 1,953 arthropods were observed in aphid colonies over the whole monitoring, among which there were 1,463 ants and 490 active predators (ie eggs not considered). Syrphidae larvae were the most abundant taxa of predators in aphid colonies over all the period (figure 17). There were fewer individuals of other taxa of predators (figure 17). The last two weeks, there was an increase in abundance of other predators, especially with Coccinellidae larvae and the appearing of Cecidomyidae larvae (figure 17). This second fortnight of May, Cecidomyidae larvae became the second most abundant taxa (figure 17).
Table 6: Abundance of D. plantaginea, predators in D. plantaginea colonies on all the period.
Estimates of the effect of NCI and significance using GLMM. For D. plantaginea, proxy of abundance was the AUC, while for the other arthropods proxy was the sum across the season.
NS: Not Significant; *: <0.05; **: <0.01; ***: <0.001
Table 7: Evolution of the number of ants per colony of D. plantaginea
Estimate of the effect of the NCI and significance using GLMM. In blue: Date for which medians equal 0 are hardly interpretable. NS:
Not Significant; *: <0.05; **: <0.01; ***: <0.001 Date Estimate (significance) 15/04/2019 -0.610 (NS) 23/04/2019 0.169 (NS) 29/04/2019 0.0726 (NS) 06/05/2019 0.458* 14/05/2019 0.721*** 20/05/2019 0.775*** 27/05/2019 0.840*** Figure 18: Evolution of the number of ants per colony of
D. plantaginea (median and interquartile range by treatment). Monitoring had to be stopped between May 27th and June 17th. Results of significance using GLMMs date per date are provided.
*: <0.05; **: <0.01; ***: <0.001
Variable Estimate (significance) logAUC D. plantaginea 0.723 (**)
Sum of ants 0.409 (***)
Sum of total predators -0.0438 (NS)
Sum of hoverfly larvae 0.0956 (NS)
Sum of ladybirds -0.985 (*)
Sum of midge larvae -0.165 (NS)
Sum of earwig -0.470 (NS)
Sum of spider 0.165 (NS)
Figure 19: Correlation between D. plantaginea relative growth rate, NCI and arthropod abundances by taxon.
PCA plots date per date of the variables on the taxa abundance within the colonies. Variables are coloured according to their cos². In blue dotted arrows: illustrative quantitative variables. See table at the end of the figure for the layout of the name of the variables.
15
2.2.1) D. plantaginea, predators’ and ants’ abundance within the colonies
The abundance of D. plantaginea within the colonies approximated by logAUC was positively correlated with the NCI (table 6).
For ants and predators, the inclusion of D. plantaginea abundances in the model allowed to focus on the individual effect of the NCI: indeed, abundances of each taxon were correlated to these effectives (not represented). Ants were significantly more abundant in the colonies when NCI increased (table 6, appendix X). The sum of the total number of predators (eggs excluded) was not significantly correlated to the NCI (table 6, appendix X). Globally, NCI did not significantly correlated to the sum of the different taxa of predators, except Coccinellidae (adults and larvae) - which were negatively linked to NCI (table 6, appendix X).
2.2.2) Phenology of ants
Impact of AF context on the phenology of arthropods could only be done for ants (not enough individuals observed in the other taxa). Evolutions seemed to follow similar patterns between the two treatments (increase followed by a decrease), with variability (figure 18). Positive correlation with the NCI appeared in May, coinciding with the first observation of alate D. plantaginea (figure 18, table 7).
2.2.3) Interactions of predation and myrmecophily
One may wonder whether these arthropods led to an enhancement (ants) or an efficient regulation (predators) of D. plantaginea colonies in the FT-AFS studied.
To study this question, a first representation date per date by PCA is described. For these PCA, only the two first dimensions were represented, accounting for the maximum of variance explained (above 30% for the sum of the two axes) (appendix XI). The increase in abundance of predators’ taxa the last two dates allowed to include them as active variables for these dates.
On the PCA, relative growth rate was neither correlated with the first two dimensions (appendix XI) nor well represented on these dimensions (figure 19 and continuation), except on May 6th – where it negatively correlated with all the other variables on dimension 1 (particularly ants, Syrphidae larvae and D. plantaginea), with a correlation between relative growth rate and axis 1 having a p-value below 0.05 threshold (appendix XI). Furthermore, on May 27th, it was positively correlated with most of the other variables on axis 1, with a p-value below 0.01 threshold (correlation between axis 1 and relative growth rate (appendix XI)).
Globally, regardless the date, dimension 1 showed an arthropod abundance effect, ie an opposition of points with several arthropods to those with less arthropods, meaning there was not antagonisms between them on this dimension. Dimension 2 tended to oppose ants with predators, especially Syrphidae larvae, except on April 29th (figure 19 C, appendix XI). Also, association between ants and aphids, more especially D. plantaginea could be observed (figure 19, appendix XI).
Figure 19 (continuation): Correlation between D. plantaginea relative growth rate, NCI and arthropod abundances by taxon.
PCA plots date per date of the variables on the taxa abundance within the colonies. Variables are coloured according to their cos². In blue dotted arrows: illustrative quantitative variables. See table at the end of the figure for the layout of the name of the variables.