5226
|
www.ecolevol.org Ecology and Evolution. 2020;10:5226–5239.1 | INTRODUCTION
In North America, one of the most sudden collapses of mam-mal populations on record is that of hibernating bat populations, caused by white-nose syndrome (WNS, Frick, Pollock, et al., 2010).
After the initial discovery of a bat population contaminated by
Pseudogymnoascus destructans (Pd; Ascomycota) in the State of
New York (USA), over 5.5 million bats had died from WNS annu-ally (Froschauer & Coleman, 2012), with a regional mean of mor-tality rates of 73% (Frick, Pollock, et al., 2010). Pd is a non-native Received: 2 April 2019
|
Revised: 31 January 2020|
Accepted: 5 February 2020DOI: 10.1002/ece3.6194
O R I G I N A L R E S E A R C H
Long-term changes in bat activity in Quebec suggest climatic
responses and summer niche partitioning associated with
white-nose syndrome
Julie Faure-Lacroix
1| André Desrochers
1| Louis Imbeau
2| Anouk Simard
3This is an open access article under the terms of the Creative Commons Attribution License, which permits use, distribution and reproduction in any medium, provided the original work is properly cited.
© 2020 The Authors. Ecology and Evolution published by John Wiley & Sons Ltd.
1Centre d'étude de la forêt, Faculté de
foresterie, de géographie et de géomatique, Université Laval, Québec City, QC, Canada
2Centre d'étude de la forêt, UQAT,
Rouyn-Noranda, QC, Canada
3Ministère des Forêts de la Faune et
des Parc du Québec, Quebec Centre for Biodiversity Science, Québec City, QC, Canada
Correspondence
Julie Faure-Lacroix, Université Laval, Pavillon Adrien-Pouliot, bureau 1125-A, 1065 avenue de la Médecine, Québec City, QC G1V 0A6, Canada.
Email: julie.faure-lacroix.1@ulaval.ca Funding information
MFFP; WSP; Biodôme; FRQ-NT
Abstract
In North America, the greatest and most sudden threat to hibernating bats is white-nose syndrome (WNS), which has caused massive declines in populations since 2006. Other determinants of bat dynamics, such as the climate, and the effect of reduction in the number of individuals sharing foraging space and summer roosting habitat may have an effect on population dynamics. We analyzed transect acoustic bat surveys conducted with ultrasonic detectors in 16 regions in Quebec, Canada, between 2000 and 2015. We used piecewise regression to describe changes in activity over time for each species and a meta-analytic approach to measure its association with the North Atlantic Oscillation (NAO). As expected, mouse-eared bat (Myotis spp.) activ-ity sharply declined after the onset of WNS, down by 79% after 3 years. In contrast, big brown/silver-haired bat activity increased over the same period, possibly due to a release of competition. Hoary bats and red bats remained present, although their activity did not increase. Myotis activity was positively correlated with a one-year lag to the NAO index, associated with cold conditions in winter, but warm autumns. Big brown/silver-haired and hoary bats were also more active during NAO-positive years but without a lag. We conclude that combinations of threats may create rapid shifts in community compositions and that a more balanced research agenda that integrates a wider range of threats would help better understand and manage those changes.
K E Y W O R D S
psychrophilic fungus that preferentially develops at temperatures between 4°C and 20°C, which are commonly measured in bat hiber-nacula during winter (Blehert et al., 2009; Gargas, Trest, Christensen, Volk, & Blehert, 2009; Minnis & Lindner, 2013). The species most affected are the mouse-eared bats (Myotis spp.), including the little brown bat (M. lucifugus) and Northern long-eared bat (M.
septentrion-alis), as well as tricolored bats (Perimyotis subflavus). Big brown bats
(Eptesicus fuscus) share hibernacula with Myotis species and have also been diagnosed with WNS (Blehert et al., 2009). The latter is some-times depicted as resistant to Pd infection (Bernard, Foster, Willcox, Parise, & McCracken, 2015), but new evidence suggests tolerance rather than resistance to Pd (Dorville, 2019); in any case, their popu-lations have not suffered the same loss as other hibernating species. Migratory bats such as the eastern red bat (Lasiurus borealis), the silvered-haired bat (Lasionycteris noctivagans), and the hoary bat (Lasiurus cinereus) do not hibernate in caves, and thus, they are not di-rectly threatened by WNS (Bernard et al., 2015). However, they are vulnerable to other threats, most notably collisions with wind turbines (Arnett et al., 2008). The effect of wind turbines is considered to be large enough that it could cause hoary bat populations to decline by as much as 90% in the next 50 years, from an estimated initial population of 2.5 million (Frick et al., 2017). Bats are also vulnerable to pesticides, as well as to habitat loss and fragmentation, which are known to have caused steady population declines in migratory bats over the past few decades, most notably in red bats (Carter et al., 2003; Whitaker, Brack, & Cope, 2002; Winhold, Kurta, & Foster, 2008).
When some species decline, others that share the same re-sources might benefit from a competitive release (Larsen, 1986; Ruscoe et al., 2011). Insectivorous bats are known to compete for foraging resources (Carter, Menzel, Chapman, & Miller, 2004; Hickey, Acharya, & Pennington, 1996), as well as hibernating, re-productive, and roosting sites (Perkins, 1996; Thalken, Lacki, & Johnson, 2018). Thus, we expect that a competitive release has oc-curred in insectivorous bats following the onset of WNS (Jachowski et al., 2014), which would allow species like big brown bats to ex-ploit the portion of their diet that is shared with little brown bats, as found by Morningstar, Robinson, Shokralla, and Hajibabaei (2019) in Ontario. Additionally, O’Keefe, Pettit, Loeb, and Stiver (2019) found that the patterns in hibernacula mirrored the decline in Myotis, as well as the stability in big brown bat summer popu-lations. It could mean that big brown bats would benefit from a competitive release for roosting locations in the long term, as well as increased availability of foraging habitat, resulting in better sur-vival and reproduction.
Besides catastrophic events like the WNS, bats probably re-spond to subtle impacts of weather and climate, as exemplified by the association between Leisler's bat (Nyctalus leisleri) activity and weather in spring and winter (Schorcht, Bontadina, & Schaub, 2009). For all species, a warm autumn with more insects could have a positive impact on reproduction, hibernation, and first-year survival, as it is the season during which mating and prehiberna-tion fat accumulaprehiberna-tion occurs (Ewing, Studier, & O’Farrell, 1970; Kunz, Wrazen, & Burnett, 1998) and particularly for juveniles
(Kunz et al., 1998). For hibernating species, mild winters with lit-tle temperature fluctuations would reduce energy expenditures for bats which choose to roost near cave entrances rather than in deeper, more stable locations (Brack, 2007).
In the Province of Quebec (Canada), bats have been monitored annually since 2000 using recorded detections on motorized acous-tic transects, that is, prior to and following the onset of WNS (Jutras, Delorme, Mc Duff, & Vasseur, 2012). We provide a first in-depth anal-ysis of those surveys, examining to what extent WNS is temporally associated with bat populations, and how yearly changes in activity are driven by weather as modulated by climatic variables. We examine six predictions: (a) that Myotis species decline from the onset of WNS, consistent with estimates from the USA (Frick, Pollock, et al., 2010); (b) that such declines create a release from competition for foraging space thus leading to a relative increase in the activity of species unaf-fected by WNS; (c) that migratory bats decline with the creation of new wind energy facilities; (d) that stochastic fluctuations in bat activity are modulated by climatic variables; (e) that years with long and warm falls would benefit all bat species and result in an increased recorded activ-ity the following summer; and (f) that mild winters are associated with high hibernating bat activity in the following summer for species at risk of hibernating in unstable conditions in caves.
2 | MATERIALS AND METHODS
2.1 | CHIROPS network
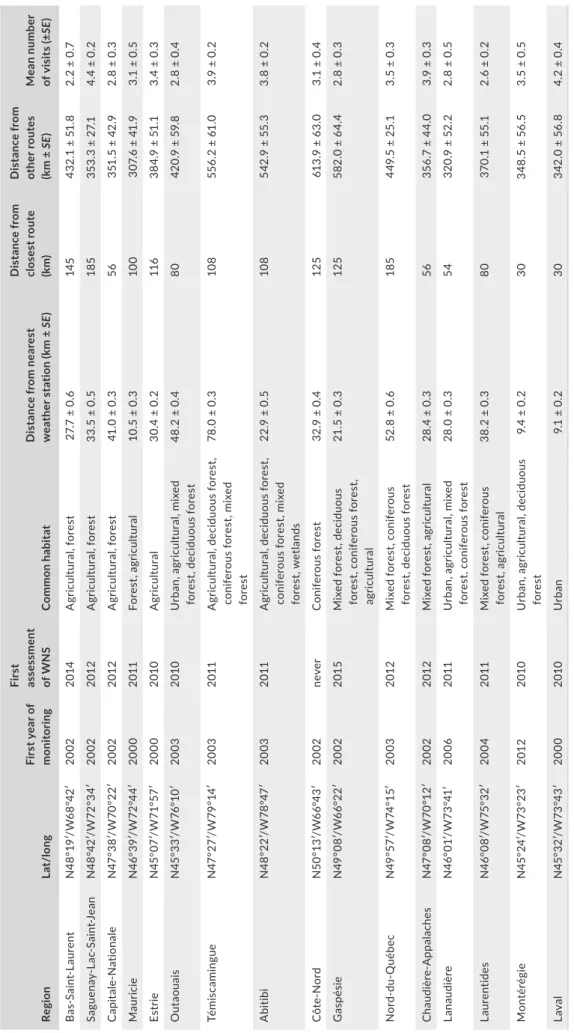
The Quebec network for acoustic bat monitoring, known as CHIROPS (Jutras et al., 2012), relies upon volunteers, technicians, and biologists from the provincial wildlife ministry (Ministère de la Faune, des Forêts et des Parcs; MFFP). At its inception in 2000, the network consisted of three listening transects using existing roads and included nine transects by 2009. In 2015, 16 regions in the prov-ince of Quebec participated in the survey (Figure 1, Table 1). The group located the transects in a forested area when possible (one exception being Laval, which is located in the city) representative of the type of forest typical of the area (see Table 1) and included preferred habitats for, such as wetlands or watersheds. They usually selected them following a year of assessment of multiple potential transects for the same area, after which they chose the candidate deemed most suitable for bat recording based on the preselection results. Selected transects had to be about 20 km in length, in an approximate triangular, U- or 8-shaped form, and located on quiet and unfrequented roads. Each spring, the participants were assigned a detection kit consisting of an ultrasonic detection device (see
Transect Monitoring) and a GPS receiver.
2.2 | Description of the regions
In the southwestern part of the province, transects were mostly located outside of a city, except for the one located in Laval. This
area is densely populated, and agricultural lands are often present along the transects that were surveyed. The Montérégie transect was added in 2012 to compensate for the habitat loss that occurred in the Laval transect over the years. In the northwest (47° N, 74° W), the landscape is more heavily forested, particularly in the Nord-du-Québec administrative region. Northeastern transects were located near small- to medium-sized towns with a large proportion of fields and some forest stands. In the southeast, transects were located mostly in rural areas.
Wind energy facilities existed in the province before 2000, but the industry has grown more rapidly, especially since 2011 (Figure 2). The proximity to a wind energy facility increased for most transects, but it mostly affected northeastern transects that were located in the regions of Gaspésie, Charlevoix, Chaudière-Appalaches, Côte-Nord, and Bas-Saint-Laurent.
2.3 | Transect monitoring
During monitoring nights, participants recorded echolocation calls using an ultrasonic detector (AnaBat; Titley Scientific) cou-pled to a tape recorder. From 2012, Anabats were replaced by Anabat II, which allowed automatic recording on a CF card rather
than manual recording on a cassette. Participants conducted CHIROPS surveys between 15 June and 31 July of each year (mean: 194th day of the year, SE = 0.15). Most years, the mean sampling date fell between 10 July and 14 July, except for 2001 (mean = 9 July), 2002 (4 July), and 2008 (16 July). We kept the sur-veys that were completed and excluded any survey that was con-ducted outside of the allowed date period. They were instructed to select a maximum of 4 nights with no precipitation, wind speeds below 5 km/h, and a temperature that was at or above the local seasonal mean. The mean sampling effort per transect is detailed in Table 1. In each region, a survey team traveled in a vehicle at 20 km/h. After completing the 20-km-long transect once, they drove back to the beginning of the transect to sample it a second time, for a total of 40 km. When a call was detected, participants remained stationary for 2 minutes while pointing the detector toward the bat. This maneuver originally helped to improve call quality from the Anabats, which were coupled to a cassette recorder and, therefore, identification accuracy. The transects typically began 15 min after sunset (mean starting time 9:20 p.m., SD = 28 min) and ended 2 hr 35 min later in average (SD = 42 min), which is well within the period of peak activity found in the province of Quebec for all species (Faure-Lacroix, Desrochers, Imbeau, & Simard, 2019).
F I G U R E 1 Location of motorized recording transects monitoring bat activity as of 2015 in Quebec, Canada. A description of each administrative region can be found in Table 1
T A B LE 1 D es cr ip tio n o f e ac h p ar tic ip at in g r eg io n o f t he C H IR O PS a co us tic b at s ur ve ys , Q ue be c, 2 00 0– 201 5 Re gi on La t/ lo ng Fi rs t y ea r o f mo ni to rin g Fir st as se ss m en t of W N S C om mo n ha bi ta t D is ta nc e f ro m n ea re st w ea th er s ta tio n ( km ± SE ) D is ta nc e f ro m cl os es t r ou te (k m) D is ta nc e f ro m ot he r r ou te s (k m ± SE ) Mea n nu mb er of v is it s ( ±SE ) B as -S ai nt -L au re nt N 48° 19 ′/ W 68° 42 ′ 20 02 20 14 A gr icult ur al , f or es t 27 .7 ± 0 .6 14 5 43 2. 1 ± 51 .8 2. 2 ± 0. 7 Sa gu en ay -L ac -S ai nt -J ea n N 48 °4 2′ /W 72 °34 ′ 20 02 201 2 A gr icult ur al , f or es t 33 .5 ± 0 .5 18 5 35 3. 3 ± 27 .1 4. 4 ± 0. 2 C api ta le-N at io na le N4 7° 38 ′/ W 70 °22 ′ 20 02 201 2 A gr icult ur al , f or es t 41 .0 ± 0 .3 56 35 1. 5 ± 42 .9 2. 8 ± 0. 3 Maur ic ie N 46 °3 9′/ W 72 °4 4′ 2000 20 11 Fo re st , agr ic ul tu ral 10 .5 ± 0 .3 10 0 30 7. 6 ± 41 .9 3. 1 ± 0. 5 Es tr ie N 45° 07 ′/ W 71 °5 7′ 2000 20 10 A gr icult ur al 30 .4 ± 0 .2 11 6 38 4. 9 ± 51 .1 3. 4 ± 0. 3 O ut ao ua is N 45 °3 3′ /W 76° 10 ′ 20 03 20 10 U rb an , a gr ic ul tu ra l, m ix ed fo re st , d ec id uou s f or es t 48 .2 ± 0 .4 80 42 0. 9 ± 59 .8 2. 8 ± 0. 4 Tém is ca m in gu e N 47 °2 7′/ W 79 °1 4′ 20 03 20 11 A gr icult ur al , d ec id uo us fo re st , co ni fe ro us f or es t, m ix ed fo re st 78 .0 ± 0 .3 10 8 55 6. 2 ± 61 .0 3. 9 ± 0. 2 A bi tibi N4 8° 22 ′/ W 78 °4 7′ 20 03 20 11 A gr icult ur al , d ec id uo us fo re st , co ni fe ro us f or es t, m ix ed fo re st , w et la nd s 22 .9 ± 0 .5 10 8 54 2. 9 ± 55 .3 3. 8 ± 0. 2 C ôt e-N ord N 50 °1 3′ /W 66 °4 3′ 20 02 ne ve r C oni fe ro us fo re st 32 .9 ± 0 .4 12 5 61 3. 9 ± 63. 0 3. 1 ± 0. 4 G as pé sie N4 9° 08 ′/ W 66 °22 ′ 20 02 201 5 M ix ed f or es t, d ec id uo us fo re st , c oni fe ro us fo re st , agr ic ul tu ral 21 .5 ± 0 .3 12 5 58 2. 0 ± 64 .4 2. 8 ± 0. 3 No rd -d u-Q uéb ec N 49 °5 7′/ W 74 °1 5′ 20 03 201 2 M ix ed f or es t, c on ife ro us fo re st , d ec id uou s f or es t 52 .8 ± 0 .6 18 5 44 9. 5 ± 25 .1 3. 5 ± 0. 3 C ha udi èr e-A pp ala ch es N 47 °0 8′ /W 70° 12 ′ 20 02 201 2 M ix ed f or es t, a gr ic ul tu ra l 28 .4 ± 0 .3 56 35 6. 7 ± 44 .0 3. 9 ± 0. 3 La na udi èr e N 46 °0 1′ /W 73 °4 1′ 20 06 20 11 U rb an , a gr ic ul tu ra l, m ix ed fo re st , c oni fe ro us fo re st 28 .0 ± 0 .3 54 32 0. 9 ± 52 .2 2. 8 ± 0. 5 La ur en tide s N 46° 08 ′/ W 75 °3 2′ 20 04 20 11 M ix ed f or es t, c on ife ro us fo re st , agr ic ul tu ral 38 .2 ± 0 .3 80 37 0.1 ± 5 5.1 2. 6 ± 0. 2 M onté ré gi e N 45 °2 4′ /W 73 °2 3′ 201 2 20 10 U rb an , a gr icult ur al , d ec id uo us fo re st 9. 4 ± 0. 2 30 34 8. 5 ± 56 .5 3. 5 ± 0. 5 La val N 45 °3 2′ /W 73 °4 3′ 2000 20 10 U rba n 9. 1 ± 0. 2 30 34 2. 0 ± 56 .8 4. 2 ± 0. 4 N ote : F irs t a ss es sm en ts o f W N S y ea rs a re b as ed o n r ep or ts o f a ff ec te d i nd iv id ua ls t ha t a re p ro vi de d b y t he p ro vi nc ia l M in is tè re d e l a F au ne , d es F or êt s e t d es P ar cs ( M FF P) , o r e st im at es b as ed o n n ea rb y re gi on s. A ll c en su s d at a a re f ro m 2 01 1 a nd a re p ro vi de d b y ( St at is tic s C an ad a, 2 01 2) .
2.4 | Climatic data
To assess the influence of climate on bat activity in the province, we used the North Atlantic Oscillation (NAO) index from 1999 to 2015 (National Center for Atmospheric Research Staff, 2018), a periodic index calculated from the difference of the sea-level surface pressure between the Subtropical High (an area between 35°N and 40°N in the North Atlantic) and the Subpolar Low (over Greenland, Climate Prediction Center, 2012). Although several climate indices can be used according to their geographical influ-ence (see a review by Stenseth et al., 2003), the use of NAO index is generally prevalent in eastern North America given that it has
measurable effects on terrestrial species, including amphibians, mammals, and birds (Forschhammer, Post, & Stenseth, 1998). The advantage of NAO is that such a global index is less sensitive to spatial scales than local indices and may relate more strongly to bi-ological effects (Hurrell, 1995). In Canada, positive values of NAO are normally associated with cooler ambient temperatures, north-ern winds, and dry conditions, whereas negative values are associ-ated with warm and wet conditions (Hurrell, Kushnir, Ottersen, & Visbeck, 2003). To confirm the influence of climatic variations on the local weather, we used data that were recorded at the closest weather stations (Environment Canada, 2016) from 1999 to 2015 (see Table 1).
F I G U R E 2 Proximity of each region to wind energy facilities. a) The curves are the sum of the inverse of the squared distance of all facilities to each transect centroid, b) cumulative number of windfarms in the province, and c) cumulative theoretical power (megawatts) of the windfarms
We calculated several versions of the NAO index: a mean of the 12 months preceding each summer (yearly NAO) and one for each season (autumn, winter, spring, summer). By doing this, we accounted for the specific movements of each group of bats. Even though their specific seasonal movements are largely unknown in the province, it is safe to say that hibernating species remain in Northeastern America over winter even when considering potential seasonal movements be-tween hibernacula and summer roosts ranging from tens to hundreds of kilometers (Neubaum, O’Shea, & Wilson, 2006; Norquay, Martinez-Nuñez, Dubois, Monson, & Willis, 2013), while migrating species leave during autumn and come back the following year (Cryan, 2003). Consequently, the latter group may only be significantly affected by northeastern conditions as modulated by NAO from the current sum-mer or the previous sumsum-mer. However, we included the possibility of a one-year lag to the response to climate conditions. In mid-June/early July, Myotis give birth to pups which fledge after ca. 6 weeks (Powers, Kandarian, & Kunz, 1991; Wimsatt, 2012), while big brown bats give birth in June and pups take flight 3 to 5 weeks later (Kurta, Kunz, & Nagy, 1990). Big brown pups are likely detected during the late-June/ late-July surveys that same year, while more of the activity from Myotis pups would be recorded the following year since they start fledging later than big brown bats. A lagged effect of weather on body con-dition has also been detected in other species, notably through their effect on reproduction (Simard, Huot, de Bellefeuille, & Côté, 2014).
2.5 | Detections and bat activity
We assessed bat activity by counting the number of detected passes for each species using motorized transects. The consulting firm WPS (formerly Envirotel 3,000) manually identified calls and considered a pass to be a minimum of 3 calls per 15-s file. They identified the calls based on typical shapes of the calls of bats found in the area and known to the consulting firm and rejected those they could not tify because of poor recording quality and we validated the iden-tifications using a DFA analysis (Adams, 2013). Calls of big brown and silver-haired bats are cryptic, and thus, they were combined in further analyses to minimize errors in identification (hereafter, big brown/silver-haired). Myotis species, which include little brown, northern long-eared, and eastern small-footed bats, were also con-sidered as a group to minimize errors. In our area, little brown bats typically account for most detections, followed by northern long-eared bats; eastern small-footed bats are rarely detected (MFFP, un-published). The calls of eastern red bats, hoary bats, and tricolored bats are distinctive enough to be considered separately.
2.6 | Measuring temporal dynamics within regions
To assess sudden or gradual changes in activity for each species, we conducted piecewise regressions using the segmented package (Muggeo, 2015) in R (R Core Team, 2016). Because the transects were resampled twice in the same night and visited multiple timesa year, we summed the number of calls for each transect every year, as was done by Crewe, Taylor, and Lepage (2016). Because we used count data and that the sampling effort was of constant distance but various time lengths, we used a generalized linear model function (glm) with a Poisson family and added the log of the sampling ef-fort in minutes as an offset. In piecewise regressions, the independ-ent variable is segmindepend-ented into a predetermined number of intervals and a separate regression is fitted for each interval, which allows the estimation of “breakpoints,” that is, regressor values at which the relationship changes. For hibernating species, the breakpoint was in-terpreted as corresponding to the period of contamination by WNS and two intervals that represented the periods pre-WNS and ongo-ing WNS. We had access to a list of years of first assessment of WNS in each region, which corresponded to the year when a sick bat was first reported in that area. In some case when no sick bat has been found in a region, the first assessment date has been inferred from the neighboring regions. According to the year of the first assessment of WNS for each region (Table 1), we split regions into two groups: an “early-onset” group for which the first detection of WNS by regional authorities occurred before 2012; and a “late-onset” group for which the first detection occurred after 2012 and the one region for which the first signs of WNS were documented in 2015. We assumed two intervals: one covering the years before the onset of WNS and one following the onset of WNS. In the piecewise regressions, we used 2011 as an arbitrary starting point to look for breakpoints (psi value) if the region belonged to the early-onset group and 2014 if it be-longed to the late-onset group. For migrating species, which should not be affected negatively by WNS, the value of 2011 corresponds to the year before the beginning of the construction of several wind energy facilities (Figure 2). We split the transects into two groups: the northeastern transects (n = 5, see methods for the list) closest to the major facilities and the rest of the province (n = 11).
2.7 | Estimating climatic effects
We tested variation in the NAO index on bat activity for each species using meta-analysis, with each region treated as a separate “study.” A meta-analysis aggregates data from multiple studies or in this case, multiple sites from a single study. In all sites, each bat species was con-sidered a separate population that could respond differently to several variables, and as it is common in meta-analyses, we did not work with one single a priori explanatory variable. We detrended variables using linear or LOESS regressions when required (Fox & Weisberg, 2018). We computed Pearson product-moment correlations (r) for each spe-cies (Borenstein, Hedges, Higgins, & Rothstein, 2009). Using the
meta-phor package in R (Viechtbauer, 2015), we standardized the Pearson
coefficients as z-scores using Fisher's Z transform. We used rz to
calcu-late the effect size (E++), weighted with the reciprocal of the sampling
variance for each region. It considered a number of degrees of freedom of 16 or less according to the number of regions included in the analy-sis. We considered effect sizes as significant if their confidence interval did not include zero. To assess whether the strength of the relationship
was modulated by the location of the region, we computed separate group effect sizes (E+) for each quadrant in the province (North, East,
South, and West), which took into account the number of sites in each group. The number of degrees of freedom was equivalent to the num-ber of regions included in the analysis. We calculated 95% confidence intervals (CI) by bootstrapping with 999 resamples of the data for each group. We computed Cochran's Q heterogeneity test (Cochran, 1954) to evaluate differences in effect sizes within groups (QE) and between
groups (QM). We separated the climatic analysis and the temporal anal-ysis related to WNS and wind energy facilities because we chose to analyze the climatic data as a meta-analysis, for which the use of beta coefficients is often considered dubious, even though it may be robust enough with a much larger sample size than it is the case in our study (Peterson & Brown, 2005).
3 | RESULTS
3.1 | Relationship between white-nose syndrome
and bat activity
Myotis was the most frequently encountered group of species
prior to the first detection of WNS, but we recorded more big
brown/silver-haired bats activity in the years following the es-timated onset of WNS. Before WNS, we recorded a mean (±SE) of 34.18 ± 3.11 passes/year for Myotis; during the years after the onset of WNS, this count dropped by 79%, that is, down to 7.1 ± 1.55 passes/year. Mean nightly detection for big brown/ silver-haired bats more than doubled from 20.54 ± 2.81 passes/ year before WNS to 43.22 ± 5.61 passes/year in the years fol-lowing the breakpoint. Comparing raw means of activity before and following the breakpoint, red bat activity had remained bio-logically unchanged from 1.51 ± 0.23 passes/year to 2.35 ± 0.68 passes/year. Hoary bats also remained biologically stable when comparing global mean activity before and after the breakpoint. However, until the beginning of the progress of wind energy facili-ties in 2012, the mean yearly detection was 30.05 ± 3.23 passes/ transect while after that period, the mean number of detections decreased to 23.62 ± 4.61 passes/transect. The mean yearly pass count of tricolored bats before the breakpoint changed from 0.07 ± 0.03 to 2.1 ± 0.3 passes/night following breakpoint. This generally low activity did not allow us to draw strong conclusions regarding the effects of WNS on this group.
Piecewise regression showed that, globally, the levels of bat activity stopped increasing in 2009 (SE = 0.74, p = .03, Table 2).
Myotis activity increased throughout the province as a function
TA B L E 2 Summary of the breakpoints and slopes found in piecewise regression for each species in the province of Quebec, Canada
Group Species
Breakpoint
Slope before breakpoint [CI] Slope after breakpoint [CI]
Year SE
Early-onset Big brown/silver-haired 2010*** 0.29 0.017 [0.003, 0.030] 0.227 [0.200, 0.254]
Hoary 2012*** 0.26 0.066 [0.055, 0.077] −0.125 [−0.169, −0.081]
Red 2012*** 0.27 0.284 [0.236, 0.333] −0.686 [−1.014, −0.358]
Myotis 2009*** 0.13 0.074 [0.060, 0.088] −0.407 [−0.449, −0.364]
Tricolored 2013*** 0.41 0.894 [0.578, 1.210] −0.006 [−0.227, 0.215]
Total 2002** 0.86 −0.087 [−0.241, 0.067] 0.038 [0.034, 0.042]
Late-onset Big brown/silver-haired 2005*** 0.41 1.042 [0.452, 1.633] −0.231 [−0.312, −0.15]
Hoary N/A — — —
Red N/A — — —
Myotis N/A — — —
Tricolored N/A — — —
Total 2012*** 0.49 0.002 [−0.017, 0.021] −0.430 [−0.672, −0.188]
Overall Big brown/silver-haired 2003*** 0.18 −0.294 [−0.359, −0.229] 0.133 [0.124, 0.142]
Hoary 2012*** 0.29 0.056 [0.046, 0.066] −0.116 [−0.16, −0.072]
Red 2012*** 0.30 0.315 [0.268, 0.362] −0.666 [−0.988, −0.343]
Myotis 2010*** 0.13 0.053 [0.040, 0.066] −0.364 [−0.400, −0.328]
Tricolored 2013*** 0.42 0.852 [0.546, 1.158] 0.011 [−0.207, 0.230]
Total 2009* 0.74 0.048 [0.038, 0.058] 0.008 [−0.003, 0.018]
Note: The data span from 2000 to 2015 and the response variable considered is the sum of the counts per year per transect. The early-onset group
comprises all regions for which WNS was detected before 2012, the late-onset group comprises regions for which WNS was detected after 2012, and the overall group is made of all regions. The table shows N/A in cases where the analysis found no significant breakpoint.
***p < .001. **p < .01. *p < .05.
of the year up until 2010 (SE = 0.13, p < .001). However, in 2009 (SE = 0.13, p < .001), the regions where WNS was detected the earli-est started experiencing a drop in Myotis activity (β = −0.40 ± 0.04,
p < .001). The effect of WNS measured in early-onset regions
was sufficiently large to reflect the overall activity count for that
group, even though the late-onset regions had yet to show any significant decline of activity. In general, the inclusion or exclusion of the Laval site did not have a major effect on the result, mostly because of the low number of detections.
Piecewise regressions for big brown/silver-haired bats showed marked changes in the separate regression estimates, like those of Myotis. In the early-onset regions, the activity of the former species increased significantly (β = 0.22 ± 0.02, p = .01) from 2010 onwards (SE = 0.29, p < .001) instead of decreasing, one year fol-lowing the beginning of declines in Myotis activity. But the break-points identified for the late-onset and the province as a whole did not match any known threat that would have occurred around these years.
The breakpoint for red bats in both early-onset region and in the province as a whole was in 2012 (SE = 0.27, p < .001) and their activity subsequently went back down (early: β = −0.69 ± 0.32, p = .01, over-all: β = −0.67 ± 0.32, p = .01). When considering the impact of wind energy facilities, the breakpoint for red bats was in 2013 in both the northeastern regions close to wind energy facilities and those further away (Table 3); however, large intervals around the slope estimate after the breakpoint in the northeastern group make it inconclusive. Inspection of the residuals showed some linearity issues that were more marked after the breakpoint, mainly due to the low number of detections before 2004 and after 2013. In the case of hoary bats, their breakpoint was in 2012 in early-onset regions (SE = 0.26, p < .001), as well as globally (SE = 0.29, p < .001) but examining the regressions from a windfarm perspective did not shed light on a relationship be-tween breakpoint years and a known threat. The overall breakpoint for tricolored bats was in 2013 (SE = 0.41, p < .001), although there was very little activity in this species, either before or after 2013, and investigation of the residuals suggests linearity issues.
3.2 | Association between NAO and local weather
Positive NAO values are generally associated with cold and dry con-ditions, as is generally the case in our study (Figure 3). Even if NAO-positive years resulted in colder temperatures during winter, spring, and summer, autumn temperatures during our study were, in fact, warmer TA B L E 3 Summary of the breakpoints and slopes found in piecewise regression for migratory species in the province of Quebec, CanadaGroup Species
Breakpoint
Slope before breakpoint [CI]
Slope after breakpoint [CI]
Year SE
Northeastern Hoary 2005* 0.84 −0.09 [−0.20, 0.02] 0.08 [0.07, 0.10]
Red 2013*** 3.33 0.34 [0.27, 0.42] −32.51 [−2119, 2054]
Other transects Hoary 2009*** 0.36 0.09 [0.07, 0.12] −0.09 [−0.11, −0.06]
Red 2013*** 0.22 0.30 [0.24, 0.36] −0.73 [−1.07, −0.40]
Note: The data span from 2000 to 2015 and the response variable considered is the sum of the counts per year per transect. The northeastern group
comprises regions closest to wind energy facilities, and it is compared to the other regions. ***p < .001.
**p < .01. *p < .05.
F I G U R E 3 Based upon climate values that were recorded at weather stations closest to each of the 16 bat transects in Quebec (Canada), NAO-positive summers were colder and drier than NAO-negative summers. Indeed, as summer NAO increased, we observed a) an increase in the number of cold days below 10oC and b) a decrease in the number of rainy days that were recorded. Only the North–South difference was significant; hence, the lack of representation of East and West
Location (N/S) North South Summer NAO 0.0 0.3 52 56 60 64 (a) –0.6 –0.3 –0.6 –0.3 0.0 0.3 10 20 30 40 50 (b)
Number of rainy days
Number of cold days (below 10°
in positive than in NAO-negative years (Figure 4). NAO-positive sum-mers tend to have more days during which the minimum daily tempera-ture falls below 10°C, a threshold that is considered limiting to foraging (Anthony, Stack, & Kunz, 1981; Ciechanowski, Zając, Biłas, & Dunajski, 2007; Frick, Reynolds, & Kunz, 2010). The temperature in southern lo-cations fell less frequently below 10°C, and they had fewer rainy days than northern locations. In the west, snow melts about 20 days earlier during NAO-negative years than during NAO-positive years.
3.3 | Meta-analyses of climatic variables
Myotis was positively correlated to the previous year's NAO index
(E = 0.11, CI = 0.03–0.19, Figure 5), meaning high activity when the previous year was cold and dry, regardless of the current year's conditions. It was more specifically correlated to the NAO index during the winter that year (E = 0.09, CI = 0.01–0.16). The effect size of the yearly NAO index was small, but significant for big brown/ silver-haired (E = 0.10, CI = 0.01–0.18), and more specifically to the fall (E = 0.10, CI = 0.03–0.18) and winter (E = 0.10, CI = 0.01–0.19) and similar to hoary bats (yearly: E = 0.14, CI = 0.06–0.22, win-ter: E = 0.12, CI = 0.04–0.20), showing that those species were more active during NAO-positive years, that is, having cold and dry conditions. Red bat activity was negatively correlated with the previous summer's NAO index (E = −0.18, CI = −0.26, −0.09), meaning low activity in the year following a cold and dry sum-mer. They were also positively correlated to spring temperatures (E = 0.10, CI = 0.01, 0.20). The low count of tricolored bat calls made it difficult to detect any correlation between activity and climate conditions.
3.4 | Effect of geographical location on the
relationship between NAO index and activity
The activity levels of big brown/silver-haired and hoary bats were positively correlated to the current year's NAO index, and that ef-fect was significantly different for the eastern and western regions of the province (P(QM) < 0.0001). The effect of the NAO index on
activity in western regions was significant and positive (E+ = 0.21,
CI = 0.13, 0.29), whereas it was not significantly different from zero in eastern regions (Figure 6). The effect of the NAO index on red bat activity also varied according to their geographical locations (P(QM) < 0.001). The effect of the previous summer's NAO index was only significantly different from zero in northern regions (E+ = −0.26,
CI = −0.36, −0.15).
4 | DISCUSSION
Our results support 3 of our 6 predictions and partly support 2 of them. We observed a decline in the activity of Myotis species after initial WNS detection in the regions. We only observed an increase in activity for big brown/silver-haired bat activity after the initial de-tection of WNS, with a matching breakpoint in 2010 in early-onset regions. Globally, we found that the constant increase in bat activity plateaued around 2009, which coincides with the breakpoints ob-served in Myotis and big brown/silver-haired bats. We saw stochas-tic fluctuations modulated by climastochas-tic variables in all species except tricolored bats and warm falls appeared beneficial to most of them. However, contrary to our expectations, cold and dry winters are beneficial to hibernating species.
F I G U R E 4 Based on climate values that were recorded at weather stations closest to each of the 16 bat transects in Quebec (Canada), NAO-positive years translated into a) warmer nights in the autumn, b) colder winters, and c) later snowmelt in the West. The difference was only significant between East and West; hence, the lack of representation of North and South
Mean nightly temperature in the fall (°C)
Yearly NAO Yearly NAO Yearly NAO
–1.0 –0.5 0.0 10 11 12 13 14 –9 –6 –3 80 90 100 110 120 0.5 –1.0 –0.5 0.0 0.5 –1.0 –0.5 0.0 0.5 East West Location (E/W)
Mean winter temperature (°C)
Date of complete snow melt (julian)
4.1 | Effect of WNS and windfarms on bat activity
Our finding of a 79% drop in Myotis activity following the first assess-ment of WNS shows a decline just below those detected in popula-tions the province, which suggested a 95% decline from hibernacula counts, and 94% from surveys in 10 maternity colonies (Équipe de Rétablissement des Chauves-souris du Québec, 2019). They are con-sistent with reported capture rates (Francl, Ford, Sparks, & Brack, 2012; Ingersoll, Sewall, & Amelon, 2016; Moosman, Veilleux, Pelton, & Thomas, 2013) and other results from acoustic surveys, which re-ported a 75% Myotis decline following WNS introduction in one case (Frick, Pollock, et al., 2010) and a 72% decline in another (Brooks, 2011). However, cases where the decline occurred before the official detection suggest that WNS affected the region before it was de-tected by the local teams. Similarly to our assessments of big brown/ silver-haired bat activity, Morningstar et al. (2019) found a significant increase in big brown bat activity, coinciding with a decline of littlebrown bat activity following the onset of WNS in Ontario. Hauer, Powers, Mcnaughton, Paul, and Sewall (2019) also found a decline in
Myotis captures and a 276% increase in big brown bat captures
dur-ing WNS. However, Francl et al. (2012) found that capture rates of big brown bats in mist nets increased by only 17% following the first assessment of WNS, which was not significant compared to captures before WNS. Stable capture rates of big brown bats during WNS were also reported by Moosman et al. (2013) and Pettit and O’Keefe (2017). In our case, their activity more than doubled after the onset of WNS. Not only might they benefit from exploiting prey resources previously shared with Myotis as found by Morningstar et al. (2019), they may also have a higher availability of roosting (Thalken et al., 2018) and hibernating locations. Frank et al. (2014) found a 43% in-crease in the number of big brown bats hibernating in two WNS-affected locations, which is in line with the high numbers of big brown bats found in the southern part of the province (Batwach.ca, unpublished data).
F I G U R E 5 Meta-analysis of climate and weather variables for each bat species that was detected during the 15-year acoustic survey in Quebec, Canada. Effect sizes are computed for each for variable for which sufficient data were available in the 16 regions that were sampled
Migratory species like red and hoary bats are not affected by WNS (Bernard et al., 2015), which showed in our results. However, they are known to be negatively affected by wind energy production (Arnett et al., 2008). We found a significant breakpoint in 2012 when wind energy facilities started being built mostly in the northeastern part of the province. The differences in activity after 2012 between the north-eastern and the rest of the transects were not significant for red bats, but the activity of hoary bats significantly decreased. However, when the breakpoint was 2013, the second part of the piecewise regression was made of only 3 years, which is a bare minimum to estimate a trend. Preliminary analysis of additional data from 2016 to 2018 indicates that a slow decrease might be a trend in hoary bats, while red bats had fluc-tuated back to 2012 activity in 2018 (unpublished data).
4.2 | Association between NAO index and
bat activity
Similarly to other studies (Brack, Stihler, Reynolds, Butchkoski, & Hobson, 2002; Thogmartin & McKann, 2014), we found climatic in-dices to be relevant predictors of bat activity, in the present case
NAO index. Yet, the relationship between climatic conditions and bat activity did not conform to our prediction, as for both Myotis and big brown/silver-haired bats we found an increase in bat activity during NAO-positive years, that is, cold and dry conditions. The major dif-ference being that the NAO effect was lagged for the Myotis but not for the big brown bat. Because we analyzed WNS separately from climate correlates, it is probable that the drastic changes in activity had an influence on the results of the analysis. However, meta-analyses are generally robust to individual variations (Viechtbauer, 2015) and the fact that both Myotis and big brown/silver-haired bats follow similar trends climate-wise and opposite trends WNS-wise indicates that the effect of separating the two analyses is minimal. In addition, the piecewise regression is designed to detect stable trends across years and would only be affected by NAO values in-creasing or dein-creasing in a linear fashion from or to the breakpoints, which would then be the same for all species.
In our study area, NOA-positive years were associated with warm autumns, especially in the West, followed by cold winters and delayed snowmelt in the West. We, therefore, suggest that the possible posi-tive effect of NOA-posiposi-tive years is likely attributed to advantageous autumn weather. Studies on Myotis suggested that fat deposition in September is particularly important, making up to 30% of prehiber-nating fat deposition (Ewing et al., 1970; Kunz et al., 1998). Moreover, juvenile bats tend to have less fat than adults in early autumn and to extend fat accumulation until mid-October (Kunz et al., 1998). Kunz et al. (1998) also suggested that the capacity to store fat could be particularly limiting in northern latitudes, especially for young fe-male reproduction and survival. In Québec province, September and October temperature can be quite variable, possibly allowing differ-ential capacity to accumulate prehibernating fat.
Despite the warm autumns under NAO-positive years, the positive relationship between the NAO index and bat activity is still surprising as it also involves colder winters and delayed springs. If bats hibernate in poorly tempered locations inside the hibernacula (Brack, 2007; Perry, 2013a), abrupt drops in tempera-ture may trigger arousal (Davis & Reite, 1967) that can account for up to 75% of energy requirements during hibernation (Thomas & Geiser, 1997), causing depletion of fat reserves, and compromis-ing survival and the success of ovulation and fertilization (Kunz et al., 1998). It is also possible that individuals who survived cold and dry winters benefited from those conditions lasting into spring, allowing them to delay their arousal and shorten the amount of time exposed to unstable spring conditions (Frick, Reynolds, et al., 2010; Norquay & Willis, 2014) a strategy used by males (Norquay & Willis, 2014).
Red bats are the only species for which activity was influenced by lagged values of the summer NAO index rather than by the yearly NAO index; their activity was low in northern regions when the previous summer was cold (NAO-positive). As is the case in other migratory species (Cryan, 2003), lactating female red bats avoid torpor under low temperatures. Yet, red bats are known for a low degree of flexibility in their thermoregulatory response and high reproductive rate (Dunbar & Tomasi, 2006). During short F I G U R E 6 Group effect sizes of NAO index on big
brown/silver-haired and hoary bats located in eastern and western regions of Quebec, Canada. The groups are based upon geographical locations of the participating regions and the data cover the 15-year span of the survey
Geographical part of the province Group effect sizes [95% CI]
Western
Eastern
(a) Big brown/Silver-haired, Hoary
0.21 [0.13, 0.29] 0.01 [–0.10, 0.13] –0.50 –0.25 0 0.25 0.50 Northern (b) Red –0.26 [–0.36, –0.15] –0.02 [–0.16, 0.12]
Geographical part of the province Group effect sizes [95% CI]
Southern
periods of hibernation during the winter, they are known to bene-fit from the presence of leafy litter when the ambient temperature ranges below 10°C (Mormann & Robbins, 2007) to minimize en-ergy expenditure, which allows them to hibernate in a wider range of temperatures (Perry, 2013b). If temperatures frequently drop below 10°C in the spring and early summer, they might suffer from higher energy expenditures if they cannot benefit from a protec-tive leafy cover, resulting in poor reproduction rates.
5 | CONCLUSIONS
In Quebec, the sharp decline in Myotis activity is consistent with the well-documented impact of WNS. However, as Ingersoll et al. (2016) have noted, several factors might be at play in stochastic changes and regional population declines. The current state of conservation and biodiversity research has been increasingly centered around climate change, and as we have found, there is indeed a relation-ship between bats and climate. This being said, we want to echo a call from Titeux, Henle, Mihoub, and Brotons (2016) for a more balanced research agenda that puts in perspective and integrates a wider range of threats. Eventual northward shifts in wintering ranges related to climate change have been predicted in little brown bats (Humphries, Thomas, & Speakman, 2002) and Indiana bats (Thogmartin, King, Szymanski, & Pruitt, 2012), but these shifts may never occur if the species become locally extirpated.
We show an example where competition release following the collapsing of bats species vulnerable to an introduced fungus may create rapid shifts in community compositions if combined with the effect of human-made threats like windfarms to migrating bat spe-cies. Thus, they should be considered together with a wider range of potential threats in long-term monitoring, in conjunction with the impact of climate change on conservation efforts.
ACKNOWLEDGMENTS
The CHIROPS network was initiated by Jacques Jutras of the Ministère des Forêts de la Faune et des Parcs du Québec (MFFP), Michel Delorme of Biodôme Montréal, and Julie McDuff from WSP. We would like to express our deep gratitude for their in-volvement. We thank the many volunteers and MFFP biologists and technicians, who collected road-transect acoustic data over 15 years in 16 regions. Special thanks are due to Valérie Simard and Nathalie Desrosiers (MFFP) and Claire Vasseur (Biodôme), who coordinated the CHIROPS network in recent years. We are also grateful to Julie McDuff for the initial extraction and identi-fication of bat calls. Finally, we thank William F.J. Parsons for the English revision of this manuscript. Data collection was funded by MFFP, WSP, and Biodôme. J. Faure-Lacroix received a grant from FRQ-NT.
AUTHORS’ CONTRIBUTION
Julie Faure-Lacroix took a lead role in the conceptualiza-tion of the manuscript; took a lead role in data curaconceptualiza-tion, formal
analysis, investigation, writing—original draft, and reviewing and editing the manuscript; and equally contributed to methodology, and project administration. André Desrochers equally contributed to conceptualization of the manuscript, funding acquisition, project administration, writing—original draft, and reviewing and editing the manuscript; took a supporting role in data curation, formal analysis, investigation, and methodology; and took a lead role in supervision of the manuscript. Louis Imbeau equally contributed to conceptu-alization of the manuscript, data curation, project administration, supervision, writing—original draft, and reviewing and editing of the manuscript; took a supporting role in formal analysis, investigation, and methodology; and took a lead role in funding acquisition. Anouk Simard equally contributed in conceptualization of the manuscript, funding acquisition, investigation, methodology, project administra-tion, supervision, writing—original draft, and reviewing and editing of the manuscript, and took a supporting role in data curation and formal analysis.
DATA AVAIL ABILIT Y STATEMENT
Upon acceptance of this manuscript, all data will be uploaded to FigShare and made available to the public. https://figsh are.com/ autho rs/Julie_Faure -Lacro ix/6542219
ORCID
Julie Faure-Lacroix https://orcid.org/0000-0002-8375-5585 André Desrochers https://orcid.org/0000-0002-5676-964X Louis Imbeau https://orcid.org/0000-0003-4111-8059 Anouk Simard https://orcid.org/0000-0002-5139-9336
REFERENCES
Adams, A. M. (2013). Assessing and analyzing bat Activity with
acous-tic monitoring: Challenges and interpretations. PhD Thesis, the
University of Western Ontario. Retrieved from http://ir.lib.uwo.ca/ etd/1333/
Anthony, E., Stack, M., & Kunz, T. (1981). Night roosting and the noc-turnal time budget of the little brown bat, Myotis lucifugus: Effects of reproductive status, prey density, and environmental conditions.
Oecologia, 51(2), 151–156. https://doi.org/10.1007/BF005 40593
Arnett, E. B., Brown, W. K., Erickson, W. P., Fiedler, J. K., Hamilton, B. L., Henry, T. H., … Tankersley, R. D. (2008). Patterns of bat fatali-ties at wind energy facilifatali-ties in North America. Journal of Wildlife
Management, 72(1), 61–78. https://doi.org/10.2193/2007-221
Bernard, R. F., Foster, J. T., Willcox, E. V., Parise, K. L., & McCracken, G. F. (2015). Molecular detection of the causative agent of white-nose syn-drome on Rafinesque’s big-eared bats (Corynorhinus rafinesquii ) and two species of migratory bats in the southeastern USA. Journal of Wildlife
Diseases, 51(2), 519–522. https://doi.org/10.7589/2014-08-202
Blehert, D. S., Hicks, A. C., Behr, M., Meteyer, C. U., Berlowski-Zier, B. M., Buckles, E. L., … Stone, W. B. (2009). Bat white-nose syndrome: An emerging fungal pathogen? Science, 323(5911), 227–227. https://doi. org/10.1126/scien ce.1163874
Borenstein, M., Hedges, L. V., Higgins, J. P. T., & Rothstein, H. R. (Eds.). (2009). Effect sizes based on correlations. In Introduction to
me-ta-analysis (pp. 41–43). Chichester, UK: John Wiley & Sons, Ltd.
https://doi.org/10.1002/97804 70743 386.ch6
Brack, V. (2007). Temperatures and locations used by hibernating bats, including Myotis sodalis (Indiana Bat), in a limestone mine: Implications for conservation and management. Journal of Environmental
Management, 40(5), 739–746. https://doi.org/10.1007/s0026
7-006-0274-y
Brack, V., Stihler, C. W., Reynolds, R. J., Butchkoski, C. M., & Hobson, C. S. (2002). Effect of climate and elevation on distribution and abundance in the mideastern United States. In A. Kurta & J. Kennedy (Eds.), The
Indiana Bat: Biology and Management of an Endangered Species (pp.
21–28). Austin, TX: Bat Conservation International.
Brooks, R. T. (2011). Declines in summer bat activity in central New England 4 years following the initial detection of white-nose syn-drome. Biodiversity and Conservation, 20(11), 2537–2541. https://doi. org/10.1007/s1053 1-011-9996-0
Carter, T. C., Menzel, M. A., Chapman, B. R., & Miller, K. V. (2004). Partitioning of food resources by syntopic eastern red (Lasiurus
borealis), Seminole (L. seminolus) and evening (Nycticeius humeralis)
bats. The American Midland Naturalist, 151(1), 186–191. https://doi. org/10.1674/0003-0031(2004)151[0186:POFRB S]2.0.CO;2 Carter, T. C., Menzel, M. A., Owen, S. F., Edwards, J. W., Menzel,
J. M., & Ford, W. M. (2003). Food habits of seven species of bats in the Allegheny Plateau and Ridge and Valley of West Virginia. Northeastern Naturalist, 10(1), 83–88. https://doi. org/10.1656/1092-6194(2003)010[0083:FHOSS O]2.0.CO;2 Ciechanowski, M., Zając, T., Biłas, A., & Dunajski, R. (2007).
Spatiotemporal variation in activity of bat species differing in hunt-ing tactics: Effects of weather, moonlight, food abundance, and structural clutter. Canadian Journal of Zoology, 85(12), 1249–1263. https://doi.org/10.1139/Z07-090
Climate Prediction Center (2012). North Atlantic Oscillation (NAO). Retrieved September 2, 2019, from https://www.cpc.ncep.noaa.gov/ data/teled oc/nao.shtml
Cochran, W. G. (1954). The combination of estimates from different ex-periments. Biometrics, 10, 101–109.
Crewe, T. L., Taylor, P. D., & Lepage, D. (2016). Temporal aggregation of migration counts can improve accuracy and precision of trends. Avian
Conservation and Ecology, 11(2), art8.
https://doi.org/10.5751/ACE-00907 -110208
Cryan, P. M. (2003). Seasonal distribution of migratory tree bats (Lasiurus and Lasionycteris) in North America. Journal of Mammalogy, 84(2), 579–593.
Davis, W. H., & Reite, O. B. (1967). Responses of bats from temperate regions to changes in ambient temperature. The Biological Bulletin,
132(3), 320–328. https://doi.org/10.2307/1539637
Dorville, N. (2019). Maybe She’s born with it: Big brown bats show phys-iological resistance to White-Nose syndrome. Presented at the 48th
International Bat Research Conference, Phuket, Thailand.
Dunbar, M. B., & Tomasi, T. E. (2006). Arousal patterns, metabolic rate and an energy budget of Eastern red bats (Lasiurus borealis) in winter. Journal of Mammalogy, 87(6), 1096–1102. https://doi. org/10.1644/05-MAMM-A-254R3.1
Équipe de Rétablissement des Chauves-souris du Québec (2019). Plan de
rétablissement de trois espèces de chauves-souris résidentes du Québec : la petite chauvesouris brune (Myotis lucifugus), la chauve-souris nordique (Myotis septentrionalis) et la pipistrelle de l’Est (Perimyotis subflavus)— 2019–2029. ministère des Forêts, de la Faune et des Parcs, Direction
générale de la gestion de la faune et des habitats. Québec, Canada. 102 p.
Ewing, W. G., Studier, E. H., & O’Farrell, M. J. (1970). Autumn fat depo-sition and gross body compodepo-sition in three species of Myotis.
Comparative Biochemistry and Physiology, 36(1), 119–129. https://doi.
org/10.1016/0010-406X(70)90658 -4
Faure-Lacroix, J., Desrochers, A., Imbeau, L., & Simard, A. (2019). Going beyond a leap of faith when choosing between active and passive bat monitoring methods. Acta Chiropterologica, 21(1), 215–228. https:// doi.org/10.3161/15081 109AC C2019.21.1.018
Forschhammer, M. C., Post, E., & Stenseth, N. C. (1998). Breeding phe-nology and climate. Nature, 391, 29–30.
Fox, J., & Weisberg, S. (2018). Visualizing fit and lack of fit in complex regression models with predictor effect plots and partial residuals.
Journal of Statistical Software, 87(9), https://doi.org/10.18637 /jss.
v087.i09
Francl, K. E., Ford, W. M., Sparks, D. W., & Brack, V. (2012). Capture and reproductive trends in summer bat communities in west virginia: assessing the impact of White-Nose syndrome. Journal of Fish and
Wildlife Management, 3(1), 33–42. https://doi.org/10.3996/06201
1-JFWM-039
Frank, C. L., Michalski, A., McDonough, A. A., Rahimian, M., Rudd, R. J., & Herzog, C. (2014). The resistance of a North American bat species (Eptesicus fuscus) to white-nose syndrome (WNS). PLoS ONE, 9(12), e113958. https://doi.org/10.1371/journ al.pone.0113958
Frick, W. F., Baerwald, E. F., Pollock, J. F., Barclay, R., Szymanski, J. A., Weller, T. J., … McGuire, L. P. (2017). Fatalities at wind tur-bines may threaten population viability of a migratory bat.
Biological Conservation, 209, 172–177. https://doi.org/10.1016/j.
biocon.2017.02.023
Frick, W. F., Pollock, J. F., Hicks, A. C., Langwig, K. E., Reynolds, D. S., Turner, G. G., … Kunz, T. H. (2010). An emerging disease causes re-gional population collapse of a common North American bat species.
Science, 329(5992), 679–682.
Frick, W. F., Reynolds, D. S., & Kunz, T. H. (2010). Influence of climate and reproductive timing on demography of little brown myotis (Myotis
lucifugus). Journal of Animal Ecology, 79(1), 128–136. https://doi.
org/10.1111/j.1365-2656.2009.01615.x
Froschauer, A., & Coleman, J. (2012). North American bat death toll
ex-ceeds 5.5 million from white-nose syndrome. Retrieved from http://
www.batcon.org/pdfs/USFWS_WNS_Morta lity_2012_NR_FINAL. pdf
Gargas, A., Trest, M. T., Christensen, M., Volk, T. J., & Blehert, D. S. (2009). Geomyces destructans sp. nov. associated with bat white-nose syndrome. Mycotaxon, 108(1), 147–154.
Hauer, C., Powers, L., Mcnaughton, D., Paul, C., & Sewall, B. (2019). Changes in a summer bat community in southeastern Pennsylvania.
Journal of the Pennsylvania Academy of Science, 93(1), 47–62.
Hickey, M. B. C., Acharya, L., & Pennington, S. (1996). Resource parti-tioning by two species of vespertilionid bats (Lasiurus cinereus and
Lasiurus borealis) feeding around street lights. Journal of Mammalogy, 77(2), 325–334. https://doi.org/10.2307/1382804
Humphries, M. M., Thomas, D. W., & Speakman, J. R. (2002). Climate-mediated energetic constraints on the distribution of hibernating mammals. Nature, 418(6895), 310–313. https://doi.org/10.1038/ natur e00903
Hurrell, J. (1995). Decadal Trends in the North Atlantic Oscillation: Regional Temperatures and Precipitation. Science, 269(5224), 676– 679. https://doi.org/10.1126/scien ce.269.5224.676#_blank Hurrell, J. W., Kushnir, Y., Ottersen, G., & Visbeck, M. (2003). An
over-view of the North Atlantic Oscillation. In J. W. Hurrell, Y. Kushnir, G. Ottersen, & M. Visbeck (Eds.), Geophysical monograph series (Vol. 134, pp. 1–35). Washington, DC: American Geophysical Union. https:// doi.org/10.1029/134GM01
Ingersoll, T. E., Sewall, B. J., & Amelon, S. K. (2016). Effects of white-nose syndrome on regional population patterns of 3 hibernating bat spe-cies: White-Nose syndrome and bat declines. Conservation Biology,
30(5), 1048–1059. https://doi.org/10.1111/cobi.12690
Jachowski, D. S., Dobony, C. A., Coleman, L. S., Ford, W. M., Britzke, E. R., & Rodrigue, J. L. (2014). Disease and community structure: White-nose syndrome alters spatial and temporal niche partitioning in sym-patric bat species. Diversity and Distributions, 1002–1015.
Jutras, J., Delorme, M., Mc Duff, J., & Vasseur, C. (2012). Le suivi des chauves-souris du Québec. Le Naturaliste Canadien, 136(1), 48–52. Kunz, T. H., Wrazen, J. A., & Burnett, C. (1998). Changes in body mass and
fat reserves in pre-hibernating little brown bats (Myotis lucifugus).
Kurta, A., Kunz, T. H., & Nagy, K. A. (1990). Energetics and water flux of free-ranging big brown bats (Eptesicus fuscus) during pregnancy and lactation. Journal of Mammalogy, 71(1), 59–65.
Larsen, E. (1986). Competitive release in microhabitat use among coexist-ing desert rodents: A natural experiment. Oecologia, 69(2), 231–237. Minnis, A. M., & Lindner, D. L. (2013). Phylogenetic evaluation of
Geomyces and allies reveals no close relatives of Pseudogymnoascus destructans, comb. nov., in bat hibernacula of eastern North
America. Fungal Biology, 117(9), 638–649. https://doi.org/10.1016/j. funbio.2013.07.001
Moosman, P. R., Veilleux, J. P., Pelton, G. W., & Thomas, H. H. (2013). Changes in capture rates in a community of bats in New Hampshire during the progression of White-Nose syndrome. Northeastern
Naturalist, 20(4), 552–558. https://doi.org/10.1656/045.020.0405
Mormann, B. M., & Robbins, L. W. (2007). Winter roosting ecology of eastern red bats in Southwest Missouri. The Journal of Wildlife
Management, 71(1), 213–217. https://doi.org/10.2193/2005-622
Morningstar, D. E., Robinson, C. V., Shokralla, S., & Hajibabaei, M. (2019). Interspecific competition in bats and diet shifts in response to white-nose syndrome. Ecosphere, 10(11), https://doi.org/10.1002/ ecs2.2916
Muggeo, V. M. (2015). Package ‘segmented’. Biometrika, 58, 525–534. National Center for Atmospheric Research Staff (Eds). (2018). The
Climate Data Guide: Hurrell North Atlantic Oscillation (NAO) Index (PC-based). Retrieved from https://clima tedat aguide.ucar. edu/clima te-data/hurre ll-north -atlan tic-oscil latio n-nao-index -pc-based
Neubaum, D. J., O’Shea, T. J., & Wilson, K. R. (2006). Autumn migra-tion and selecmigra-tion of rock crevices as hibernacula by big brown bats in Colorado. Journal of Mammalogy, 87(3), 470–479. https://doi. org/10.1644/05-MAMM-A-252R1.1
Norquay, K. J. O., Martinez-Nuñez, F., Dubois, J. E., Monson, K. M., & Willis, C. K. R. (2013). Long-distance movements of little brown bats (Myotis lucifugus). Journal of Mammalogy, 94(2), 506–515. https://doi. org/10.1644/12-MAMM-A-065.1
Norquay, K. J. O., & Willis, C. K. R. (2014). Hibernation phenology of Myotis lucifugus. Journal of Zoology, 294(2), 85–92. https://doi. org/10.1111/jzo.12155
O’Keefe, J. M., Pettit, J. L., Loeb, S. C., & Stiver, W. H. (2019). White-nose syndrome dramatically altered the summer bat assemblage in a temperate Southern Appalachian forest. Mammalian Biology, 98(1), 146–153. https://doi.org/10.1016/j.mambio.2019.09.005
Perkins, J. M. (1996). Does competition for roosts influence bat distribu-tion in a managed forest? In R. M. R. Barclay, & R. M. Brigham (Eds.),
Bats and Forests Symposium, October 19–21, 1995 (pp. 164–172).
Victoria, BC, Canada: Research Branch, BC Ministry of Forests. BC Working Paper 23/1996. Citeseer.
Perry, R. W. (2013a). A review of factors affecting cave climates for hi-bernating bats in temperate North America. Environmental Reviews,
21(1), 28–39. https://doi.org/10.1139/er-2012-0042
Perry, R. W. (2013b). Potential energy expenditure by litter-roosting bats associated with temperature under leaf litter during winter. Journal
of Thermal Biology, 38(8), 467–473. https://doi.org/10.1016/j.jther
bio.2013.08.007
Peterson, R. A., & Brown, S. P. (2005). On the use of beta coefficients in meta-analysis. The Journal of Applied Psychology, 90(1), 175–181. https://doi.org/10.1037/0021-9010.90.1.175
Pettit, J. L., & O’Keefe, J. M. (2017). Impacts of White-Nose syndrome observed during long-term monitoring of a midwestern bat commu-nity. Journal of Fish and Wildlife Management, 8(1), 69–78. https://doi. org/10.3996/10201 6-JFWM-077
Powers, L. V., Kandarian, S. C., & Kunz, T. H. (1991). Ontogeny of flight in the little brown bat, Myotis lucifugus: Behavior, morphology, and muscle histochemistry. Journal of Comparative Physiology A, 168(6), 675–685. https://doi.org/10.1007/BF002 24357
R Core Team (2016). R: A language and environment for statistical
comput-ing. Retrieved from https://www.R-proje ct.org/
Ruscoe, W. A., Ramsey, D. S. L., Pech, R. P., Sweetapple, P. J., Yockney, I., Barron, M. C., … Duncan, R. P. (2011). Unexpected consequences of control: Competitive vs. predator release in a four-species as-semblage of invasive mammals. Ecology Letters, 14(10), 1035–1042. https://doi.org/10.1111/j.1461-0248.2011.01673.x
Schorcht, W., Bontadina, F., & Schaub, M. (2009). Variation of adult survival drives population dynamics in a migrating for-est bat. Journal of Animal Ecology, 78(6), 1182–1190. https://doi. org/10.1111/j.1365-2656.2009.01577.x
Simard, M. A., Huot, J., de Bellefeuille, S., & Côté, S. D. (2014). Linking conception and weaning success with environmental variation and female body condition in a northern ungulate. Journal of Mammalogy,
95(2), 311–327. https://doi.org/10.1644/13-MAMM-A-036
Statistics Canada. (2012). Census of Population, 2011: Census Tract (CT) Profiles, Catalogue no. 98–316-XWE. Retrieved from http://www12. statc an.gc.ca/censu s-recen semen t/2011/dp-pd/prof/
Stenseth, N. C., Ottersen, G., Hurrell, J. W., Mysterud, A., Lima, M., Chan, K.-S., … Adlandsvik, B. (2003). Studying climate effects on ecology through the use of climate indices: The North Atlantic Oscillation, El Nino Southern Oscillation and beyond. Proceedings of the Royal
Society B: Biological Sciences, 270(1529), 2087–2096. https://doi.
org/10.1098/rspb.2003.2415
Thalken, M. M., Lacki, M. J., & Johnson, J. S. (2018). Shifts in assemblage of foraging bats at Mammoth Cave National Park following arrival of white-nose syndrome. Northeastern Naturalist, 25(2), 202–214. https://doi.org/10.1656/045.025.0203
Thogmartin, W. E., King, R. A., Szymanski, J. A., & Pruitt, L. (2012). Space-time models for a panzootic in bats, with a focus on the endangered Indiana bat. Journal of Wildlife Diseases, 48(4), 876–887. https://doi. org/10.7589/2011-06-176
Thogmartin, W. E., & McKann, P. C. (2014). Large-scale climate vari-ation modifies the winter grouping behavior of endangered Indiana bats. Journal of Mammalogy, 95(1), 117–127. https://doi. org/10.1644/13-MAMM-A-098
Thomas, D. W., & Geiser, F. (1997). Periodic arousals in hibernating mammals: Is evaporative water loss involved? Functional Ecology, 11, 585–591.
Titeux, N., Henle, K., Mihoub, J.-B., & Brotons, L. (2016). Climate change distracts us from other threats to biodiversity. Frontiers in Ecology and
the Environment, 14(6), 291–291. https://doi.org/10.1002/fee.1303
Viechtbauer, W. (2015). Package ‘metafor’. The Comprehensive R Archive
Network. Package ‘Metafor’. http://Cran.r-Proje ct.Org/Web/Packa
ges/Metaf or/Metaf or.Pdf. Retrieved from ftp://164.41.45.3/pub/
plan/R/web/packa ges/metaf or/metaf or.pdf
Whitaker, J. O. Jr, Brack, V. Jr, & Cope, J. B. (2002). Are bats in Indiana declining? Proceedings of the Indiana Academy of Science, 111, 95–106. Wimsatt, W. (2012). Biology of Bats. Amsterdam, Netherlands: Elsevier. Winhold, L., Kurta, A., & Foster, R. (2008). Long-term change in an
assem-blage of North American bats: Are eastern red bats declining. Acta
Chiropterologica, 10(2), 359–366. https://doi.org/10.3161/15081
1008X 414935
How to cite this article: Faure-Lacroix J, Desrochers A, Imbeau L, Simard A. Long-term changes in bat activity in Quebec suggest climatic responses and summer niche partitioning associated with white-nose syndrome. Ecol Evol. 2020;10:5226–5239. https://doi.org/10.1002/ece3.6194