ADOPTION OF LEAN MANUFACTURING SYSTEM
WITH AIM OF EFFICIENCY IMPROVEMENT WITHIN A
LATE LEAN ADOPTER COMPANY (A CASE STUDY)
by
Sahand JALILI MARANDI
THESIS PRESENTED TO ÉCOLE DE TECHNOLOGIE SUPÉRIEUREIN
PARTIAL FULFILLMENT OF THE REQUIREMENTS FOR A MASTER’S
DEGREE WITH THESIS IN ENGINEERING, CONCENTRATION IN
INNOVATION MANAGEMENT
M.A.Sc
MONTREAL, SEPTEMBER 20TH, 2018
ÉCOLE DE TECHNOLOGIE SUPÉRIEURE UNIVERSITÉ DU QUÉBEC
This Creative Commons license allows readers to download this work and share it with others as long as the author is credited. The content of this work can’t be modified in any way or used commercially.
BOARD OF EXAMINERS
THIS THESIS HAS BEEN EVALUATED BY THE FOLLOWING BOARD OF EXAMINERS
Dr. Michel Rioux,ing., Ph. D., Thesis Supervisor
Department of Automated Manufacturing Engineering at École de technologie supérieure
Dr. Tony Wong,ing., Ph. D., President of the Board of Examiners
Department of Automated Manufacturing Engineering at École de technologie supérieure
Dr. Mickaël Gardoni,ing., Ph. D., Member of the jury
Department of Automated Manufacturing Engineering at École de technologie supérieure
THIS THESIS WAS PRENSENTED AND DEFENDED
IN THE PRESENCE OF A BOARD OF EXAMINERS AND PUBLIC ON SEPTEMBER 13TH, 2018
ACKNOWLEDGMENT
Foremost, I would like to express my deepest appreciation to my advisor Prof. Michel Rioux for his continuous support during entire of my master program. He gave me this opportunity to work on my favourite field. It was not possible for me to accomplish this research without his precious comments and ideas. I always benefited from his fortitude, motivation, enthusiasm and immense knowledge.
Beside my advisor, I would like to thank the rest of my thesis committee: Prof. Tony Wong and Prof. Mickaël Gardoni for taking time to read my thesis and offering insightful and valuable comments.
I would also like to thank the experts who answered my questions with patience and helped me hearty with gathering data to conduct this study.
Last but not the least, I must express my very profound gratitude to my family specially my dear parents Ali and Mahin, for their unconditional love and endless encouragement in all scenes of my life.
ADOPTION D'UNE APPROCHE DE FABRICATION LEAN EN VUE D'UNE AMÉLIORATION DE L'EFFICACITÉ AU SEIN D'UNE ENTREPRISE
RETARDATAIRE DANS CE DOMAINE (ÉTUDE DE CAS)
Sahand JALILI MARANDI
RÉSUMÉ
«Lean manufacturing» (LM) et «Lean production» sont les termes et les concepts qui ont été introduits dans le monde de l'industrie depuis les années 1990. Au cours de ces trois dernières décennies, de nombreuses entreprises de différents secteurs ont appliqué le Lean dans le but d'éliminer les gaspillages et de mettre en œuvre des améliorations continues dans leur organisation. Bien que les capacités et les avantages du Lean aient été prouvés au fil des années, certaines entreprises hésitent encore à utiliser cette approche. Selon la théorie de la «diffusion de l'innovation», fondée sur le facteur d'innovation, les adoptants d'une innovation sont divisés en cinq catégories : innovateurs, adoptants précoces, majorité précoce, majorité tardive et retardataires. L'innovation peut être considérée comme une nouvelle idée, procédure, pratique, produit, etc. Chacune de ces catégories a ses propres caractéristiques. L'objectif de cette recherche porte sur l'adoption de LM dans une entreprise retardataire. Le cas de cette étude (entreprise X) est un fabricant de meubles au Québec avec principalement un système de production sur commandes en flux poussé. On constate actuellement de longs délais de livraison, un manque d'espace dans l'atelier et un taux de production insatisfaisant. Des entreprises similaires avec les mêmes problèmes que l’entrepriseont amélioré leur efficacité globale en appliquant le concept Lean, mais notre cas n'a pas été transformé en LM jusqu'à présent et les dirigeants ne sont pas très intéressés par la mise en œuvre d’une telle démarche. Le processus de décision d'innovation comporte cinq étapes : la connaissance, la persuasion, la décision, la mise en œuvre et la confirmation. Dans cette étude, il est prévu d'aider l'entreprise à atteindre la troisième étape pour prendre une décision sur la mise en œuvre du LM.
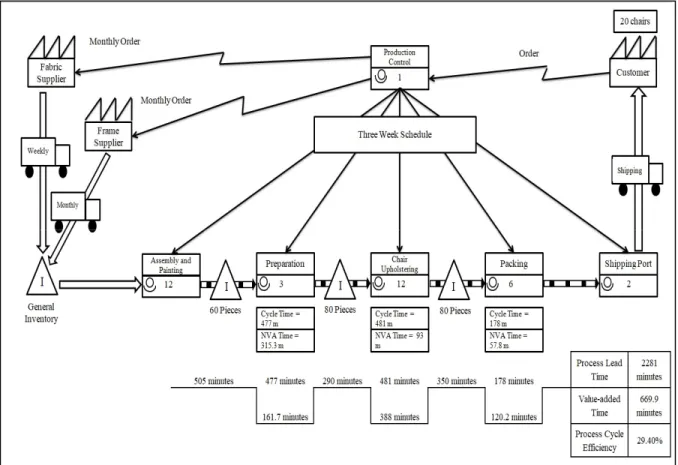
L’implantation du Lean est un long voyage et il sera plus long encore pour les retardataires. La raison pour laquelle ils sont réticents à l'adoption du Lean est leur ignorance des pertes existantes et de leurs impacts dans le système. Dans ces entreprises avec une structure organisationnelle traditionnelle, l'inconscience est le résultat d'un travail en vase clos et de communications faibles. Afin de convaincre les retardataires, il est essentiel de briser les silos, d'améliorer les interactions et de développer une synergie mutuelle. Les retardataires n'accepteront pas une innovation tant qu'ils n'auront pas complètement acquis la certitude qu'elle est sans danger pour eux. Dans cette recherche, nous proposons une feuille de route pour indiquer l'opportunité d'augmenter l'efficacité totale du cycle de 29,4% à 78,3%.
Mots-clés: Lean Manufacturing (LM), Diffusion d'Innovations, Retardataires, Processus
ADOPTION OF LEAN MANUFACTURING SYSTEM WITH AIM OF EFFICIENCY IMPROVEMENT WITHIN A LATE LEAN ADOPTER COMPANY (A CASE
STUDY)
Sahand JALILI MARANDI
ABSTRACT
“Lean manufacturing” (LM) and “Lean production” are the terms and concepts which have been introduced to industry world since 1990s. In these almost three decades many companies in various sectors have applied lean with aim of eliminating wastes and implementing continuous improvements in their organization. Although the capabilities and advantages of lean have been proven over the years, some companies are still hesitate to use this method. According to the theory of the “Diffusion of Innovation” (DOI), based on innovativeness factor, adopters to an innovation are divided into five categories: innovators, early adopters, early majority, late majority and laggards. Innovation can be considered as a new idea, procedure, practice, product and etc. Each of these categories has its own characteristics. The focus of this research is about adoption of LM in a laggard company. The case of this study (company X) is a furniture manufacturer in Quebec with mainly push production system. They are currently encountering with long delivery times, lack of space in the shop floor and unsatisfied production rate. Similar companies with the same problems as company X have improved their total efficiency with applying lean concept but our case has not been turned into LM until now and they are not very interested in implementing this procedure. Innovation-decision process has five stages: knowledge, persuasion, decision, implementation and confirmation. In this study, it is intended to help the company to reach to the third stage to make decision about lean implementation.
Lean is a long and time taking journey and it will be longer in case of late adopters. The reason that they are reluctant in lean adoption is their ignorance about existing wastes and their impacts in the system. In such companies with traditional organizational structure, unawareness is the result of working in silos and having weak communications. In order to convince laggards to make decision about lean implementation, it is essential to break down the silos, improve interactions and deploy mutual synergy among them. Laggards will not accept an innovation until they completely become certain it is safe for them. In this research, we propose a road map to indicate the opportunity to increase total cycle efficiency from 29.4% to 78.3%.
Keywords: Lean manufacturing (LM), Diffusion of Innovations (DOI), Laggards,
TABLE OF CONTENTS
Page
INTRODUCTION ...1
CHAPTER 1 LITERATURE REVIEW ...9
1.1 Diffusion of innovations ...9
1.1.1 Innovation-decision process ... 13
1.1.2 Silo management system ... 14
1.2 Lean manufacturing ...16 1.3 Lean principles ...18 1.3.1 Value ... 18 1.3.2 Value stream ... 19 1.3.3 Flow ... 20 1.3.4 Pull ... 20 1.3.5 Perfection ... 21 1.4 Lean Tools ...22
1.4.1 Value Stream Mapping (VSM) ... 22
1.4.2 Kanban ... 24
1.4.3 Kaizen ... 27
1.4.4 5S ... 29
1.5 Lean leadership ...33
1.5.1 Successful lean implementation ... 33
1.5.2 Role of management ... 35
1.5.3 Leadership principles ... 36
CHAPTER 2 METHODOLOGY ...39
2.1 Characteristics of the company and finding rejection step in innovation-decision process...39
2.2 Identifying product families ...41
2.3 Sample selection ...42
2.4 Initial observation ...43
2.5 Conducting current value stream map ...44
2.6 Process observation ...45
2.7 Analyzing the results...47
2.8 Suggestions for improvements ...47
CHAPTER 3 ANALYSIS OF THE CURRENT SITUATION ...49
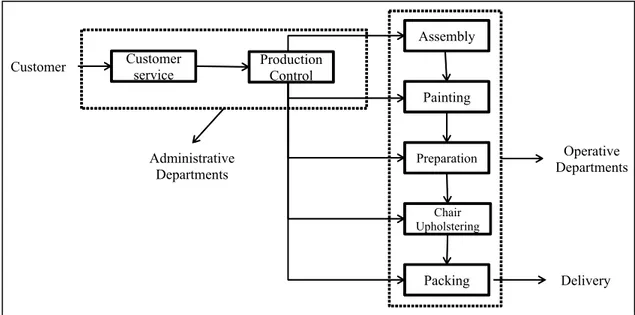
3.1 Involved departments ...49
3.1.1 Preparation ... 50
3.1.2 Chair upholstering ... 51
3.1.3 Packing ... 51
3.2 Job completion path ...51
3.4 Waste identification within processes ...57
3.5 Space organization ...60
3.6 Communication ...61
3.7 Plant layout ...62
CHAPTER 4 ANALYSIS OF POTENTIAL IMPROVEMENTS ...65
4.1 Overview of the problems ...66
4.2 Proposed solutions ...67
4.2.1 Introducing lean culture ... 67
4.2.2 Applying Kaizen and 5S ... 69
4.2.3 Applying Kanban, one-piece flow technique, unification of the work procedure and automation ... 69
4.2.4 Communication improvement ... 75
4.2.5 Implementing pull production... 76
4.3 Future value stream map for P1 ...77
4.4 Inductive generalization model ...78
CONCLUSION ...83
ANNEX I DATA COLLECTION FOR CREATING VSM ...89
ANNEX II INDIVIDUAL OBSERVATION TABLES ...91
ANNEX III CYCLE TIMES FOR UPHOLSTERING IN FAST MODE ...95
ANNEX IV VALUE STREAM MAP SYMBOLS ...97
LIST OF TABLES
Page
Table 1.1 Evolution of lean manufacturing ...3
Table 2.1 Data collection for creating VSM ...44
Table 2.2 Data collection for sub-processes ...46
Table 4.1 Summary of the descriptions of the detected problems ...66
LIST OF FIGURES
Page
Figure 1.1 Diffusion of innovations curves ...11
Figure 1.2 Model of five stages in innovation-decision process ...14
Figure 1.3 Principles of lean ...21
Figure 1.4 VSM components ...23
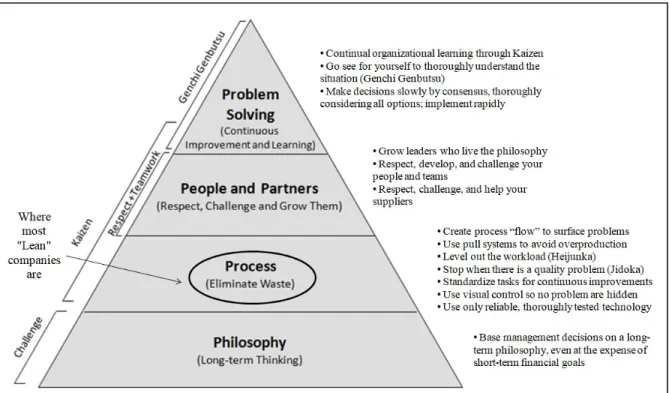
Figure 1.5 "4 P" model of the Toyota Way ...34
Figure 3.1 Seven workflow steps by department ...50
Figure 3.2 Current value stream map for P1 ...56
Figure 3.3 Time analysis of preparation process for P1 ...58
Figure 3.4 Time analysis of upholstering process for P1 ...59
Figure 3.5 Time analysis of packing process for P1 ...60
Figure 3.6 Current plant layout ...63
Figure 4.1 Kanban board for material refilling ...70
Figure 4.2 Comparison between two observations for upholstering operations ...72
Figure 4.3 Future value stream map for P1 ...78
Figure 4.4 Finding the root cause of the unwillingness thorough 5 Whys ...79
LIST OF ABREVIATIONS
BPR Business Process Reengineering CI Continuous Improvements DOI Diffusion of Innovations ERP Enterprise Resource Planning JIT Just in Time
LM Lean Manufacturing MTO Make to Order NVA Non-Value-Added
SMEs Small and Mid size Enterprises TPS Toyota Production System TQM Total Quality Management TSSC Toyota Supplier Support Center VA Value-Added
VSM Value Stream Map WIP Work in Progress
LIST OF SYMBOLS
hr Hour min Minute s Second
INTRODUCTION Late Lean Adopters
Plenty of literatures have focused on applying lean in different kinds of businesses but there is a lack of attention in the steps of implementing lean in laggard companies. In this thesis it is not intended to study the results of implementing LM in a specific industry or business. The goal of this study is to find solutions and procedures that lead to convince the managers of a company, who have the characteristics of laggards or late adopters, that lean concepts and tools will help them to improve efficiency and increase the profitability of the organization. To do this end, after introducing laggards and their specs in brief, we are going to present lean concept and its tools which are appropriate to the subject of this study, then investigate the current situation of the company and diagnose the wastes in the system. By indicating these wastes and their impact it will try to take the attention of the top management. Proposing solutions and recommendations for the future to improve the overall efficiency within context of the lean will be performed with the aim of persuading managers to think about potential opportunities for implementing continuous improvements (CI). The case of this dissertation is a furniture manufacturer which is one the important industries in the area (Quebec).
Capabilities and advantages of lean have been become obvious in various industries especially in manufacturing sector in recent decades. Many enterprises have followed lean thinking and applied its tools and benefit from advantages of this procedure by reducing wastes and implementing CI. After almost 30 years from advent of lean in production lines and see its dramatic effects on increasing total efficiency of the organizations, it is not an unfamiliar concept in mind of managers. However, nowadays some companies are sceptic or hesitate to turn from traditional production way into lean manufacturing (LM).
Generally, individuals may respond to an innovation in different ways. This innovation can be a new practice or drill, procedure, product, tools, equipment and so on. According to the
theory of the “Diffusion of Innovations” (DOI) which has been developed first by Everett M. Rogers in 1962, there are five adapter categories: innovators, early adopters, early majority, late majority and laggards. Late adopters or laggards are the last group who will be interested to apply an innovation. Rate of adoption, which is measured by needed time to accept an innovation, is relatively longer for laggards than the other groups.
Global Competition in Manufacturing
Nowadays with the impressive technological advancement in every aspect from designing steps to producing and deliver the final product, customers expect faster services and higher quality commodities from manufacturers. These expectations create a competitive atmosphere for all manufacturers especially small and mid size enterprises (SMEs) to produce articles and offer services which can properly respond their clients’ needs. Many manufacturers are forced to resize or shut down some of their branches and production lines because they did not succeed to gain customers’ satisfaction. This dissatisfaction usually has root in delivery time, quality and price.
However stay alive in global market is important, but it is not enough. Some companies produce high quality products but on the other hand their delivery time or final price do not meet customer’s expect. This unbalanced conditions in offered service, put these companies in danger of losing even their loyal clients. Undoubtedly managing all these factors (quality, time and price) is not possible without cost. Therefore, managers are looking for affordable tools and techniques which can effectively reduce costs and lead time and also improve the quality.
A helpful solution to lessen costs and time in a manufacturer is to completely study all the processes in production cycle and then identify non-value-added (NVA) activities in these processes. The next step is to eliminate these wastes and improve the general function of the firm. Actually this is exactly what lean manufacturing and its tools are talking about.
Background
History of lean manufacturing (LM) is reachable in various literatures and websites. Many believe that Henry Ford was the first person who practically used Just In Time (JIT) and lean manufacturing concepts. However his innovation and achievements are considered as a revolution in automobile industry in 1910s, his mass production procedures were not found applicable to implementation in Japan by Kiichiro Toyoda and Taiichi Ohno who traveled to America to study Ford’s method. They found American’s mass production method full of wastes or Muda (in Japanese). With making revisions on Ford’s idea about production, then they proposed Toyota Production System (TPS).
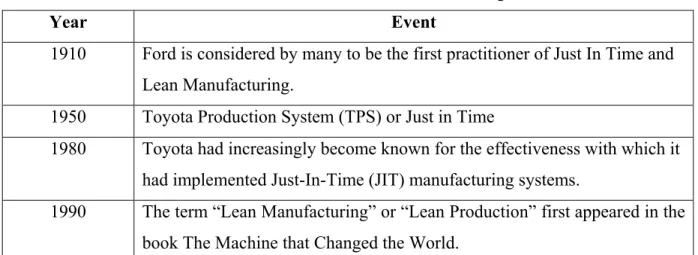
“Lean Production” or “Lean Manufacturing” is the terms which first used by Womack and his colleagues in the book The Machine that Changed the World for TPS which is about their results in studying automobile production systems in the world. Table 1 describes the evolution of lean manufacturing during last decades (Halgeri, Pei, Iyer, Bishop, & Shehadeh, 2008).
Table 1.1 Evolution of lean manufacturing
Year Event
1910 Ford is considered by many to be the first practitioner of Just In Time and Lean Manufacturing.
1950 Toyota Production System (TPS) or Just in Time
1980 Toyota had increasingly become known for the effectiveness with which it had implemented Just-In-Time (JIT) manufacturing systems.
1990 The term “Lean Manufacturing” or “Lean Production” first appeared in the book The Machine that Changed the World.
TPS and lean manufacturing has the same foundations: eliminating wastes and continuous improvements by all the employees. “Doing more with less” is a famous phrase in definition
of lean manufacturing which means using resources in efficient way in a firm. These resources could be money, time, work space, human, tools and etc.
It is important to know that lean implementation does not mean just using specific tools and techniques in order to improve the function of a factory or manufacturer. Many enterprises failed in applying lean because lack of top management commitment. To have a successful result the entire culture and mindset of the company should change (Liao, 2005).
About the Company
The case study of this research (company X) is a furniture manufacturer in Quebec. It has been founded for about 50 years and its products are mainly used in health care and hospitality industries. Company X consists of around 150 employees who are working one shift each day from 7:30 to 16:45. With having various production line and product families, they produce high quality furniture packages, both metal and wood chairs, which vary from living industry such as dining and resident rooms, lounges, theaters, chapels, beauty salons and etc. to resaurants, bars, cafeterias and so on. The company is also active in furnishing schools, universities, shopping malls, arenas, funeral homes and party salons. Corporate X produces and sells large variey of commercial furniture to customers from Canada and USA.
In order to control and orginize stocks in inventroy and also the processes of the production, management team believed in using Enterprise Resource Planning (ERP) software in their organization. Hence, they bought ERP software and were looking for proper conditions to implement it in the shop floor. But after visiting the shop floor and production processes, it was recognized with current facilities, the plant has this ability to increase the production capacity and raise the profitability of the company. Therefore, it was suggested to them first think about reengineer and simplifying the processes and try to use the maximum capacity of the production before applying ERP system. According to the results of Schniederjans et Kim (2003) use of Business Process Reengineering (BPR) and implementing a Total Quality
Management (TQM) culture have substantial effect on successfulness of a company in establishing ERP system.
Statement of the Problem
According to the subject of the thesis, the fundamental problem which is going to be addressed in this research is unwillingness of the management to apply lean in their corporation. Company X is a luxury furniture manufacturer and it is wellknown in supplying packages for special industries like hospitality and healthcare. Since these industries both are increasingly expanding, currently the company has faced with a significant increment in amount of received purchase orders. For some reasons they have not turn from traditional production into LM. Hence, in this situation company X has encountered to three problems. The first one is a common problem among all manufaturer in the same condition which is about delivering final products to customer on time. They have obligation to deliver the goods to the client within maximum six weeks, but in most of cases this period is not respected.
The second problem is organization of the space in the shop floor. They are not satisfied with the size of the workhouse and claim that the size of site in not suitable for the current rate of production.Eventhough the company has rented another place to stock their production and materials, they do not have enough space to manage the processes in their workshop. This lack of space somtimes forces them to decline new orders.
The third problem which is the last priority of the company, is volume of the production. Managers believe that with current workforce, equipment and conditions they are capable to double their production rate but on the other hand, most of times ther are unable to respect dedlines of current orders. In the opinion of the management, they are not working in their full capacity and this issue is intensively impact the profitablity of the company.
Research Objective
In the most studies focused on LM in various applications, mainly the objectives are to define the current situation, use lean techniques and principles and ultimately report the final results which indicate applied procedures lead to improvement in overall efficiency. Lean journey is relatively long and it will take months to see the remarkable effects of applying LM. Furthermore, it can be longer and lasts years if the case is a late adopter or laggard. Therefore, it was not possible for the researcher to indicate the results after implementation with real data in the time frame of this study. Besides this, as it was mentioned before, the objective of this research is not to assess the results of LM implementation in a furniture manufacturer.
The first objective of this research regarding to these conditions is to make sure that the case of the study is belonging to laggard category. The second objective is persuading the managers of such case to have positive attitude toward LM and helping them to make decision about implementing CI in their organization. Also the results of this research are intended to set recommendations to improve the delivery time and use the space of the workplace in more efficient way which lead to increase production and profit rates.
Scope of the Project
Company X is producing a wide range of the furniture. They are manufacturing three main categories of the furniture which are chairs, soft seats and banquettes. However, they have some other activities such as producing tables, wood works and new products development. Since the significant portion of their sales is rely on chairs’ production, the scope of this project is limited to study of the chair’s production line. Moreover, creating value stream maps (VSM), to describe current and future status of the production, have to be done based on repetitive sample and at the time of the study the most pressure of the production was in chair department and other products in soft seats and banquettes stratums were not produced in high volume and repetitive mode.
Research Questions
By considering mentioned problems, it is needed to answer the following questions to conduct this research and find solutions for the problems:
1) Why the case of the study has not turned to LM until now and in which stage of adoprion process they are blocked in?
2) What is the current situation of the company?
3) Which activities are value added and which ones are not?
4) What are the potential and applicable solutions within lean principals to improve total cycle efficiency for the production line?
5) What will be the result of recommendations and what does the improved future value stream map look like?
Organization of the Thesis
Following the introduction section, this thesis contains four chapters. Chapter 1 is literature review which is about related researchs to support this study. Chapter 2 is the methodology of the research which is about how the project was conducted and also the process of data gathering will be explained in this part. In the third chapter the current status of the company X from different points of view is explained with presenting gained data. In the last chapter, potential solutions and recommendations to existence issues which were found out by analysis of the current status will be discussed. This chapter comprises discussions about how the system can be improved after implementing LM. Finally the dissertation will be ended by presenting conclusion.
CHAPTER 1 LITERATURE REVIEW
In this chapter we are going to review literatures and papers related to this study. First, we will begin this section with introducing DOI and late adapters. The reset of literature review comprises similar researches about implementing lean manufacturing in various industries. Their procedures and methods that used to obtain successful results have been surveyed carefully and have an important role in conducting this research. In the following of the literature review we are focusing in lean manufacture’s principles and tools and lean leadership.
1.1 Diffusion of innovations
In respond to an innovation, individuals may react in different ways. Everyone does not immediately accept an innovation even if it has obvious advantages which have been proven long time ago. This innovation can be an idea, procedure, product, drill and etc. which is considered as new by the practitioners (Rogers, 2010). There are various studies have been done before in field of diffusion of innovation but theory of the DOI was first developed by Rogers in 1960s. The basis of this theory is its compliment about diffusion in which define it as the process of deployment of an innovation within the members of a social system through certain channels. In this definition social system refers to a set of interrelated units which are engaged in joint problem-solving to fulfill a common goal (Rogers, 2010).
After developing the theory of the DOI, plenty of researches have been done based on this opinion in various domains. Raynard (2017) analyzed the results attitudes of student and faculty toward using electronic books as an innovation and aligned them with the DOI theory. Nickerson, Austreich, et Eng (2014) considered mobile technology and Smartphone apps as innovations and examined the diffusion of them in a specific domain. Based on framework of diffusion of innovations, Valle-Cruz et Sandoval-Almazan (2015) found out
that local governments have not been completely understood the use of social media. In their study social media was considered as innovation. Wang, Lin, Chang, et Hung (2011) used the tenets of DOI to investigate how radio frequency identification (RFID) technology was deployed and adopted in Taiwan’s logistics industry. Awad, Engelhardt, Coleman, et Rogers (1984), Marsan et Pare (2013)and Romanelli (2016) have done studies about diffusion of innovations in health care organizations and services.
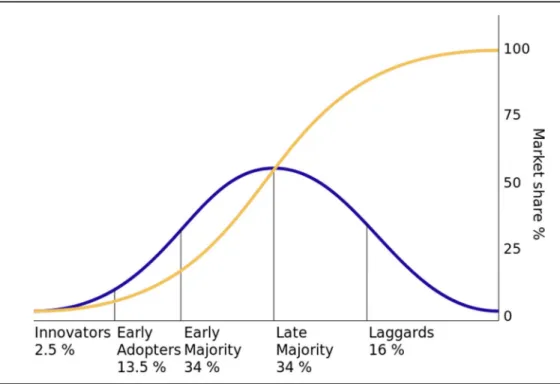
One of the most important discussions in the book of Rogers, Diffusion of Innovations, which is very helpful for this study, is about innovation adopters who are divided into five categories. This grouping is based on “innovativeness” factor which is defined as the degree an adopter is relatively earlier in accepting new ideas than the other members of the system. Therefore, adopter categories include: innovators, early adopters, early majority, late majority and laggards. Figure 1.1 comprises two curves which both of them are plotted over the time. The bell-shaped curve represents the adoption of innovation on a frequency basis. On the other hand, if the adoption data is plotted based on cumulative number of adopters, the result is an S-shaped curve (Rogers, 2010). The S-shaped indicates that by adopting an innovation to laggards (the last group) the market will be saturated and the process of the diffusion will be finished.
Figure 1.1 Diffusion of innovations curves1
However, the focus of this research is to convince decision makers with aspects of laggards toimplement LM in their organization; to better understand the relation between DOI and lean implementation we are going to explain each of five categories in brief. Rogers (2010) describes the characteristics of these groups as follow:
Innovators: The first group of adopters who are eager to try new ideas and accept an innovation. They are interested to take the risk of applying new ideas even if the fail. This interest leads to venturesome become an obsession for them and helps them to have cosmopolite social relationship. They have developed communication patterns and their access to substantial financial resources helps them to absorb the possible loss from risky innovations. They play the role of a goalkeeper in the flow of new ideas into a social system by launching the new idea in the social system with importing the innovation from outside of the system’s borders.
Early adopters: This group is more integrated than the first one. Despite innovators who are cosmopolites, early adopters are localities. They act as a role model among the other groups and are the references for advice and information about the innovation. Hence, they have a respectful place within the social members and because they want to retain this dignity so they must make judicious innovation decisions. Therefore, early adopters decrease uncertainty of a new idea by adopting it and providing an intellectual evaluation of the innovation to near-peers by means of interpersonal networks.
Early majority: The members of this category forming one-third of a system and usually adopt innovations just before the average number of a social system. Their critical position between the very earlier and the relatively late to adopt gives them an interface role in the system who provides interconnectedness. The followers of the early majority may deliberate some time before completely adopting innovations. Therefore, they have longer adoption process than the last two groups. They prefer to communicate others like themselves and rarely take leadership positions and wait to see what competition has to offer. They care about the price but interested to pay for good quality and service (Jahanmir, 2016).
Late majority: Contrary to early majority, late majority adopts innovation just after the average number of a social system. They also possess one-third of the members of the system. They movement toward innovation can be because of the economic necessity or pressure of the peers. They adopt new ideas with sceptical and cautious approach. Their insufficient financial recourses cause them not feel safe until almost all risks have been removed. Hence, they won’t make adoption until others in their social have done so.
Laggards: Followers of the last group of the innovation adoption almost do not have any idea about leadership. They mainly have traditional attribute and put the past performance as the reference of future plan. They also have interaction with members that have traditional ideas like themselves. Laggards react in a suspicious way with innovations and change agents. Their traditional trend slows down the process of adoption as much as possible and innovation-decision process in relatively long for them. They believe in their hesitation in
acceptance of new ideas because of limited recourses they have. Laggards must be certain that an innovation won’t be fail then they will afford to adopt and usually when they convince to do adoption, that innovation may have been substituted by another more recent idea which is already being used by the innovators. A good example for this case is the tendency of the companies to use new ERP software to manage the recourses years after applying reengineering and quality management tools such as LM.
1.1.1 Innovation-decision process
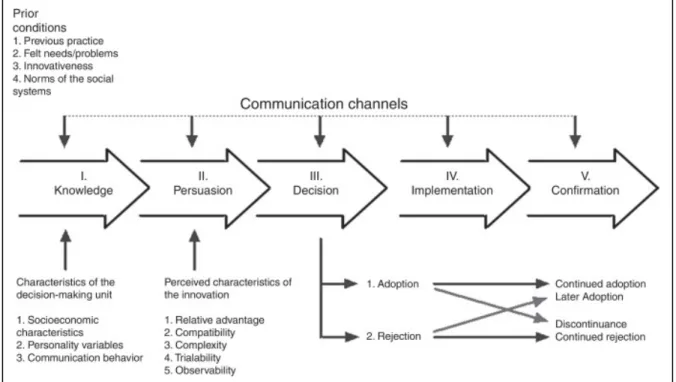
According to Rogers (2010) the innovation-decision process is the process in which decision maker person passes from first knowledge of an innovation, to creating an attitude toward the innovation, to a decision to adopt or reject, to implementation of the new idea, and to confirmation of this decision. Rogers states that this process includes five successive steps over the time that individuals go through them to evaluate the new idea and decide whether they want to integrate innovations to current situation or not. He explains these five stages as follow:
1. Knowledge: Occurs when decision maker becomes aware about existing the innovation and gains some information about it;
2. Persuasion: Occurs when decision maker forms a favourable or unfavourable tendency in face of the new ideas;
3. Decision: Occurs when decision maker engages in activities that results his or her decision about accepting or rejecting the innovation;
4. Implementation: Occurs when decision maker apply the innovation and integrates it with current situation;
5. Confirmation: Occurs when decision maker is looking for more support to applied innovation. In this stage it is possible that he or she returns from the made choice because of receiving conflict message about the innovation.
Regarding to above definitions, Rogers (2010) proposes a model for the stages of innovation-decision which is shown in figure 1.2.
Figure 1.2 Model of five stages in innovation-decision process2
1.1.2 Silo management system
In companies with traditional structure, management relies on experts in given departments to develop systems and procedures to guide the organization. These experts merely care about their own sections (silos) and have specialists working for them who created culture and systems for the silo master (O'neil, 1994). In other words, people with silo mentality work in their best interest, to do the best performance and get high level of results, regardless of the effect that might have upon others (Hotăran, 2009). This phenomenon occurs when certain departments and sections in an organization do not share their information and knowledge with each other and flow of information is very slow in such company. The “silo effect” is a common term in the business and organizational communities to describe a lack of communication and common goals between departments in a company (Hotăran, 2009).
Silos do not really physically exist in organizations, but they are in the mind of employees who have a shared impression of its reality. In their mind, it is more safe and comfortable to keep others out and in this case silos are considered as barriers in organizations which creates “us and them” attitude (Cilliers & Greyvenstein, 2012). To better understand the point, imagine two silos right next to each other and if people were inside them they could not be able to communicate because silos are tall, narrow and without any hatch to the outside (Hotăran, 2009).
O'neil (1994) states that the silo master keeps the control of his or her area by giving to understand to other silo masters that how his or her department works and there will be no interference from other groups or departments. In this situation, managers of the departments do not fully understand the requirements for positive interaction within each other. He explains this matter by giving an example in which customer’s order passes through several departments like marketing, design, manufacturing engineering, manufacturing and each of them just perform based on their own interpretation without having effective communication. Quality control department diagnoses the product undesirable and they have to do the job again with the same attitude. At the end, when the final product is delivered to the customer, it is rejected because it does not meet his requirements.
Silo management system leads to poor connection and this will reduce efficiency of the organization and undermine the spirit of cooperation and corporate culture. It imposes additional costs to the company and creates complicated situations. “We are getting better today at breaking down silos and allowing interaction through cross-functional team management. Management should evaluate themselves to determine if their management style is autocratic or team oriented” (O'neil, 1994).
1.2 Lean manufacturing
With publishing two well known books by Womack and his colleagues in the 1990’s, The Machine That Changed the World and Lean Thinking, lean manufacturing (LM) was known in North America. The main concept of LM is based on Toyota Production System (TPS) that founded by Taiichi Ohno, a former chairman of Toyota, in 1978. The basis of the TPS is waste elimination. Just In Time (JIT) and Autonomation (or automation with a human touch) are the two pillars needed to support the system (Liao, 2005). “All we are doing is looking at the time line from the moment the customer gives us an order to the point when we collect the cash. And we are reducing that time line by removing the non-value-added wastes”(Ohno, 1988).
Just In Time: JIT, the most substantial segment of the TPS, refers to a concept in which, the exact material or parts have to deliver to assemble line at the time they are needed and only in the amount needed (Ohno, 1988). Actually, this way of thinking will help a company to approach zero-inventory. This concept comprises continuous flow, takt time and the pull system (Koole, 2006). Takt time is calculated with dividing available working time in one shift (usually in minutes) by units of needed jobs per shift. For example if available working time is 505 minutes and the customer requires 100 units job per day, then the takt time will be 5.05 minutes per job. To Comparing to traditional production system, JIT is more capable to response to customer’s requirements. In this system, the manufacturing process changes to PULL system that means a product will be produced only when the customer ask for it. To simplify the process, we have to calculate the number of parts and the frequency of use in a specific time interval. However, the concept seems easy, but it is hard to implement. Enterprises which attempt to apply JIT in a short period probably will get fail. It can be implemented with no significant investment but all employees and managers must have commitment to it (Liao, 2005).
Regarding to origin of the LM and the given background, it is a concept about removing wastes in production system and making continuous improvements. “Lean production is “lean” because it uses less of everything compared with mass production – half the human effort in the factory, half the manufacturing space, half the investment in tools, half the engineering hours to develop a new product in half the time. Also, it requires keeping far less than half the needed inventory on site, results in many fewer defects, and produces a greater and ever growing variety of products” (James P Womack, Jones, & Roos, 1990). Lean manufacturing aims to produce quality products in the most efficient and economical way by decreasing human effort and inventory and also having on time delivery. LM centralizes on increasing output, planes to produce products and services with the lowest cost and highest pace (Rahman, Sharif, & Esa, 2013).
According to foundation of lean manufacturing, which has the same root with TPS, distinguishing between value and waste and then eliminating waste are the primary goals of this concept. “VALUE” is defined by end user and it is considered as everything that the customer has desire to pay for it and anything else is recognized as “WASTE”. All activities and action that are done within a production line or shop floor divide in to three groups. The first group is activities that add value to the production. Second group is activities that add no value to the production but they are necessary or unavoidable for production such as inspection. The last group is activities that do not add value and they are not necessary. The mission of the lean is to improve the first group, reduce the second one as much as possible and eliminate the last group of activities.
In definition of the activities, the second and third categories are defined as waste. In the theory of the lean thinking, there are three types of wastes: muda (waste), mura (unevenness) and muri (overdoing). Muda comprises two types. The second and third groups of activities, which have been defined before, are muda type I and muda type II respectively (Austin, 2013). Muda happens in seven forms (TIMWOOD):
2. Inventory: any kinds of raw material, work in progress (WIP) or finished goods which are surplus of what is required,
3. Movement: movement of personnel between the processes that does not add value to the product directly such as movements for adjustment,
4. Waiting: any stop (idle) time between two processes is waiting and considered as waste,
5. Overproduction: making more than what customer needs. This also causes waste in other areas at the same time,
6. Over processing: expending extra resources to produce products that do not have value from customer’s perspective
7. Defects: repeat production or processes because the product does not conform to customer’s requirement which leads to rework.
1.3 Lean principles
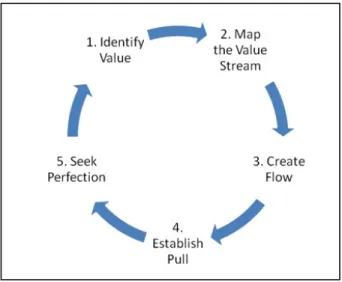
The structure of the lean thinking contains of five principles. All decisions made by managers have to conform to these elements in order to have a successful lean implementation in an enterprise. J.P. Womack et Jones (2010) describe the summary of these principles as follow: “precisely specify value by specific product, identify the value stream for each product, make value flow without interruptions, let the customer pull value from the producer, and pursue perfection. By clearly understanding these principles, and then tying them all together, managers can make full use of lean techniques and maintain a steady course”. In the remainder of this section, we explain each of these principles in more details.
1.3.1 Value
Value is the first and important point for lean thinking and it is always defined by customer. Value of a product or service is determined based on needs of customer at a specific price and specific time. Producers create the value and this is their reason for existence from the customer’s point of view (J.P. Womack & Jones, 2010). It is critical to recognize value from
client’s standpoint and not from producer’s perspective. Some manufacturers set their processes without considering what their customers really want to pay for. This only leads to produce wastes in long term. Once the value is identified, managers can distinguish between value-added and non-value-added activities. Value-added activities are those which turning the raw material in a way that contribute to the end user. Activities else than this are all wastes or muda (Austin, 2013).
1.3.2 Value stream
To understand strengths and weaknesses of a production line or a given service, we need to have a clear outline of all ongoing activities within the firm. Value stream comprises all required activities and events to bring a specific product (a good, a service or both of them) through the following three important business tasks:
• Problem-solving task: running from concept through detailed design and engineering to launch of the production,
• Information management task: the process from placing an order to detailed time plan for delivery,
• Physical transformation task: the process from transforming raw material to a finished product in the hands of the customer.
The next step is to analyze the entire value stream for each product or product family. However, most firms neglect to do value stream analysis, it reveals remarkable amount of wastes within processes (J.P. Womack & Jones, 2010). With aid of value stream analysis three groups of activities, which has been discussed before, are identified and decisions for improving, re-engineering and eliminating of these activities are made. Value Stream Mapping (VSM) is a simple but very useful tool of lean which give a transparent vision to the managers about what is going on the shop floor. VSM will be explained in more detail in lean tools section.
1.3.3 Flow
When value stream has been well identified and non-value-added activities and wastes have been eliminated from the production process, now it is time for the next breathtaking step in lean thinking: Make the remaining, value-creating steps flow (J.P. Womack & Jones, 2010). In other words, the production process from the moment that client put order to the time that the product is received, should flow without any stoppage. If this process is interrupted by any reason such as machine downtime, waiting as inventory and rework because of defects, it is considered as waste and should be eliminated (Austin, 2013). Flow is defined as a value-creating step. Resource and information flow are the two areas that get more impact from flow process. It is a great challenge in field of lean management to make the process to flow smoothly and requires rearrangement of thinking way, great efforts and persistence (Ramalingam, 2008). “One piece flow” production versus “batch” or “mass” production has several essential superiors that the most important of them are process time reduction, lower idle time, preventing overproduction, faster detection of defects and ultimately higher efficiency.
1.3.4 Pull
Significantly reducing the time required going from concept to launch, sale to delivery and raw material to the customer is the first sensible effect of transforming from departments and batches to product teams and flow. This will lead to save a remarkable amount of time in production development, order processing and physical production (J.P. Womack & Jones, 2010). In the next move by following pull production system, producer makes what the customer wants at the right time and as much as needed. With this policy there is no need to sales or production foresight. In other words, in this case the customers pull the product from manufacturer or producer as needed rather than pushing onto client. By applying this procedure, beside than preventing from overproduction, the demands of customers become much more stable because they realize that it is possible for them to have what they want
right away and also producers do not conduct rebate events to sale unwanted goods (J.P. Womack & Jones, 2010).
1.3.5 Perfection
When in a company value is specified, value stream is identified, production processes flow smoothly and customer is able to pull product from the company, lean thinking is running in that firm by previous four principles. The last principle of lean thinking, perfection, is about to continuously maintaining all these improvements. As it is show in figure 1.1 all these principles interact with each other in a virtuous circle. It means that effort for reducing time, cost, space and mistakes while producing a product that conforms to customer’s requirements, is an endless process. Getting value to flow faster makes wastes detectable in the value stream and the harder you pull, the more flow obstacles are identified so they can be eliminated (J.P. Womack & Jones, 2010).
Figure 1.3 Principles of lean3
1.4 Lean Tools
There are numerous tools within lean context to implement its principles and conduct projects through the lean thinking. The aim of these tools is based on lean’s philosophy which is identifying and eliminating wastes and implementing continuous improvements. In this section we will explain some of these tools which are related to this thesis in more details.
1.4.1 Value Stream Mapping (VSM)
As it is mentioned before, once the value is defined by customer it is time to identify value stream that demonstrates which activities are VA and which are not. The classifications of these activities help us to detect mudas in production processes and get ready to remove them. Value stream mapping (VSM) which first developed by TPS, is a simple but very powerful and useful tool in lean’s toolbox in order to realize and visualize value and flow in the processes. This pencil and paper tool presents essential data about material and information flow within manufacturing processes by depicting a holistic blueprint of all ongoing activities, either VA or NVA, which are needed to produce a final product from raw material and deliver it to the customer. This final product can be a good or service. The goal of value stream map is to reduce wastes in production line as much as possible. These wastes prevent the constant move of material and information (Behnam, Ayough, & Mirghaderi, 2018).
VSM as a process mapping tool, is capable of showing both process flow and communication within the process or value stream and also gathering, analysing and presenting information in a very condensed time period. Therefore, this method reached to acceptance in field of continuous improvement rapidly. Furthermore, VSM is a tool that every stakeholder from the management to the newest entry-level employee can understand it and visualize the process. Normally two kinds of VSM are developed in a company: 1) Current State Map: that is about existing and ongoing process from which all improvements are measured, 2) Future
State Map: shows the state of value stream after improvement implementation (Nash & Poling, 2011).
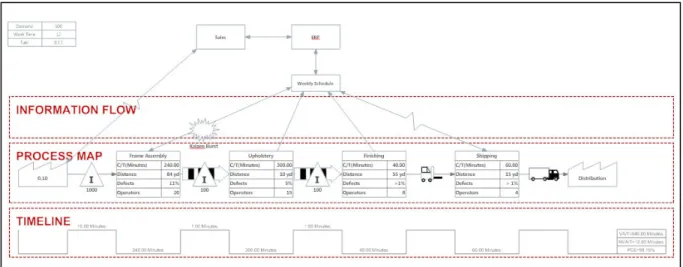
We can see in figure 1.2 that normally each VSM has three major parts. To create an effective value stream map, it is important to support these parts with enough details that make VSM clear and understandable for any audience (Nash & Poling, 2011).
Figure 1.4 VSM components4
Process or production flow: this section is always drawn from left to right. To develop this part, the material flow of the product is traced from getting the raw to storing the final product which is ready to deliver it to the customer. Process flow also provides data about operation such as current schedule, number of operators and the amount of inventory in various queues (Irani & Zhou, 2011). By looking to the process as a whole, we can discuss about problems and opportunities exist in the current state map that enable us to find solutions, eliminating wastes and improve process (Nash & Poling, 2011).
Communication or information flow: this part of VSM is drawn from right to left or from the customer back to the supplier. The top portion of VSM makes it possible to see all of communication, formal and informal, that exist within a value stream. NVA communication
can be detected through information flow (Nash & Poling, 2011). This section provides important information for determining the pacemaker process in the manufacturing system or production line for which the current state map is being developed (Irani & Zhou, 2011).
Timelines and travel distances: after process and information flow have been mapped, a timeline at the bottom of the map represents the processing time for each operation and the transfer delay between operations. It shows the VA and NVA steps in value stream (Irani & Zhou, 2011). Timeline has two parts. The top line measures the process lead time which demonstrates how long it will take on average to move all the existing material or work through to completion. Lead time typically is measured by number of days. The bottom line is showing total cycle time which observed at each process step and documented beneath each process box on the map is brought to the lower line (Nash & Poling, 2011). By an initial comparing between lead time and cycle time we can recognize waste and NVA activities. Some maps also have another line under the timeline that represents the travel distance of the people moving physically within the process (Nash & Poling, 2011).
To conduct a future VSM, with consideration of current state map we plan to eliminate waste and implement continuous improvements. We suppose ideal conditions and try to approach to that as much as possible. VSM helps us to identify areas which need reformation and provide essential information for other continuous improvement tools like Kanban, Kaizen and 5S.
1.4.2 Kanban
“Kanban” is a Japanese word composed of two parts. “KAN” which means visual and “BAN” means card. As its meaning implies, basically it is a signalling system for inventory management. Kanban was first developed by Toyota and it is based on pull system (Ramasahayam, 2016). In other words, in this system customer is pulling the part from the supplier of that part. The customer can be an actual consumer of a finished product (external) or the production personnel at the next station in the manufacturing facility (internal) which
in this case the supplier can be the personnel in at the preceding station (Rahman et al., 2013). This tool enables companies to benefit from JIT production properly in order to control the flow of work-in-process (WIP) and inventory which leads to preventing overhead production and cost reduction (Skaf, 2007). LM wants to reach high output or service demands with less inventory. In this way Kanban acts as a tool to control the levels of buffer inventories in the system to regulate production quantities. When a buffer reaches its preset maximum level, the upstream machine is signalling to stop producing that particular part type. Therefore, Kanban within manufacturing are signals used to replenish the inventory of items used repetitively within a facility (Rahman et al., 2013).
Normally, a traditionally Kanban system consists of cards with information required to move parts between preceding and succeeding processes. This system can be divided in to two types: withdrawal (pull) Kanban and production Kanban. Cards for the first one allow the movement of parts between operations and for the second one authorize the manufacturing of parts in the quantities indicated. The benefits of implementing Kanban system are (Lin, Chen, & Chen, 2013):
• Reduce inventory holding, • Better material flow, • Prevent overproduction,
• Ensure control at the material handling level,
• Develops visual scheduling and process management, • Increase response to market,
• Minimize obsolete inventory, • Improve supply chain management
Within Kanban discipline the assumption is that material will not be produced or moved unless a signal is received from the customer’s side. It is a method to achieve effective production operation and there are few determinants in order to set it up. Four factors should be considered to ensure the successful Kanban implementation:
Inventory management: without this factor a company cannot attain a low-cost strategy. There are four types of inventory: raw material, WIP, finished goods and maintenance, repair, operating. Inventory involves with storage and holding costs and space in manufacturing plant. Hence, its management is important and complicated in an organization (Rahman et al., 2013).
Supplier participation: Within Kanban method, we need minimum level of inventories in production line where the inventories number and the production numbers should be the same. In order to have an efficient and smooth production line, supplier should have full commitment to provide raw materials. Five criteria for choosing supplier are quality, willingness to work together, technical competence, geography and price (Rahman et al., 2013).
Quality improvement and quality control: Besides decreasing cost with having fewer inventories, Kanban also helps company to control and maintain quality improvements of the output. JIT is one the elements constituted in Total Quality Management (TQM). All parts should have acceptable level of quality before going to the next step or delivering to the customer. For sure, improved processes lead to high quality, high quality creates credit for the producers, customer used to high quality product and ultimately high quality reduces costs such as prevention, appraisal and failure costs. Before, quality was considered as cost and traditional companies believe defects are caused by workers and the minimum level of quality that can satisfy the customer is enough. But, within Kanban concept quality leads to lower cost, that system caused most defects, and that quality can be improved with aid of Kaizen (Rahman et al., 2013).
Employee participation and top management commitment: To have a useful solidarity and meet the goals in a company, commitment and good agreement between employees and management are the essential factors. In today’s work environment this has been become as a culture. All employees should be concerned, participative and have sense of responsibility to
successfully deployment of new system and prosperity of organization in the future (Rahman et al., 2013).
1.4.3 Kaizen
“Kaizen” and “Continuous Improvement” (CI) are the concepts which always come along together. CI refers to unending effort for improvement including all people in the organization and is an important factor to develop advance production procedure in today’s competitive environment (Singh & Singh, 2009). Kaizen is another Japanese term and also philosophy with the meaning of betterment or improvement.VSM is a tool which shows you where you are and where you are going but without specifying how. The answer to this question that how we can improve the value stream, is Kaizen. Like any other items in lean’s toolbox, the goal of Kaizen is to eliminate waste in the system (Sayer & Williams, 2012). Since every activity and product is able to be improved, the umbrella of Kaizen covers many of management techniques such as JIT, Kanban, total quality control and etc. The philosophy of Kaizen is that continuing effort results small improvements. It cultivates process-oriented thinking because in order to gain improved results, it is needed to improve processes. This may be opposite of the manner of the most Western managers which is result-oriented. Standardization is an important trait of Kaizen. Standards mean set of policies, rules, directives and procedures defined by management for all major operations as guidelines that enable all employees to perform their jobs successfully. If people are unable to follow established rules, it is the management responsibility to train employees or review and revise them. Once the standards were implemented, they have to be maintained and then try to improve them (Wittenberg, 1994).
Kaizen is people-oriented as well. “Of course results count, but kaizen assumes that improvements in people’s attitudes and efforts are more likely to produce improved results in the long run than mere result-oriented thinking would do” (Wittenberg, 1994). Kaizen includes everyone in an organization from top management to workers and operators. It is a regular and daily activity that focuses on humanizing the workplace and eliminating hard
work. In this regards, people must be respected in the system. They are not only shouldn’t be blamed or judged for the past mistakes, but also encouraged to share their suggestions for improvements. Kaizen requires everyone’s cooperation and in management level roles are different. Defining directions of Kaizen for the company, setting goals and creating the culture in which kaizen can thrive have to be done by senior managers. In addition to provide required resources, they ensure that the direction of improvement continues to improve customer value and improves the business in the direction of ideal state. At the second level, middle managers ensure that the employees have requirements like skills, materials and tools to perform Kaizen. The execution of the Kaizen from guide and teach to its implantation is also their responsibility. At the last level, supervisors check if Kaizen is happening on both individual and workgroup step and make sure that everybody is following standards. It is important to be noted that managers show their leadership by practicing Kaizen themselves (Sayer & Williams, 2012).
Until now it can be concluded that Kaizen starts with people and attends to their efforts. Work of people on processes results their continuous improvement and gaining better results. The ultimate benefit of these endeavours is customer’s satisfaction (Wittenberg, 1994). Wittenberg (1994) presents ten essential rules to practice Kaizen in the shop floor:
1. Quit from traditional production methods;
2. Instead of looking for the reason of why it cannot be done, think about how to do it;
3. Do not make excuses. Start by questioning current practice;
4. Do not look for getting complete success. Do it immediately even to get half of results;
5. Correct mistakes at once;
6. Do not spend money for Kaizen; 7. Difficulty leads to emerge of intellect;
8. Ask “Why’ five times to reach to the root causes;
9. Wisdom of the group of people works better than knowledge of one; 10. Kaizen is an endless effort.
1.4.4 5S
In organizations, specially manufacturing sector, the places where the work is created must be in order, neat and clean. Having such environment will bring several benefits for the business. The first one is that it causes smoother flow in the shop floor. Flow is a vital segment of any production line. If it has obstacles or be interrupted it will impact other factors such as cycle time and lead time. Organized workplace will also improve the mentality of the operators and enhances their confidence and this will increase the quality of the products. Another advantage of working in a tidy place is its safety. In addition, it is hard to identify defects and mistakes in welter position. Therefore, in ordered place we can find and rectify issues easier and faster. When the significance of being regular in work stations was determined, it is time to apply applicable drills to move toward this target.
5S is one the most useful methods in lean manufacturing to organize work stations and implement continuous improvements (CI) in shop floor. The term and method is originated from Japan in the mid 1950s and it is the short form of five Japanese words which stands for Seiri (Sort), Seiton (Straighten), Seiso (Shine), Seiketsu (Systematize) and Shitsuke (Sustain). In some literatures another S has been added to this list which is for ‘Safety’. 5S is the first step to apply CI and ensure it in housekeeping and results in better environment and safety standards (Gupta & Jain, 2014). Like any others lean tools, the ultimate goal of 5S is also removing wastes from the system. Discarding junks and individual cleaning responsibility are some of typical 5S activities which everyone should does in order to have a total-quality work environment. Since these activities seem simple, people do not pay enough attention to them but with presence of 5S functionality in a facility, out of place or missing items or tools stand out and time spent for searching for them gets essentially eliminated (Chitre, 2010). Implementation of 5S has two phases. The first one is throwing out all junk and do not work around it and the second one is creating a system in which everything has its place. Fundamental to these two phases is ensuring the safety of the people through effective layout and design. An important matter before applying 5S is determining the bounds of area
it is going to be used. Addressing the entire facility at once may overwhelm people and creates this risk that items are not really removed, but just are shuffled around (Sayer & Williams, 2012).
Sort: The first step of the 5S is about discerning between what we need and what we do not in work place and then just keep those we need. To decide how essential the things in the work place are, any production team have to know about their product, customer and customer’s requirements. In other words, they have to identify value-added activities and only keep those tools which are needed to accomplish these activities and remove the surplus ones. This is more than just a cleaning process. Actually, it is an opportunity for all departments to re-evaluate the tools at their disposal to ensure they are using the best available tools for their process (Chitre, 2010).
An effective procedure to sort items in work place is dividing them into three R categories (3R technique):
• Retain: Retain needed items to perform VA activities. These items are divided into two groups: regular use and occasional use;
• Return: Return any items which do not belong to you to their source place.
• Rid: Rid the area of all other items. Physically move them directly to the recycle bin or dumpster for disposal. If it cannot be decided to throw out an item or not, dedicate an area in the shop floor and dispose these items there.
In the Rid stage, before transferring items to dedicated area, attaching a red tag on each item with information about its disposition can be very useful. This tag includes information such as date it was moved to the area, the place it came from, the person who moved it, the desired disposition and the functions that need to sign off on the disposal. Items which remain in red tag area more than one week and in this period nobody uses them should be discarded forever. This technique also can be applied to digital information by deleting duplicate or obsolete email messages or data in folders (Sayer & Williams, 2012).
Straighten: Once the sorting operation, the first phase of 5S, was done successfully, the next S in 5S is the beginning of the second phase. It is needed to find a place for everything and put everything in its place. Items that are always needed have to be moved to places where they have to be (Sayer & Williams, 2012). The benefit of performing this stage is that tools which are needed to do a job will be accessible easily and this will reduce cycle time in each process. Creating current and future VSM is a helpful method to recognize material position and plan on how things can be re-arranged to make the movement more effective and efficient (Chitre, 2010). Activities which can be done to straighten items are (Chitre (2010), Sayer et Williams (2012), Gupta et Jain (2014)):
• Labelling: Put label on everything with definite color, name and number to easily find them;
• Painting floors: Draw borders to distinguish different work areas;
• Creating standards for the colors: For example indicate aisles in the facility by yellow, safety stations by green, dangerous areas by red and so on;
• Dedicating place for items: Use rack, shelf and shadow boards to store tools
Shine: In this step it is assumed that unwanted and waste items have been removed completely and everything is in its place. Now everybody has to do deep cleaning in his or her area. This means thoroughly scrub everywhere including checking and fixing equipment if they have leakage or need paint and eliminate the root cause of problems. It is important that this phase is done by team members who are focused on interpreting information that the cleaning process is generating not by an outside contractor because there is probability to lose those information. People have to do shining as a habit and daily activity and it should be audited by a specified team. Because less waste results in more revenue and this is one of the most difficult and critical accomplishment in an organization (Chitre, 2010). Employees have to do cleanliness automatically. This process can be more effective if it is done zone wise and workers follow specific standards to perform it (Gupta & Jain, 2014). Sayer et Williams (2012) present following as the reasons of the importance of this step:
• People working in a tidy place have better moral and are more productive; • Cleanliness results in having clean mindset;
• Clean equipment helps to recognize defects with them easier; • Clean and clear areas help to create safer work environment.
Systematize: By performing the first three S’s the entire area got clean one time. With establishing schedule and systems the gains from previous steps will be become as a contract and team members work in the new way of working without expectation. It is important to prevent procedures from breaking down. Because this helps to reinforce drills that will be key in driving improvements in the future (Chitre, 2010). Employees’ have remarkable role in developing standards. They know their responsibilities and do them in a regular routine. Best work practices are performed and various ways are find out to make sure that everyone is doing his or her activity in work station (Gupta & Jain, 2014). The points which can help to better systematize the process are as follow (Chitre, 2010):
• Document the gains from the first three steps and make them part of the daily routine;
• Apply visual aids and visual management such as shadow boards, labelled shelving, tagged bins and so on to reveal irregularities;
• Schedule 5S activities as often as possible;
• Set a 5S contract or agreement with mentioning roles and responsibilities before starting the implementation of the program.
Sustain: This is the toughest part of the 5S process to implement. Because we have to turn a one-time event and new practices into the way we conduct business (Sayer & Williams, 2012). Since it is hard to change long standing procedures and behaviours, there is a risk to go back to old fashion. The last S involves making 5S concept as the way of life in an organization and personal discipline to follow agreed upon new standards. Many companies fail to perform this final step even if they successfully completed the first four ones. The