Measuring the Sustainability of Cities: A Survey-Based Analysis of the Use of Local Indicators
32
0
0
Texte intégral
(2) CIRANO Le CIRANO est un organisme sans but lucratif constitué en vertu de la Loi des compagnies du Québec. Le financement de son infrastructure et de ses activités de recherche provient des cotisations de ses organisations-membres, d’une subvention d’infrastructure du Ministère du Développement économique et régional et de la Recherche, de même que des subventions et mandats obtenus par ses équipes de recherche. CIRANO is a private non-profit organization incorporated under the Québec Companies Act. Its infrastructure and research activities are funded through fees paid by member organizations, an infrastructure grant from the Ministère du Développement économique et régional et de la Recherche, and grants and research mandates obtained by its research teams. Les partenaires du CIRANO Partenaire majeur Ministère du Développement économique, de l’Innovation et de l’Exportation Partenaires corporatifs Banque de développement du Canada Banque du Canada Banque Laurentienne du Canada Banque Nationale du Canada Banque Royale du Canada Banque Scotia Bell Canada BMO Groupe financier Caisse de dépôt et placement du Québec DMR Fédération des caisses Desjardins du Québec Gaz de France Gaz Métro Hydro-Québec Industrie Canada Investissements PSP Ministère des Finances du Québec Power Corporation du Canada Raymond Chabot Grant Thornton Rio Tinto Alcan State Street Global Advisors Transat A.T. Ville de Montréal Partenaires universitaires École Polytechnique de Montréal HEC Montréal McGill University Université Concordia Université de Montréal Université de Sherbrooke Université du Québec Université du Québec à Montréal Université Laval Le CIRANO collabore avec de nombreux centres et chaires de recherche universitaires dont on peut consulter la liste sur son site web. Les cahiers de la série scientifique (CS) visent à rendre accessibles des résultats de recherche effectuée au CIRANO afin de susciter échanges et commentaires. Ces cahiers sont écrits dans le style des publications scientifiques. Les idées et les opinions émises sont sous l’unique responsabilité des auteurs et ne représentent pas nécessairement les positions du CIRANO ou de ses partenaires. This paper presents research carried out at CIRANO and aims at encouraging discussion and comment. The observations and viewpoints expressed are the sole responsibility of the authors. They do not necessarily represent positions of CIRANO or its partners.. ISSN 1198-8177. Partenaire financier.
(3) Measuring the Sustainability of Cities: A Survey-Based Analysis of the Use of Local Indicators Georges A. Tanguay*, Juste Rajaonson†, Jean-François Lefebvre‡, Paul Lanoie§ Résumé / Abstract Nous analysons 17 études traitant de l’utilisation d’indicateurs de développement durable (IDD) en milieu urbain pour différents pays, provinces ou états occidentaux. 188 IDD différents sont recensés dans ces études dont 135 (72 %) ne sont utilisés qu’une ou deux fois. L’analyse de ces études révèle ainsi un faible consensus non seulement au niveau du cadre conceptuel ou de l’approche préconisée, mais aussi en ce qui concerne la sélection et le nombre d’indicateurs optimal. Premièrement, différents classements et catégorisations des IDD recensés nous permettent d’observer et d’identifier les problèmes inhérents aux pratiques territoriales ayant recours aux IDD. Deuxièmement, nous argumentons que l’absence de consensus à plusieurs étapes de la création des IDD émergent entre autres de l’ambiguïté occasionnée par la définition du développement durable, des objectifs visées par l’utilisation de tels indicateurs, de la méthode de sélection préconisée et de l’accessibilité des données qualitatives et quantitatives en cette matière. Troisièmement, nous proposons une stratégie de sélection des IDD (que nous appelons SuBSeleC) où nous démontrons la nécessité d’adoption d’une liste parcimonieuse d’IDD couvrant le plus largement possible les volets du développement durable et des catégories qui les composent tout en minimisant le nombre d’indicateurs retenus. Le résultat est une liste concise et moins redondante d’indicateurs moins sectoriels et plus intégrateurs ayant l’avantage d’englober les dimensions intégrées du développement durable. Mots clés : Villes, indicateurs, développement durable, environnement, gouvernance locale.. We analyze 17 studies of the use of sustainable development indicators (SDI) in an urban setting. The analysis reveals a lack of consensus not only on the conceptual framework and the approach favored, but also on the selection and optimal number of indicators. First, by performing different classifications and categorizations of SDI we identify problems inherent in territorial practices that use SDI. Second, we argue that the lack of consensus in several steps of the creation of SDI stems notably from the ambiguity in the definitions of sustainable development, objectives for the use of such indicators, the selection method and the accessibility of qualitative and quantitative data. Third, we propose a selection strategy for SDI through which we demonstrate the need to adopt a parsimonious list of SDI covering the sustainable development components and their constituent categories as broadly as possible while minimizing the number of indicators retained. Keywords: Cities, Indicators, Sustainable Development, Environment, Local Governance. *. Université du Québec à Montréal and CIRANO email: tanguay.georges@uqam.ca. Université du Québec à Montréal. ‡ Université du Québec à Montréal. § HEC-Montréal and CIRANO. †.
(4) 1. INTRODUCTION The World Commission on Environment and Development (1987) proposed the most consensual definition of sustainable development to date: “Sustainable development is development that meets the needs of the present without compromising the ability of future generations to meet their own needs.” More specifically, as specified in the Brundtland report (WCED, 1987) the concept of sustainable development comprises three aspects: economic, social and environmental.1 In addition, for development of a given territory to be considered sustainable, it must integrate the qualities associated with interactions and overlapping of these dimensions. Accordingly, development must be equitable (interaction between the economic and social dimension), livable (correspondence of the environment to social needs, which can refer to the concept of quality of life) and viable (economic development must abide by the supportive capacity of the ecosystems, and depletion of nonrenewable resources must be avoided). These dimensions are represented in Figure 1.. Figure 1. Classic Dimensions of Sustainable Development. Environmental. Viable. Livable. Sustainable. Social. Equitable. Economic. If the concept of sustainable development was initially directed at nations through Agenda 21 resulting from the 1992 Rio Summit, a growing number of experts recognize that it is at the local scale, i.e. at the level of municipalities, cities or metropolitan regions, that the challenges 1. Recently, a fourth dimension has been added: the institutional dimension of development. To simplify the presentation, we limit the analysis to the three original dimensions of sustainable development. We thus integrate the subcategories of the institutional component in the social dimension..
(5) are best expressed and that actors must be mobilized (Camagni, 2002). In this sense, Article 28 of Agenda 21, which recognizes the importance of actions at the local scale, lead to the creation of Local Agenda 21 adopted by several thousand municipalities around the world (UNCSD, 2002). Sustainable development indicators (SDI) thus appear to be a means increasingly used by public administrations to underpin their sustainable development strategies, notably by allowing tangible assessment and monitoring systems. Despite their popularity, the use of SDI remains problematic in that the absence of a less general and more universal definition of sustainable development has given rise to multiple interpretations and in particular has triggered an explosion of indicators. In this article we demonstrate the lack of consensus in the evaluation tools related to sustainable development through an analysis of the most common applications based on a review of experiences in several western countries, provinces and states. In addition, we propose a strategy to maximize coverage of the dimensions of sustainable development while minimizing the number of indicators for communication and practical purposes. In the second section we describe the indicators and indices of sustainable development, along with the related basic concepts. In the third section we present the 17 studies from which we extracted the 188 SDI and interpret the classifications and categorizations of these indicators. In the following section we perform a more detailed empirical analysis of the SDI compiled and argue that the lack of consensus arises from the definition of sustainable development, the objectives set, the classification method favored and constraints related to the use or accessibility of qualitative and quantitative data on indicators. In the fifth section we develop a strategy for selecting SDI based on a review of previous studies. We underline the need to adopt a parsimonious list of SDI that covers the components of sustainable development and their constituent categories as broadly as possible while minimizing the number of indicators retained. The conclusion follows.. 2. INDICATORS AND INDICES: BASIC CONCEPTS This study investigates indicators of sustainable development in general rather than problems related to their aggregation, weighting, etc. However, for simplification purposes, before beginning the analysis of the studies inventoried, we present some basic concepts related to sustainable development measures (e.g. indicators). First we differentiate indicators from. 2.
(6) indices. We then briefly discuss important concepts that underlie the construction of indicators and indices: aggregation, weighting, thresholds and target values. 2.1. Indicators vs Indices. Indicators First, it is important to clarify the nuance between indicators and data or variables observed. A datum or variable observed becomes an indicator only once its role in the evaluation of a phenomenon has been established. For example, the number of unemployed is a datum or key variable in economics. Once it is determined that an increase in the number of unemployed expresses negative economic performance for a given territory, this number becomes an indicator.. The datum or variable pertaining to the number of unemployed can then be. standardized, transformed or formulated in any way (e.g. rate, level) that can account for economic performance.. Indices An index (or composite indicator) is a synthesis of indicators. Formalization of an indicator that necessitates the aggregation of several data or variables results in an index. The use of indices in the field of sustainable development facilitates the understanding and interpretation of indicators of a given phenomenon, particularly for the public. To illustrate, we consider the human development index (HDI) created by the UNDP in 1990 that clearly conveys the nuance between an index and an indicator. The HDI consists of three indices (longevity, level of education and standard of living). Each index synthesizes a set of indicators. For example, the level of education index is a synthesis of the indicators “gross literacy rate” and “gross education rate.” The index is then calculated based on an aggregation method. 2.2. Aggregation, Weighting, Critical Values and Thresholds. Aggregation Aggregation can be spatial (e.g. progression from a regional spatial scale to a provincial scale), temporal (e.g. from a monthly interval to an annual interval) and thematic. The first two aggregation modes apply to a given variable that is compared over time or between territories with the same administrative status. In contrast, thematic aggregation groups a set of indicators. 3.
(7) according to different themes, and is used to produce indices. The aggregation method of indicators selected determines the conceptual framework used. This framework refers to a method or set of organization methods intended to design and structure a vision of sustainable development (e.g. organization into three dimensions of sustainable development: environment, economy and society).. Weighting Weighting entails attributing a greater value or contribution to one indicator or index than another. This approach has drawn much criticism (Perret, 2002 and Martinez-Alier et al., 1998) because it is an arbitrary process and no weighting structure can rationally justify the attribution of a greater weight to a given indicator. Nonetheless, Callon (2001) suggests that any attempt to weight sustainable development indicators take public participation in decision-making processes into account.. Threshold, Critical Value, Target Value, Relative Performance The concept of threshold refers to a scientifically demonstrated reference value which causes the phenomenon described to change status and present notable discontinuities and structural changes or irreversibilities. It applies mainly to environmental challenges (e.g. water pollution, soil contamination and air pollution) The critical value corresponds to a recognized, generally arbitrary, reference value derived from standards. It takes into account uncertainties and individual and/or group interests. For example, the figure of 30% of income allotted to housing is often considered a critical value to determine whether a household falls below the poverty level. The concept of target value allows objectives to be set while measuring efforts and associated costs (economic, social and political). The relative performance of a given territory refers to the reference values based on other territories of the same stature. These benchmarks are consequently used to construct statistical distances relative to the best and the worst performers. Relative performance is generally used in cases where indicators and indices have no scientifically established thresholds or consensual critical values. Thresholds are then determined based on the experience of other territories. As mentioned above, in this study we concentrate on the indicators themselves rather than on questions related to their aggregation, weighting etc. The studies retained therefore serve to. 4.
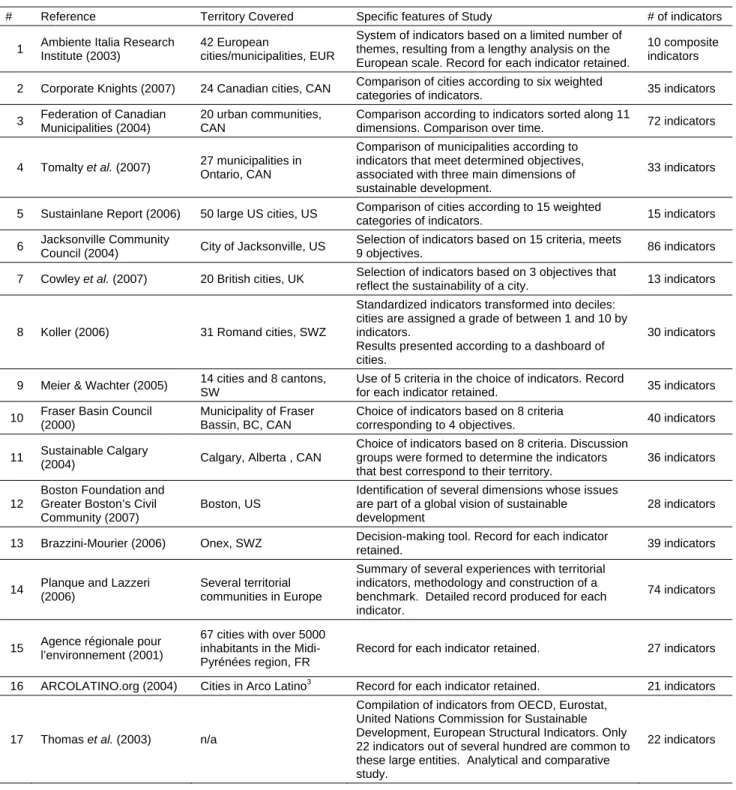
(8) demonstrate how indicators are chosen based on a broader analysis, e.g. based on an index. In the following section we present the studies analyzed.. 3. DESCRIPTION OF SURVEYED STUDIES We initially compiled a sample of 23 studies that apply indicators related to sustainable development to one or more cities or urban centers. Our goal was to cover a broad array of western countries, provinces and states. We subsequently decided to limit our analysis to studies specifically covering urban indicators of sustainable development. Of the 23 initial studies, three were specific to the field of transport, whereas three others had a limited range of indicators intended strictly to measure quality of life.2 The final sample therefore consisted of 17 studies, covering the US, Canada and Europe. The main characteristics of the studies are described in Table 1, which yields two main findings. First, the 17 studies use between 10 and 86 SDI, which reveals a lack of consensus on the optimal number of indicators. In addition, studies involving a larger number of cities use fewer SDI. In the next section we will examine the factors that explain the variation in the number and choice of indicators. From the 17 studies examined, we compiled 188 indicators. Because an indicator can be described or measured in different ways (e.g. atmospheric pollutants by toxicity, quantity emitted or CO2 content), we ensured that the descriptions and units of measurement used allowed the definition of clear and distinct indicators. Indicators such as the average household income or the percentage of low income households thus represent different ways of characterizing household income for a given territory, and are considered as distinct indicators in our survey.. 2. In fact, five studies addressed the concept of quality of life. However, only two of these studies used a sufficiently broad range of indicators to be considered as SDI. We therefore retained these two studies for this exercise, given our goal of comparing studies with similar objectives .. 5.
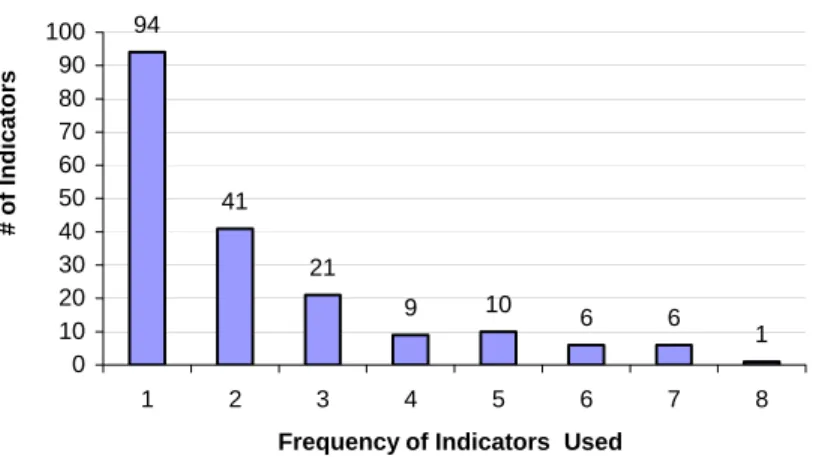
(9) Table 1 #. Summary of the 17 Studies. Reference. Territory Covered. Specific features of Study. # of indicators. 1. Ambiente Italia Research Institute (2003). 42 European cities/municipalities, EUR. System of indicators based on a limited number of themes, resulting from a lengthy analysis on the European scale. Record for each indicator retained.. 10 composite indicators. 2. Corporate Knights (2007). 24 Canadian cities, CAN. Comparison of cities according to six weighted categories of indicators.. 35 indicators. 3. Federation of Canadian Municipalities (2004). 20 urban communities, CAN. Comparison according to indicators sorted along 11 dimensions. Comparison over time.. 72 indicators. 4. Tomalty et al. (2007). 27 municipalities in Ontario, CAN. Comparison of municipalities according to indicators that meet determined objectives, associated with three main dimensions of sustainable development.. 33 indicators. 5. Sustainlane Report (2006). 50 large US cities, US. Comparison of cities according to 15 weighted categories of indicators.. 15 indicators. 6. Jacksonville Community Council (2004). City of Jacksonville, US. Selection of indicators based on 15 criteria, meets 9 objectives.. 86 indicators. 7. Cowley et al. (2007). 20 British cities, UK. Selection of indicators based on 3 objectives that reflect the sustainability of a city.. 13 indicators. 30 indicators. 8. Koller (2006). 31 Romand cities, SWZ. Standardized indicators transformed into deciles: cities are assigned a grade of between 1 and 10 by indicators. Results presented according to a dashboard of cities.. 9. Meier & Wachter (2005). 14 cities and 8 cantons, SW. Use of 5 criteria in the choice of indicators. Record for each indicator retained.. 35 indicators. 10. Fraser Basin Council (2000). Municipality of Fraser Bassin, BC, CAN. Choice of indicators based on 8 criteria corresponding to 4 objectives.. 40 indicators. 11. Sustainable Calgary (2004). Calgary, Alberta , CAN. Choice of indicators based on 8 criteria. Discussion groups were formed to determine the indicators that best correspond to their territory.. 36 indicators. 12. Boston Foundation and Greater Boston’s Civil Community (2007). Boston, US. Identification of several dimensions whose issues are part of a global vision of sustainable development. 28 indicators. 13. Brazzini-Mourier (2006). Onex, SWZ. Decision-making tool. Record for each indicator retained.. 39 indicators. 14. Planque and Lazzeri (2006). Several territorial communities in Europe. Summary of several experiences with territorial indicators, methodology and construction of a benchmark. Detailed record produced for each indicator.. 74 indicators. 15. Agence régionale pour l’environnement (2001). 67 cities with over 5000 inhabitants in the MidiPyrénées region, FR. Record for each indicator retained.. 27 indicators. 16. ARCOLATINO.org (2004). Cities in Arco Latino. Record for each indicator retained.. 21 indicators. Compilation of indicators from OECD, Eurostat, United Nations Commission for Sustainable Development, European Structural Indicators. Only 22 indicators out of several hundred are common to these large entities. Analytical and comparative study.. 22 indicators. 17. Thomas et al. (2003). n/a. 3. In addition, we observed the frequency of use of the 188 indicators noted. In total, 72% of the indicators apply to only one or two studies. Very few indicators are found in more than five. 3. Arco Latino is an association of regional and departmental communities corresponding to islands, coastal and inland regions in the Western Mediterranean (Portugal, Spain, France and Italy).. 6.
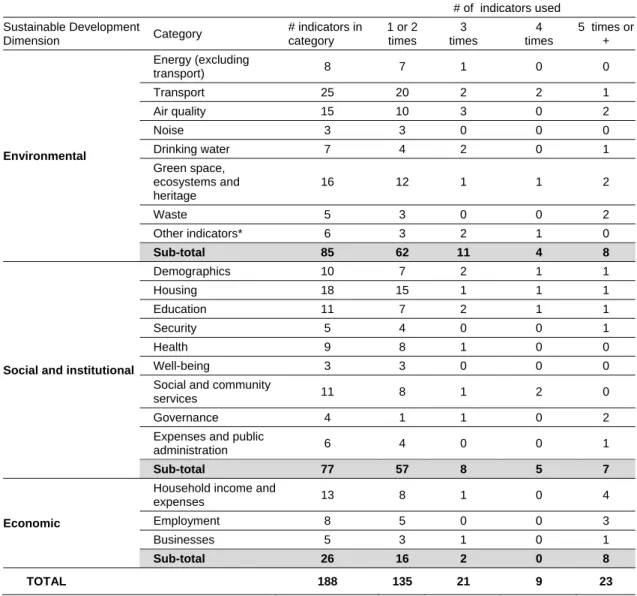
(10) studies. The results are shown in Figure 2. These trends clearly reveal the lack of consensus on SDI, a phenomenon that is even more striking given that the 17 studies retained cover cities or urban centers of western countries that share many of the same values and characteristics. .. # of Indicators. Figure 2 Frequency of Use of the 188 Indicators 100 90 80 70 60 50 40 30 20 10 0. 94. 41 21 9. 1. 2. 3. 4. 10. 5. 6. 6. 6. 7. 1 8. Frequency of Indicators Used. In the third step, indicators were grouped according to the three classic components of sustainable development: economic, environmental and social, consistent with the classifications common to the 17 studies.4 Fourth, following this initial classification, 20 categories were formed in order to better structure the indicators within each component. We attempted to remain as faithful as possible to the classifications and categories suggested by most of the 17 studies. For example, the transport category includes all indicators related to transport in the environmental component. Similarly, the education category was assigned to the social component in order to group indicators that evaluate state, supply and demand in the field of education. The frequency of use of each indicator was then calculated for each component and category. The results are shown in Table 2. It is easily apparent that the environmental component is characterized by a large variety of indicators–-hence a lesser consensus--whereas the social, economic and institutional components comprise indicators that are more consensual and therefore more frequently used.. 4. As mentioned earlier, the institutional dimension was also considered within the social component. Section 4 of this article elaborates on the topic of indicators that overlap these components and the need to take their possible interaction into account.. 7.
(11) Table 2. Summary of Frequency of Use of Indicators in 17 studies # of indicators used. Sustainable Development Dimension. Category Energy (excluding transport). Environmental. Social and institutional. Economic. TOTAL. # indicators in category. 1 or 2 times. 3 times. 4 times. 5 times or +. 8. 7. 1. 0. 0. Transport. 25. 20. 2. 2. 1. Air quality. 15. 10. 3. 0. 2. Noise. 3. 3. 0. 0. 0. Drinking water. 7. 4. 2. 0. 1. Green space, ecosystems and heritage. 16. 12. 1. 1. 2. Waste. 5. 3. 0. 0. 2. Other indicators*. 6. 3. 2. 1. 0. Sub-total. 85. 62. 11. 4. 8. Demographics. 10. 7. 2. 1. 1. Housing. 18. 15. 1. 1. 1. Education. 11. 7. 2. 1. 1. Security. 5. 4. 0. 0. 1. Health. 9. 8. 1. 0. 0. Well-being. 3. 3. 0. 0. 0. Social and community services. 11. 8. 1. 2. 0. Governance. 4. 1. 1. 0. 2. Expenses and public administration. 6. 4. 0. 0. 1. Sub-total. 77. 57. 8. 5. 7. Household income and expenses. 13. 8. 1. 0. 4. Employment. 8. 5. 0. 0. 3. Businesses. 5. 3. 1. 0. 1. Sub-total. 26. 16. 2. 0. 8. 188. 135. 21. 9. 23. * Ecological footprints, natural catastrophes, level of exposure to natural and industrial risks, consumption of equitable products, urban intensification, and soil use.. Fifth, bearing in mind the subjective nature of the exercise, we performed a final classification of the 188 indicators, this time according to the classic components of sustainable development, (i.e. we eliminated the institutional dimension). This distribution is illustrated in Figure 3. This classification was intended to identify the indicators that overlap two or three dimensions, a situation often neglected in studies of SDI. However, as the Brundtland report. 8.
(12) (WCED, 1987) maintains, for development of a given territory to be considered sustainable it must be equitable, livable and viable. Figure 3. Classification of 188 Indicators Counted. Environmental 2 (1.1%). Livable 37(20%). Viable 21 (11.2%). Sustainable 40 (21.3%) Social 19 (10.1%). Equitable 52 (27.7%). Economic 17 (9%). Lastly, we noted the most frequently used indicators to extend the analysis and develop an approach to defining a parsimonious list, with fewer redundant indicators. Table 3 presents the 32 indicators that were used 4 times or more in the 17 studies in the sample. Of these indicators, 10 are strictly indicators of sustainable development that is indicators that identify a set of challenges that are concomitantly environmental, economic and social. The results are illustrated in Figure 4a. Figure 4 Classification of Most Widely Used Indicators in 17 studies. Environmental 0. Livable 4(12.5%). Viable 6 (18.8%). Sustainable 10 (31.3%) Social 2 (6.3%). Equitable 10 (31.3%). Economic 3 (9.4%). 9.
(13) a) Indicators Used Four Times or More (N = 32). Environmental 0. Livable 3(13%). Viable 3 (13%) Sustainable 5 (21.7%). Social 2 (8.7%). Equitable 7 (30.4%). Economic 3 (13%). b) Indicators Used Five Times or More (N = 23) Table 3. Indicators Used Four Times or More in the 17 Studies. Description. Sustainable Development Category Dimension. 1. Unemployment rate. Unemployment rate of labor force. Equitable. Employment. 2. Users of mass transit (MT). Percentage of users of MT vs. other means of transport. Sustainable. Transport. 3. Density of urban population. Density of population per square kilometre in urban areas. Sustainable. Demographics. 4. Quantity of waste. Quantity of household waste sent to landfills (tonnage per year). Livable. Waste. 5. Crime rate. Crime rate per 100,000 inhabitants. Equitable. Security. 6. Mean or median household income per year. Mean/median household income ($ per year). Economic. Income and expenses. 7. Job creation for all sectors combined. Number of new jobs per year for all sectors. Economic. Employment. 8. CItizen participation in public affairs. Rate of participation in public hearings. Social. Governance. 9. Low income households. Households with income below $10,000 per year. Equitable. Income and expenses. 10. Concentration of PM10 particles. Average annual concentration in designated residential zones. Livable. Air. 11. Businesses with environmental certification. Percentage of businesses with environmental certification. Viable. Businesses. Frequency Indicator of use 8. 7. 6. 10.
(14) 12. Quantity of waste recycled. Quantity of waste recycled in tonnes/inhabitant/year. Viable. Waste. 13. Daily water consumption per person. Average daily water consumption per person per year. Sustainable. Water. Percentage of Households spending 30% or more of income on housing. Equitable. Housing conditions. 14. Households spending 30% or more of income on housing. 5. 2. 15. GHG emissions (excluding transport). GHG emissions in tonnes of CO per year (excluding transport). Viable. Air. 16. Quality of waterways. Percentage of waterways with excellent water quality. Livable. Ecosystem, heritage, green space. 17.SD policies or strategies. Absence or presence of political initiatives supporting sustainable development. Sustainable. Administration, public expendiures. 18. Rate of participation in municipal elections. Rate of participation in municipal elections. Social. Governance. 19 Participation rate for all sectors. Change in participation rate. Economic. Employment. 20. Ratio, population with high income-low income. Ratio of population with income over $80,000 to Equitable population with income below $20,000. Income and expenses. 21. Population receiving social assistance. Percentage of workforce receiving social assistance. Equitable. Income and expenses. 22. Population aged 18 and over with less than a high school diploma. Percentage of population aged 18 and over with less than a high school diploma. Equitable. Education. 23. Space alloted to nature conservation relative to area of territory. Space alloted to nature conservation relative to area of territory. Sustainable. Ecosystem, heritage, green space. 24. Average distance travelled per capita for all means of transport combined. Average distance in km/per capita/yr traveled for all means of transport combined. Sustainable. Transport. 25. Victims of traffic accidents. Rate of death and injuries caused by traffic accidents per 1000 inhabitants. Livable. Transport. 26. Green space per 1000 inhabitants. Percentage of urban space dedicated to green space per 1000 inhabitants. Livable. Ecosystem, heritage, green space. 27. Playgrounds (parks) per 1000 inhabitants. Percentage of urban space dedicated to playgrounds per 1000 inhabitants. Livable. Social and community services. 28. Cultural events. Annual number of cultural events. Social. Social and community services. 29. Average capacity of primary Average number of students per class at and secondary school classes primary and secondary schools. Equitable. Education. 30. Diversity of new housing built. Proportion of housing starts for each type of dwelling. Equitable. Housing conditions. 31. Premature mortality rate. Ratio of deaths among people under age 75 per 100,000 inhabitants. Sustainable. Demographics. 32. Ecological footprint. Ecological footprint of municipality. Sustainable. Other. 4. 11.
(15) Based on these observations, the following section discusses variations in approaches and the lack of consensus on the choice and number of indicators. 4. APPROACHES AND CHOICE OF INDICATORS Several authors have acknowledged the lack of consensus and formally established methods pertaining to SDI practices (see Legrand et al., 2007 and Planque and Lazzeri, 2006). Difficulties in developing and applying SDI can be explained largely by the nature of sustainable development, whose very broad definition gives rise to multiple interpretations. Levett (1998) eloquently expressed this problem: “the struggle to find and use indicators of sustainable development is intimately bound up with the process of deciding what we mean by (the term) and what we shall do about it.” Following the analysis of the 17 studies retained, we discerned the main recurrent problems related to the effective use and choice of SDI, particularly in the municipal context. Notably, these problems lie in the definition of sustainable development, the objectives set by SDI and the constraints of accessibility of data used to create the indicators. 4.1. Diversity of Approaches Comparison of the 17 studies reveals that there are as many possible interpretations or. approaches to creation of SDI as there are definitions of sustainable development. Similarly, depending on the objectives for the use of SDI, the approach varies between studies. For instance, if some territorial practices associate sustainable development with the concept of quality of life (FCM, 2004; Jacksonville Community Council, 2004; Koller, 2006), others refer to more traditional dimensions (Cowley et al., 2007; Brazzini-Mourier, 2006; Planque and Lazzeri, 2006). In both cases, the definition of sustainable development is problematic. By emphasizing quality of life, an entire aspect of sustainable development (i.e. negative externalities) is not taken into account in the formulation of indicators. Thus, a given city or municipality may indeed promote a good quality of life for its citizens, yet this lifestyle may not necessarily be viable or equitable. For example, the indicators related to public services (e.g. recreation) may indicate a good quality of life while contributing to the sustainable development of a given municipality. Nonetheless, the municipal buildings that offer these services may consume large quantities of energy, which would indicate poorer performance from. 12.
(16) a sustainable development perspective. Moreover, by limiting sustainable development to “classic” dimensions, the classification of indicators may become problematic, particularly for indicators that reflect more than one dimension at a time. This is the main criticism of the studies that have adopted this approach (Brazzi-Mourrier, 2006; Koller, 2006). Moreover, although it is important to create a proper hierarchy of objectives for which the indicators are used (Verry and Nicolas, 2005), the objectives may also represent a break point in the use of SDI by playing a determining role in the approach retained. If most studies aim to integrate social, economic and environmental dimensions in the form of SDI in a general framework, others attempt to clarify one or more particular aspects by setting specific objectives or priorities (Tomalty et al., 2007; Jackson Community Council, 2004). In some cases, the objectives may even emerge from the identification of a particular challenge as a priority in a sustainable development perspective. For example, the SMART Transportation Ranking Report (Nemetz et al., 2007) strictly concerns transport and considers transport challenges to underpin problems related to sustainable development in large Canadian cities. Another example is the application of indicators in the field of Sustainable Housing (Winston and Eastaway, 2007), which considers the challenges related to housing as a priority in sustainable development. Even if such practices contribute to evaluating strengths, weaknesses and forecasts as part of an implementation strategy of sustainable development, they are admittedly not immune to political excesses of municipal administrations that define “their” objectives which “their” SDI must meet. Therefore, we retain three important conditions that allow a less superficial approach to the design of SDI. First, sustainable development should not be systematically redefined when adapted to a particular territorial context. Moreover, the interpretations of SD should be consistent with the Brundtland report by reflecting the economic, social and environmental components as well as the overlaps between them. Second, the objectives regarding the origin and formulation of an SDI chart should reflect the existing tradeoff between consideration of specific factors for each city or municipality and the need to homogenize the indicators such that they allow a fairer comparison between municipal jurisdictions of the same stature. Concomitantly, these objectives must take into account the target audience and the ultimate use of the indicators as tools that support municipal sustainable development strategies. We therefore believe that an effective approach would consist in identifying the integrated dimensions of sustainable development as broadly as possible, while ensuring that possible overlapping between these dimensions are clearly specified.. In addition, the statement of 13.
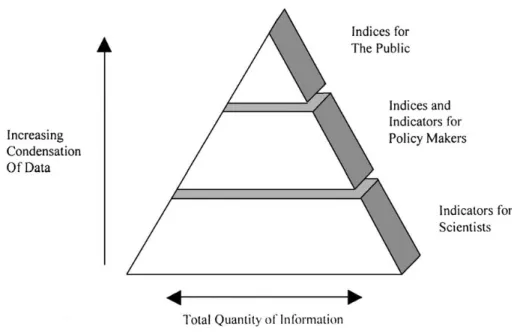
(17) objectives that SDI must meet should entail a social construction process that can be conditioned by social, historical, economic or local factors (Duchêne et al., 2002) without impeding the homogenization of measures that would allow comparison of territories of the same stature. This aspect deserves serious consideration, mainly to deter different territorial jurisdictions from creating “their own” indicators to meet objectives that they define. We take these findings into account to develop our approach to the creation of SDI in the fourth section of this article. 4.2. Variation in the Choice and Number of Indicators Even when a similar approach is applied, we have observed that two studies or more may. use indicators that vary considerably in number and attributes. As mentioned above, in the 17 studies examined, the number of SDI varies between 10 and 86, and the number of indicators related to the environmental component exceeds that of the other components, thus implying a lesser consensus. We generally attributed these variations to the classification process, that is the way the indicators are structured or organized in a given system, as well as to access constraints. Accordingly, we differentiate divergence between practices generally suggested by scientists and those endorsed by municipal administrations. If the latter tend to favor a less conceptual structure comprising fewer indicators, intended to achieve simple and quantifiable objectives, scientists prefer a minimum of aggregation and, if possible, simplification, in order to be faithful to the concepts. This contrast is illustrated in Figure 5.. 14.
(18) Figure 5 The Relationship Between Data Condensation and Audience (Shields et al., 2002). Aggregating or simplifying information nonetheless reduces some of its analytical power while heightening the subjective nature of indicators (Verry and Nicolas, 2005). Kahn (2006) argues that there are still no standards pertinent and universal methods or criteria for aggregating and weighting SDI. Moreover, all 17 studies examined acknowledge that the constraints of accessibility and availability of data are a recurring problem for municipalities.. This situation occasionally. dictates the use of less than maximally efficient indicators to capture sustainable development on the municipal scale. For example, bus speed may be put forth as an indicator of efficiency of mass transit (Basiago, 1999), whereas it has been demonstrated that cities where buses travel more quickly have greater sprawl coupled with less efficient and less used mass transit (Newman and Kenworthy, 1988) Constraints of accessibility also affect the proportion of indicators in integrated components.. Thus, although social and economic challenges take precedence in urban. sustainable development (Federation of Canadian Municipalities, 2004), the popularity of related indicators is linked notably to the fact that qualitative and quantitative data (household characteristics, education, employment, etc.) are more accessible at the municipal scale than are 15.
(19) data related to the environment (GHG emissions, energy consumption, air quality index, annual distance traveled per inhabitant according to travel mode, etc.).. 5.. SDI SELECTION STRATEGY In this section we establish a strategy for choosing a list of pertinent indicators. This. strategy is based on: 1) the definition of basic selection criteria derived from the tradeoff between parsimony and coverage of pertinent categories, and 2) the classifications and sorts that we previously analyzed in Section 1. Further, we consider the problems identified in sections 3 and 4 when justifying our approach and validating our recommendations. 5.1. Selection Criteria Determining the optimal choice and number of indicators inevitably requires that selection. criteria be defined. We evaluated the number of selection criteria used in the 17 studies. In total, more than half of the studies use fewer than three criteria, whereas one study identifies up to 14 selection criteria. Of a total of 68 criteria noted, only six are frequently used. The criteria are found under the following headings: “credible,” “universality,” “data requirements and availability,” “comprehensible,” “links with management” and “spatial and temporal scales of applicability.”5 In addition, a growing number of authors recognize the importance of defining transparent and rigorous selection criteria to increase the value and scientific credibility of indicators selected while ensuring that they can inform decision-making processes (Belnap, 1998; Slocombe, 1998; Dale and Beyeler, 2001; Niemeijer and de Groot, 2008). A particularly widespread approach in social sciences, perhaps owing to the simplicity of its acronym, is worth mentioning.. An. indicator must be SMART, namely: “Specific – be clear and concise and avoid vague terms; Measurable – quantifiable indicators to measure progress; Achievable (Assignable) – someone must be able to complete the objective; Relevant (Realistic) – able to be interpreted; within budget and time frame; Time-related – completed by a certain date; change measured by a certain date.” (United Nations Statistical Institute for Asia and Pacific, 2007) 5. To standardize the selection criteria used in the 17 studies, we adopted the classification developed by Niemeijer and De Groot (2008), using the categories whose definition corresponds to those found in the studies we analyzed.. 16.
(20) Even if the application of such an approach remains subjective, as Dale and Beyeler (2001) note, it can be used to validate the choice and number of indicators. However, it should be considered as a complement to the adoption of clear objectives or the development of general principles. For example, the Renewed EU Sustainable Development Strategy rests on seven objectives and illustrates the holistic nature of the concept of sustainable development perfectly. Note that it applies selection criteria to supplement the objectives (on this subject, see Jones and Patterson, 2007). Similarly, the International Institute for Sustainable Development developed ten principles based on Agenda 21, and specified a priori selection criteria (see Hardi and Zdan, 1997). 5.2. Conceptual Framework and Classification Method of Indicators Whereas a selection criteria chart can be used to produce a refined list of indicators, it is. not sufficient to produce a structure or classification model justified by previously established objectives and by the processes and states to be measured. The use of a conceptual framework is thus a fundamental step that can ensure that the indicators selected indeed cover the phenomena to be measured (Niemeijer and de Groot, 2008). There are no specific models that allow one to simplify or predict interactions that govern sustainable development (Abolina and Zilans, 2002). Further, there are many possible approaches to designing and organizing indicators, each of which has advantages and disadvantages (Hart, 1998). The main conceptual frameworks are well documented by McLaren (1996). They include frameworks centered on objectives, challenges, sectors, components of sustainable development and cause and effect relationships; the latter are also known as “pressure-status-response” models (PSR). McLaren (1996) contends that although these approaches can meet the objectives for which they were designed, only the combination of two or more of these approaches can capture the complexity of sustainable development. The PSR-models and their derivatives (DPSIR: driving force-pressure-state-impactreaction; DSR: driving force-state-reaction) are particularly useful.. Such models combine. different properties attributed to indicators. Niemeijer and De Groot (2008) and Barcelo (1999) propose definitions of these properties. Accordingly, the PSR model serves to group a series of indicators to represent anthropic pressure on the environment, the resulting state of the. 17.
(21) environment and the reactions or responses (political, actions, changes in behavior, etc.) to the problems encountered. In the DSR model, anthropic pressure on the environment is simply replaced by a driving force to better integrate social, economic and institutional indicators. In the DPSIR model, driving forces behind the use of transport or industry, for example, exert pressure on the environment such as emission of pollutants, which in turn degrade the state of the environment. This has an impact on human health and the ecosystem, which triggers a reaction by society in the form of political measures that can apply to each component of the model. However, for such models to be effective, the indicators must be multiplied by three, four or even five. Each category of indicator (transport, energy, education, health, air, etc.) must be broken down into indicators of pressure, state and response in the case of a PSR model, for example. It is partly for this reason that the United Nations, which pioneered this type of approach in 1990, abandoned it in 2006. In addition, it does not allow attainment of the objectives for which the indicators were created (Bell and Morse, 2008). Lastly, there is no indication that increasing the number of indicators allows one to better capture the relative sustainability for one or more territories. On the contrary, as we mentioned in the third section of this article, the optimal number of indicators should consider the tradeoff between broad coverage of the sustainable development components and the goal of parsimony of indicators. 5.3. Survey-Based Selection Strategy for SI (SuBSelec) In this section we propose an optimal selection strategy of a subset of indicators from. among the 188 indicators compiled. We then determine a general criterion of optimization along with the pertinent constraints. To do so, it is important to set clear fundamental guidelines for compiling the list of indicators. Evidently, the SDI retained should collectively cover the four components and 20 categories of sustainable development presented in Table 2.. Whereas we. could conceivably select all 188 indicators, we consider this a simplistic and inefficient strategy given redundancy factors and the loss of efficiency in the public dissemination of information and results.6 A more targeted strategy would consist in retaining one indicator per each of the 20 categories defined. We could thus cover all components of sustainable development and all subcategories. Nonetheless, although this approach would reduce the number of indicators, it would ignore asymmetry in the importance and complexity of these components and categories. For example, Table 2 reveals that the income and expenses category tends to be particularly well 6. The latter element is important according to several lists of selection criteria, the best known of which is that of the ten Bellagio principles. See Bell and Morse (2008). 18.
(22) represented in the studies. This is not surprising, and seems desirable given that it is useful to consider not only average income but also variance in the distribution of income (e.g. via percentages of low income). Thus it is worth representing all components and categories, although more weight should be given to certain items. Once this initial analysis is accepted, three central elements emerge in the establishment of an optimal selection criterion for SDI. First, we are seeking a parsimonious list of SDI that is easily understandable and usable. This would allow us to simplify and synthesize the information to facilitate the dissemination of analyses. In addition, we aim to cover all the components and categories of sustainable development established in Table 2. Lastly, we endeavor to retain SDI on which a consensus exists in the literature. This point is crucial to establish solid conceptual bases in the development of indicators and indices. Ultimately, we are attempting to achieve a consensus to facilitate comparison between studies and cities over time7. Given these objectives, we have adopted the following general selection criterion: Survey-Based Selection Strategy for SDI (SuBSelec): A selection of SDI based on a review of studies intended to minimize the number of indicators selected from among those compiled, subject to the following constraints: 1) choose the most cited indicators; 2) cover the components of sustainable development and the pertinent predetermined categories and 3) choose the simplest SDI to facilitate data collection, understanding and dissemination. 5.3.1 Application of the Strategy Given the classifications and sorts performed above, the starting point of the selection process is to determine the most commonly used indicators. Three “characteristics” thus emerge from Table 3: 32 indicators are used four times or more, 23 are used five times or more and 13 appear six times or more. Based on our other selection constraints, it is clear that the 13 SDI used six or more times do not sufficiently cover the components and categories presented in Table 2. For instance, these SDI do not pertain to essential categories such as education and housing. By contrast, the 32 SDI used four times or more cover all of the components and categories. Thus, given the SuBSeleC criteria defined above, to produce the list, indicators will be chosen from among those cited four times rather than those cited five times or more. In this case we will 7. We are aware that the search for a consensus may create certain gaps and errors in the selection of indicators. We are not attempting to criticize or develop indicators, but rather to select a list that would be parsimonious and representative of knowledge at a given stage. However, we believe that the selection of indicators should be relatively consistent to allow a comparison over time. We will revisit temporal and spatial importance below.. 19.
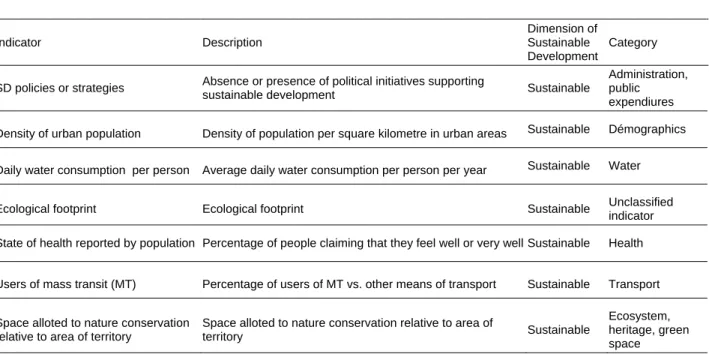
(23) therefore choose between two typical situations found in studies using SDI. The first is the situation where a “high” number of SDI are used, to allow greater coverage of components and categories of sustainable development. This situation corresponds in this case to the 32 indicators cited four times. In the second situation, greater parsimony is favored at the expense of reduced coverage of components and subcategories of sustainable development. In this paper we refer to cases where 23 indicators are cited five or more times.8 We thus aim to determine whether it is optimal to add nine additional indicators to increase the coverage of components and categories. In other words, we will evaluate whether the gain in efficiency due to the information obtained through greater coverage of components and categories is superior to the loss of efficiency induced by a significant increase in the number of indicators used (39.1%). It is impossible to definitively answer this question objectively.9 Nonetheless, two elements of the analysis indicate that it is preferable to use fewer indicators to the detriment of the coverage principle. First, Table 2 reveals that the shift from indicators used four times or more (“four times”) to those cited five times or more ("five times”) leads to the non-representation of only two categories: other (e.g. ecological footprint) and social and community services. In all the other categories, the use of “four times” vs. “five times” permits constant coverage. However, note that in addition to the items other and social and community services, four other categories are not represented in all cases, namely energy, noise, health and well being. Below we discuss a strategy for solving this problem. A second factor argues in favor of the “five times” criterion. Figure 4 depicts the 188 initial indicators in a classic Venn diagram of sustainable development. The purpose is to replicate Figure 3 (in percentages), using much fewer indicators. In this case we used between 23 and 32 indicators. Figure 4, which shows the same Venn diagrams for the “four times” and “five times” indicators, readily illustrates that the latter case is much more representative of the percentages obtained with the 188 initial indicators while covering the majority of the components. Therefore, we obtained the same type of coverage of components (in percentage) with 23 indicators as with 188. However, as mentioned above, by retaining only these 23 indicators, 6 of 20 categories would not be covered, namely: 1) energy (excluding transport); 2) noise; 3) other; 4) health; 5) well being; and 6) social and community services. Although these. 8. This type of situation is summarized well in the introduction of the work by Bell and Morse (2008). Aside from the fact that some find attempts to measure sustainable development illusory, the inherent unavoidable subjectivity is one of the main criticisms of the choice and use of SDI. 9. 20.
(24) categories seem to be slightly more “secondary” in the studies, we believe that they should be represented by at least one indicator. To do so, we use the most prevalent indicator in the studies according to Table 2. For three of the six missing indicators, the problem is easily solved given that only one indicator stands out for the number of times it is used. For example, for the energy and health categories, no indicator is used five or more times, whereas only one indicator is used three or more times. We therefore use these singular indicators for the two categories. The same rationale applies to the “other indicators” category, for which only one indicator stands out in the column of indicators used four times. The three other categories not represented necessitate the choice of one indicator from among two or three. In effect, three indicators are used three times for the noise and well being items, while two indicators are used four times for social and community services. For each of these three categories we therefore choose the indicator for which the data are easiest to obtain We consequently obtained a list of 29 indicators, presented in Table 4. Figure 6a illustrates a classic Venn diagram of sustainable development with the 29 indicators retained assigned to different groups and intersections. By comparing it with Figure 6b, it is easy to see that the indicators retained allow similar coverage to the 188 initial indicators in terms of percentages of different components of the intersection of sustainable development: livable, equitable, viable and sustainable.. Table 4. The 29 Indicators Retained. Indicator. Description. Dimension of Sustainable Category Development. SD policies or strategies. Absence or presence of political initiatives supporting sustainable development. Sustainable. Administration, public expendiures. Density of urban population. Density of population per square kilometre in urban areas. Sustainable. Démographics. Daily water consumption per person. Average daily water consumption per person per year. Sustainable. Water. Ecological footprint. Ecological footprint. Sustainable. Unclassified indicator. State of health reported by population Percentage of people claiming that they feel well or very well Sustainable. Health. Users of mass transit (MT). Percentage of users of MT vs. other means of transport. Sustainable. Transport. Space alloted to nature conservation relative to area of territory. Space alloted to nature conservation relative to area of territory. Sustainable. Ecosystem, heritage, green space. 21.
(25) Cost of living. Cost of living in $ per person. Economic. Well being. Participation rate for all sectors. Change in participation rate. Economic. Employment. Job creation for all sectors combined. Number of new jobs per year for all sectors. Economic. Employment. Mean or median household income per year. Mean/median household income ($ per year). Economic. Income and expenses. Households spending 30% or more of income on housing Percentage of Households spending 30% or more of income Equitable on housing. Housing conditions. Population aged 18 and over with less Percentage of population aged 18 and over with less than a Equitable than a high school diploma high school diploma. Education. Unemployment rate. Equitable. Employment. Ratio, population with high income-low Ratio of population with income over $80,000 to population income with income below $20,000. Equitable. Income and expenses. Population receiving social assistance Percentage of workforce receiving social assistance. Equitable. Income and expenses. Low income households. Households with income below $10,000 per year. Equitable. Income and expenses. Crime rate. Crime rate per 100,000 inhabitants. Equitable. Security. Rate of participation in municipal elections. Rate of participation in municipal elections. Social. Governance. CItizen participation in public affairs. Rate of participation in public hearings. Social. Governance. Annual consumption of energy from renewable sources. Annual consumption of energy from renewable sources per Viable inhabitant in kWh. Energy. Businesses with environmental certification. Percentage of businesses with environmental certification. Viable. Businesses. Quantity of waste recycled. Quantity of waste recycled in tonnes/inhabitant/year. Viable. Waste. Concentration of PM10 particles. Average annual concentration in designated residential zones. Livable. Air. GHG emissions (excluding transport). GHG emissions in tonnes of CO per year (excluding transport). Livable. Air. Population exposed to Lnigh>55dB(A) % of total population exposed to Lnight>55dB(A). Livable. Noise. Quality of waterways. Percentage of waterways with excellent water quality. Livable. Ecosystem, heritage, green space. Quantity of household waste. Quantity of household waste sent to landfills (tonnage per year). Livable. Waste. Participation in sports in parks and swimming pools. Number of participants as percentage of total population. Livable. Social and community services. Unemployment rate of the workforce. 2. 22.
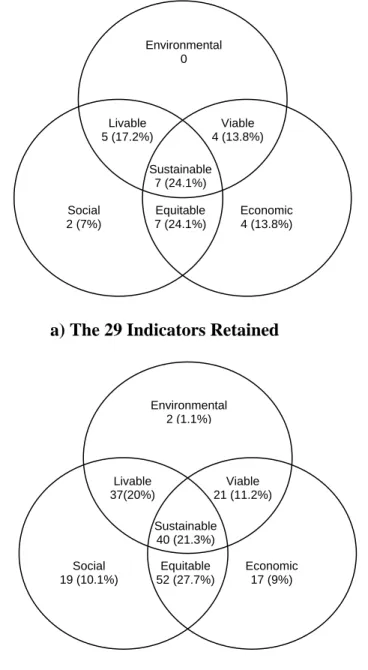
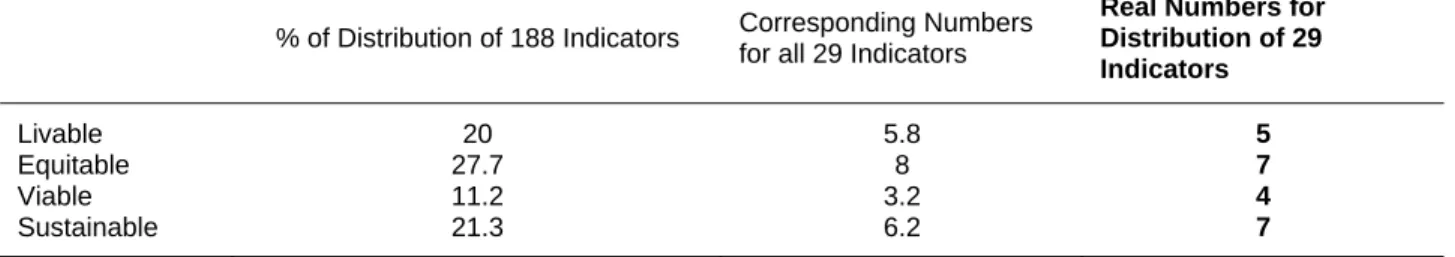
(26) Figure 6. Classification and Count of 29 Indicators Retained vs 188 Initial Indicators. Environmental 0. Livable 5 (17.2%). Viable 4 (13.8%). Sustainable 7 (24.1%) Equitable 7 (24.1%). Social 2 (7%). Economic 4 (13.8%). a) The 29 Indicators Retained. Environmental 2 (1.1%). Livable 37(20%). Viable 21 (11.2%). Sustainable 40 (21.3%) Social 19 (10.1%). Equitable 52 (27.7%). Economic 17 (9%). b) The 188 Initial Indicators. Thus, our parsimonious list of 29 indicators (Figure 6a) reproduces the coverage of the integrated components of sustainable development ensured by the 188 indicators (Figure 6b), particularly in the intersections of the environmental, social and economic components, namely livable, equitable, viable and sustainable. We summarize these correspondences in Table 5. The second column provides, for each of the intersections, the percentage of representation of the 188. 23.
(27) SDI compiled. The third column contains the numbers corresponding to the 29 SDI retained that allow us to attain the same percentages of coverage as those obtained with the 188 initial SDI. Lastly, the third column provides the real numbers of SDI (from among the 29 retained) according to various intersections. It is therefore clear that the 29 SDI retained allow similar coverage to that obtained with the 188 compiled from the 17 studies examined.. Table 5. Percentage Distribution of the 29 Chosen Indicators vs the Percenrage Distribution of the 188 Initial Indicators. % of Distribution of 188 Indicators. Livable Equitable Viable Sustainable. 6.. 20 27.7 11.2 21.3. Corresponding Numbers for all 29 Indicators 5.8 8 3.2 6.2. Real Numbers for Distribution of 29 Indicators 5 7 4 7. CONCLUSION From concept to local practice, ongoing debates increasingly underline the need to. measure sustainable development SD based on indicators or evaluation criteria. One of the most common applications consists in comparing municipalities, notably to support local decisionmaking processes. Problems related to the use and application of SDI primarily stem from 1) an overly broad definition of sustainable development that gives rise to multiple interpretations, 2) the absence of standard and universal classification methods or approaches to designing SDI, particularly at the municipal level, and 3) constraints caused by the accessibility of data that preclude their quantification and the specific qualification of indicators. These problems engender considerable diversity in the conceptual frameworks, choices and optimal number of SDI across the 17 studies examined. In this article we address these problems by applying a method based strictly on the empirical data found in the 17 studies that examined SDI. Accordingly, the main rationale of our approach is to find a method of selecting indicators that would allow the broadest possible. 24.
(28) coverage of the integrated components of sustainable development and the categories that comprise them, while minimizing the number of indicators retained. This method, which we call SubSeleC, is a strategy that subjects the 188 indicators extracted from 17 studies to three parameters to reduce the number of indicators to an optimal level. This optimal level thus results from the union between the most frequently used indicators and those that maximally include the integrated components of sustainable development and their constituent categories. In total, 29 SDI were retained in our study, and clearly reflect the initial distribution of the 188 SDI through the integrated components of sustainable development Although we recognize the subjective nature of our approach, we believe that the classification and categorization exercises can allow the selection of recognized and complementary indicators while covering the various aspects of sustainable development as broadly as possible. Moreover, we reach the same conclusion as Niemeijer and De Groot (2008) in that selection if indicators are invariably subject to arbitrary decisions at one stage of the process or another. In addition, our analysis demonstrates that current practices related to SDI cannot meet standard objectives. Thus, considering the contradiction between the need to obtain indicators that allow comparison between jurisdictions and the desire to reflect local concerns, it is probable that consensus on certain SDI is a prerequisite to these objectives being met. Nonetheless, it should be acknowledged that this is a relatively new field that will surely benefit from ongoing and future local initiatives.. 25.
(29) Bibliography Abolina, K. and A. Zilans. 2002. Evaluation of urban sustainability in specific sectors in Latvia. Environment, Development and Sustainability, 6: 299-314. Agence Régionale pour l’Environnement. 2001. Diagnostic, développement durable urbain: tome 2: les indicators. Toulouse: Agence Régionale Pour l’Environnement. Ambiente Italia Research Institute. 2003. European common indicators (ECI): towards a local sustainability profile. final project report. Luxembourg: Office for Official Publications of the European Communities. Arcolatino. 2004. 21 indicators pour un développement durable de l’Arc Latin. Communication présentée au module de Développement Sustainable de l'École Doctorale Biologie des Systèmes Intégrés, Agriculture, Environnement. Montpellier, France: Agropolis International Agropolis. Novembre. Barcelo, M. 1999. Les indicators d’étalement urbain et de développement durable en milieu métropolitain. Cahier 99-06. Montréal: Observatoire métropolitain de la région de Montréal. Basiago, A.D. 1999. Economic, social and environmental sustainability in development theory and urban planning practice. The Environmentalist, 19: 145-161. Bell, S. and S. Morse. 2008. Sustainability indicators: measuring the immeasurable? Second Edition. London: Earthscan. Belnap, J. 1998. Environmental auditing: choosing indicators of natural resource condition: a case study in Arches National Park, Utah, USA. Environmental Management, 22: 635–642. Boston Foundation and Greater Boston’s Civil Community. 2007. A Summary of the Boston indicators report: 2004-2006. Boston: The Boston Foundation. Brazzini-Mourier, S. 2006. Indicators communaux intégrés. Rapport de synthèse. Onex, Genève: Ville d’Onex. Callon M., P. Lascoumes and Barthe, Y. 2001. Agir dans un monde incertain. Essai sur la démocratie technique. Paris: Éditions Seuil. Camagni, R. 2002. On the concept of territorial competitiveness: sound or misleading? Urban Studies, 39 (13): 2395–2411.. 26.
(30) Campbell, S. 1996. Green cities, growing cities, just cities? Urban planning and the contradictions of sustainable development. Journal of the American Planning Association, 62. Corporate Knights. 2007. Canada's most sustainable cities. Special report of March 6, 2007. Toronto: Corporate Knights. Cowley, C., P. Madden, Quinn, T. and Winter, T. 2007. The sustainable cities index: ranking the largest 20 British cities. London, UK: Forum for the future organisation. Dale, V.H.and S.C. Beyeler. 2001. Challenges in the development and use of ecological indicators. Ecological Indicators, 1: 3–10. Duchêne, F., C.M. Journel and Coanus, T. 2002. The forgotten construction process of indicator sets: The social dimension of air pollution measurement in the Greater Lyons area (France). Ecological Indicators 2: 187-196. Federation of Canadian Municipalities. 2004. Quality of life in Canadian communities. Ottawa: FCM. Fraser Basin Council. 2000. Sustainability indicators for the Fraser Basin. Fraser Basin. BC: The Fraser Basin Council. Hardi, P. and T. Zdan. 1997. Assessing sustainable development: principles in practice. Winnipeg: The International Institute for Sustainable Development. Hart, M. 1998. Sustainable community indicators: trainer’s workshop. West Hartford, US: HART Environmental. Jacksonville Community Council. 2004. Quality of life. progress report. Jacksonville, US: http://www.jcci.org/ Jones, P. and J. Patterson. 2007. The development of a practical evaluation tool for urban sustainability. Indoor and Built Environment, 16(3): 255-272. Kahn, M. E. 2006. Green Cities: Urban growth and the environment. Brookings Institution Press, Washington D.C. Koller, C. 2006. Le palmarès des villes romandes et le besoin de renforcer la statistique urbaine sur le plan suisse (méthodologie, sources, et résultats). Revue économique et sociale, 1: 101116.. 27.
(31) Legrand, N., S. Planche and Rabia, F. 2007. Intégration d’indicators de développement durable dans un outil d’aide à la décision. Paris: École des ingénieurs de la ville de Paris. Levett, R. 1998. Sustainability indicators: integrating quality of life and environmental protection. Journal of the Royal Statistical Society, A161: 291-302. Nemetz, P. (chair) 2007. SMART transportation. ranking report. Vancouver: Appleton Charitable Foundation. Newman, P. 2006. The environmental impact of cities. International Institute for Environment and Development, 18(2):275-295. Newman, P. and Kenworthy, J. 1988. The transport energy trade-off: fuel efficient traffic versus fuel efficient cities. Transportation Research, 22A (3): 163-174. Niemeijer, D. and R.S. De Groot. 2008. A conceptual framework for selecting environmental indicators sets. Ecological indicators, 8:14-25. Martinez-Alier J., G. Munda and O'Neill, J. 1998. Weak comparability of values as a foundation for ecological economics. Ecological Economics, 26: 277-286. Meier, A. and D. Wachter. 2005. Indicators centraux pour le développement durable des villes et cantons. Rapport du Cercle Indicateurs. Berne, Switzerland: Office fédéral du développement territorial. McLaren, V. W. 1996. Urban sustainability reporting. Journal of the American Planning Association, 62 (2), 184-203. Perret B. 2002. Indicators sociaux. Etat des lieux et perspectives. Les Papiers du CERC 2002-01, Conseil de l'emploi, des revenus et de la cohésion sociale, Paris. Planque B. and Y. Lazzeri. 2006. Elaboration d’indicators pour un système de suivi-évaluation du développement durable: tome 1: Principes et méthodologie de construction du référentiel. Programme de recherche politiques territoriales et développement durable. Paris: Ministère de l’Equipement, des Transports, du Logement, du Tourisme et de la Mer Direction Générale de l'Urbanisme, de l'Habitat et de la Construction, Secrétariat permanent du Plan Urbanisme Construction Architecture, Réponse APR programme D2RT. Shields, D.J., S.V. Šolar and Martin, W.E. 2002. The role of values and objectives in communicating indicators of sustainability. Ecological Indicators, 2 (2002) 149–160.. 28.
(32) Slocombe, D.S. 1998 Forum: defining goals and criteria for ecosystem-based management. Environmental Management, pp. 483–493. SustainLane Report. 2007. The SustainLane 2006: US city rankings. Document consulted on December 15, 2007 from: http://www.sustainlane.com/us-city-rankings/ Sustainable Calgary. 2004. State of our city report 2004. Calgary: City of Calgary. Thomas, J-Y. (dir) 2003. Mesurer le développement durable en Belgique: Quel rôle pour les processus participatifs? Research paper for the Conseil fédéral du développement durable. Belgium: Institut pour le développement Sustainable (IDD) and the Centrum voor duurzame ontwikkeling (CDO). Tomalty, R..(dir) June 2007. The Ontario urban sustainability report, 2007. Ottawa: The Pembina Institute. United Nations Statistical Institute for Asia and Pacific. 2007. Building administrative data systems for statistical purposes-addressing training issues and needs of countries. Inception/Regional Workshop on RETA6356: Improving Administrative Data Sources for the Monitoring of the MDG Indicators. Bangkok, Thailand. United Nations Commission on Sustainable Development, 2002. Report of the World Summit on Sustainable Development. United Nations publication. Johannesburg, South Africa, 26/08-4/09. Verry, D., J-P. Nicolas. 2005. Indicators de mobilité durable: de l’état de l’art à la définition des indicateurs dans le projet SIMBAD. Rapport du Laboratoire d’Économie des Transports pour le compte de la DRAST (Ministère de l’Équipement) et de l’ADEME. Paris. Winston, N., M.P. Eastaway. 2007. Sustainable housing in the urban context: international sustainable development indicator sets and housing. Social Indicators Resources, 87: 211-221. World Commission on Environment and Development, 1987. From one earth to one world: an overview. Oxford: Oxford University Press.. 29.
(33)
Figure

+7


Documents relatifs
Survey of National Coastal and Marine SDI geoportals: a first typology of the worldwide developments
The preliminary results suggest that worldwide developments are underway for geoportals enabling users to have access to various data concerning coastal and marine zones.
Compared to existing graph- based feature selection methods, our method exploits tree decomposition techniques to reveal groups of highly correlated features.. FSTDCG
UNA DE LAS PRINCIPALES estrategias que ha desarrollado el Proyecto SABA ha sido la promoción y facilitación de procesos de articulación de múltiples actores del sector público,
all concrete states which are solutions of the concrete prob- lem, their corresponding abstract state (w.r.t extended mode value mapping) is solution of the abstract problem.. From
Cet article a pour objectif de démontrer la faisabilité de la construction des ouvrages à l’aide de robots volants, plus communément appelés drones, sur base de
To quantify the degree of overlapping of the photographs for a survey, an “effective overlap” parameter (i.e. the mean number of matched photographs capturing each
In a general statistical framework, the model selection performance of MCCV, VFCV, LOO, LOO Bootstrap, and .632 bootstrap for se- lection among minimum contrast estimators was
We have mentioned on several previous occasions the classified directory. This is a very important feature of the analyser. We have to remind ourselves that when
