by
Mahdi MASOUMI KHALILABAD
THESIS PRESENTED TO ÉCOLE DE TECHNOLOGIE SUPÉRIEURE
IN PARTIAL FULFILLMENT FOR A MASTER’S DEGREE
WITH THESIS IN MECHANICAL ENGINEERING
M.A.Sc.
MONTREAL, August, 25 2017
ÉCOLE DE TECHNOLOGIE SUPÉRIEURE UNIVERSITÉ DU QUÉBEC
This Creative Commons license allows readers to download this work and share it with others as long as the author is credited. The content of this work can’t be modified in any way or used commercially.
BY THE FOLLOWING BOARD OF EXAMINERS
Mr. Philippe Bocher, Thesis Supervisor
Département de génie mécanique at École de technologie supérieure Mr. Mohammad Jahazi, Thesis Co-supervisor
Département de génie mécanique at École de technologie supérieure Mr. Jean-François Chatelain, President of the Board of Examiners Département de génie mécanique at École de technologie supérieure Mr. Ricardo Zednik, Member of the jury
Département de génie mécanique at École de technologie supérieure
THIS THESIS WAS PRENSENTED AND DEFENDED
IN THE PRESENCE OF A BOARD OF EXAMINERS AND PUBLIC AUGUST 18, 2017
The author would like to thank M.A.Sc research director, Professor Philippe Bocher and co- director, for their guidance, support and expertise during the degree, without which none of this would have been possible. Gratitude is also expressed for Yasser Zedan, Damien Texier, Ludovic Diez-Jahier, Remi Bertrand, Hossein Monajati, Eric Marcoux and Michel Orsini, for their cooperation the entire duration of the diploma.
A part of the research presented in this paper was financed by the Fonds de recherche du Québec – Nature et technologies by the intermediary of the Aluminum Research Centre – REGAL that without their valuable assistance, this work would not have been completed.
SOUDAGE PAR FRICTION DES MATÉRIAUX AA2024 ET AL-Li 2198
Mahdi MASOUMI KHALILABAD
RÉSUMÉ
L'amélioration des propriétés mécaniques des structures hybrides fabriquées par soudage par friction (FSW) des matériaux AA2198 et AA2024 est l'objectif de cette recherche. Différentes conceptions d'outils, paramètres de vitesse de soudage, traitements thermiques en métal de base (T8 et T3) et après soudure (PWHT) ont été étudiés afin d'améliorer les propriétés mécaniques de l'articulation. La tige cylindrique conique avec un épaulement de ventilateur surélevé était la configuration optimale de la conception d'outil en termes de limite d'élasticité et d'élongation. Une gamme de paramètres de vitesse de soudage a ensuite été étudiée pour la conception optimale de l'outil pour trouver des conditions de soudure appropriées. L'efficacité de l'assemblage peut atteindre jusqu'à 78% en choisissant des paramètres de vitesse de soudage optimum de 750 tr / min et 450 mm.min-1. On observe que l'utilisation des plaques en T3 ou en T8 créera des joints avec des propriétés mécaniques similaire en raison de la perte de propriétés mécaniques dans TMAZ / HAZ du côté AA2198. T8 PWHT avec et sans précontrainte a été appliqué sur des échantillons soudés dans des conditions T3 pour récupérer les propriétés mécaniques des zones articulaires. Les deux processus T8 PWHT ont amélioré la dureté du TMAZ / HAZ du côté AA2198 alors qu'ils n'avaient aucun effet positif sur TMAZ / HAZ du côté AA2024 et les propriétés mécaniques finales ne s'améliorent pas. On peut conclure que T8 PWHT n'est pas efficace pour l'articulation différente AA2024-AA2198. De plus, la répartition de la température dans la pièce a été étudiée avec la méthode des éléments finis. La simulation montre que le refroidissement pendant le soudage pourrait être efficace pour améliorer les propriétés mécaniques des articulations en diminuant la température maximale et le temps d'exposition à la chaleur.
FRICTION STIR WELDING OF 2024 ALUMINUM ALLOY TO 2198 ALUMINUM-LITHIUM ALLOY
Mahdi MASOUMI KHALILABAD
ABSTRACT
Mechanical properties improvement of the hybrid structures made by friction stir welding (FSW) of AA2198 and AA2024 materials is the goal of this research. Different tool designs, welding speed parameters, base metal heat treatment (T8 and T3) and post weld heat treatment (PWHT) were investigated in order to improve the mechanical properties of the joint. The tapered cylindrical pin with a raised fan shoulder was the optimal tool design configuration in terms of yield strength and elongation. A range of welding speed parameters was subsequently studied for the optimum tool design to find appropriate welding conditions. The joint efficiency can reach up to 78% by choosing optimum welding speed parameters of 750 RPM and 450 mm.min-1. It is observed that employing the plates in T3 or T8 will create joints with similar mechanical properties due to loss of mechanical properties in TMAZ/HAZ of AA2198 side. T8 PWHT with and without pre-straining was applied on welded samples in T3 conditions to recover the mechanical properties of joint areas. Both T8 PWHT process improved the hardness of TMAZ/HAZ of AA2198 side while they have not positive effect on TMAZ/HAZ of AA2024 side and the final mechanical properties did not improve. It can be concluded that T8 PWHT is not effective for the AA2024-AA2198 dissimilar joint. Besides, the temperature distribution of workpiece was achieved through FEM simulation. The simulation shows that cooling during welding could be effective for improving the joint mechanical properties by decreasing peak temperature and heat exposure time.
TABLE OF CONTENTS Page
INTRODUCTION ...1
CHAPTER 1 LITERATURE REVIEW ...3
1.1 Historical Development of Al-Li alloys ...3
1.1.1 First generation of AL-Li alloys ... 3
1.1.2 Second generation of aluminum- lithium alloys ... 4
1.1.3 Third generation of aluminum- lithium alloys ... 5
1.2 Friction Stir welding process ...9
1.2.1 Welding joint zones ... 10
1.2.2 Friction stir welding process parameters ... 11
1.2.3 Friction stir welding imperfections ... 25
1.2.4 Characterization of AA2198 to AA2024 joint ... 29
1.3 Base metal heat treatment and post weld heat treatment ...31
1.4 Summaries...32
CHAPTER 2 EXPERIMENTAL PROCEDURES, MATERIALS AND METHODS ...35
2.1 Introduction ...35
2.2 Tools and fixture designs ...35
2.3 Base materials ...39
2.4 Welding process ...39
2.5 Base metal heat treatment and post weld heat treatment ...40
2.6 Sample preparation ...41
2.7 Temperature measurement ...42
CHAPTER 3 TOOL SELECTION FOR JOINING AA2198 TO AA2024 ...43
3.1 Introduction ...43
3.2 Surface finish quality ...43
3.3 Microstructure and microhardness maps ...44
3.4 Tensile test ...47
3.5 Fractography ...49
3.6 Nugget size and material flow ...50
3.7 Conclusions ...50
CHAPTER 4 OPTIMIZATION OF WELDING SPEED PARAMETERS ...51
4.1 Introduction ...51
4.2 Joint macrograph ...51
4.3 Microhardness map ...52
4.4 Mechanical response ...53
4.5 Conclusions ...55
CHAPTER 5 INFLUENCE OF POST WELD HEAT TREATMENT ON MECHANICAL PROPERTIES OF AA2024 AND AA2198 JOINT ...56
5.2 Joint macrograph ...56
5.3 Microhardness maps ...57
5.4 Mechanical response ...58
5.5 Fractography ...59
5.6 Digital image correlation ...61
5.7 Temperature measurement ...62
5.8 Discussion ...64
5.9 Conclusions ...65
CHAPTER 6 SIMULATION OF FRICTION STIR WELDING ...67
6.1 Introduction ...67
6.2 Numerical details ...67
6.2.1 Simulation assumptions ... 67
6.2.2 Computational domain and grid generation ... 68
6.2.3 Numerical equations ... 70
6.2.4 Boundary and initial conditions ... 72
6.3 Results and discussion ...74
6.4 Conclusions ...79
CONCLUSIONS...81
RECOMMENDATIONS ...83
LIST OF TABLES Page
Table 1.1 The earliest industrial application of first generation of Al-Li alloys ...4
Table 1.2 The 2nd generation of AL-Li alloys which were prosed as a substitution of conventional aluminum alloys (Roberto & John, 2012) ...4
Table 1.3 The advantage and limitation of 2nd aluminum alloys ...5
Table 1.4 Nominal Composition of Al-Li Alloys (Wt%) (Rioja & Liu, 2012) ...6
Table 1.5 Optimal welding conditions for 2198 and 2024 similar FSWed joint ...17
Table 1.6 Tensile properties of the welded joints and 2198-T851 base metal in different direction (Le Jolu et al., 2014) ...28
Table 1.7 Tensile mechanical properties of 2024 and 2198 aluminum alloys ...31
Table 2.1 Selected tool profiles for the design of different tools. ...37
Table 2.2 Selected dimensions for FSW tool design (*PT = plate thickness = 3.2 mm). ...38
Table 2.3 Chemical compositions of AA2024 and AA2198 alloys in wt.% (Bussu & Irving, 2003; Chen, Madi, Morgeneyer, & Besson, 2011). ...39
Table 2.4 Welding speed parameters. ...40
Table 2.5 The summarized codes and their discretion used for samples. ...41
Table 3.1 Defects produced as a result of tool design related to bead on plate of AA2024. ...45
Table 3.2 Relation between pin profile and joint cross-section area. ...50
Table 4.1 The microhardness of samples F1 and F4 at different locations of the joint. ...53
Table 4.2 The size of Z3 zone at different welding traverse speed. ...53
Table 5.1 Average mechanical properties of FSW joints in as welded and post weld heat treated conditions. ...59
Table 5.2 Maximum temperate in different locations of the sample AW-T3. ...64
Table 6.1 Computational domain details ...68
Table 6.3 Yield strength of AA2024 at different temperatures (Lipski & Mroziński, 2012). ...74 Table 6.4 Maximum HAZ width in different welding condition. ...77
LIST OF FIGURES Page Figure 1.1 Schematics of precipitates geometry and location in the 3rd generation
Al-Li alloys (Prasad et al., 2013) ...7 Figure 1.2 Dark-field TEM images of precipitates in 3rd generation Al-Li alloys ...7 Figure 1.3 Three dimensional microstructures: a) AA2024-T3 , b) AA2198-T3 ...8 Figure 1.4 Mechanical properties variation of 2198 alloy at different ageing
temperatures: a) Yield strength (YS), Ultimate strength (UTS) and
elongation and b) Hardness as a function of aging temperature ...9 Figure 1.5 Schematic of friction stir welding process (Sattari et al., 2012) ...10 Figure 1.6 Different welding zones as a result of FSW process (Sattari et al., 2012) ...11 Figure 1.7 Input parameters affecting the FSW process and the resulting output
parameters (De Backer, 2014) ...12 Figure 1.8 Process map of FSW for determining hot and weld cold conditions ...14 Figure 1.9 Percentage defect (%D) versus tool traverse speed and tool rotation
speed: a) Surface plot and b) Contour plot (Mastanaiah et al., 2016) ...15 Figure 1.10 Response 3-D contour plots and clustered column showing the relation
between the independent variables and the ultimate strength: a)
rotational speed, b) traverse speed (Hasan et al., 2016) ...15 Figure 1.11 Schematic of the FSW tools (Mishra & Ma, 2005) ...18 Figure 1.12 different types of FSW/P tools; a) fixed, b) adjustable and c) bobbin
type tools (YN Zhang et al., 2012) ...18 Figure 1.13 The effect of different tool designs on tensile tests (Salari et al., 2014) ...19 Figure 1.14 Different FSW tool geometries used by (Mohanty et al., 2012) ...20 Figure 1.15 Stress–strain curves of the joints between AA7075-AA6061 using the
five different pin designs such as cylindrical and tapered, smooth and
threaded, flatted ...20 Figure 1.16 Effect of shoulder designs, resulted finishing surface and weld
Figure 1.17 Different shoulder designs and resulted surface finish: a) recessed fan shoulder, b) shoulder with circular cavity around pin, c) flat shoulder
(Scialpi et al., 2007) ...23 Figure 1.18 Development of weld defect free joint as a function of the shoulder
interaction with the base material (K. Kumar & Kailas, 2008) ...25 Figure 1.19 The most common defects of FSW process (Lohwasser & Chen, 2009) ...26 Figure 1.20 Schematic drawing of (a) ‘‘sound’’ welds, (b) welds bearing a joint
line remnant, (c) welds bearing a kissing bond, (d) welds with a gap left between the parent sheets (Le Jolu et al., 2014) ...27 Figure 1.21 The fatigue strength of AA2198 base metal, defect free joint, and
joints contain different defects (Le Jolu et al., 2015) ...28 Figure 1.22 The macrograph of joint between AA2198 and AA2024 with higher
magnification of different zones (Robe et al., 2015) ...29 Figure 1.23 Macrograph of the dissimilar joint at various CWD-WD sections
showing the presence and the vanishing of banded macrostructures: (a) at 150 μm underneath the top surface, (b) at 250 μm underneath the top surface, (c) at 450 μm underneath the top surface (Texier et al., 2016) ...30 Figure 1.24 Hardness map of the surface showed in Figure 1.23-b (Texier et al.,
2016) ...30 Figure 2.1 Fixture designed for the repeatability of the FSWed joints. The welding
plate is fixed by stoppers, supporters, and clamps in the directions WD, CWD, and ND respectively. ...36 Figure 2.2 Manufactured fixture used for FSW process. ...36 Figure 2.3 Design of the different tool configurations: (A) Flat shoulder with
conical pin, (B) Raised spiral shoulder with stepped conical pin, (C) Raised fan shoulder with stepped conical pin, (D) Raised fan shoulder with threaded cylindrical pin, (E) Raised fan shoulder with cylindrical pin, (F) Raised fan shoulder with tapered cylindrical pin, (G) Raised fan shoulder with cubic pin. ...37 Figure 2.4 The dynamic shapes of tool E and G. The both tool have the same
profile with same dimensions during tool rotation. ...38 Figure 2.5 Experimental dissimilar friction stir welding process setup: a) Plates
size and locations of the samples extraction. b) Geometry of the
Figure 3.1 Surface morphology related to bead on plate of AA2024 material produced by tools A, B, and C. The spiral (tool B) and fan (tool C)
shoulders prevent weld flashes. ...44 Figure 3.2 Defects produced by tool A in the bead on plate welds : a) tunneling
defect b) LOP defect. ...45 Figure 3.3 Cross-section observations of samples E1, F1, and G1 produced with
tool E, F, and G (Figure 2.3): a) nugget region delimited with yellow solid lines on CWD-WD cross-section where the different colors resulting from etching are denoted zones Z1, Z2, and Z3. b)
Corresponding microhardness maps showing minimal hardness values in Z2 zone, shoulder affected area, and TMAZ on the AA2198
(retreating) side. ...46 Figure 3.4 a) Cross-section optical metallography images of samples F1, a) Z1/Z2
boundary, b) inside Z2 and c) inside Z3. Zone Z2 and Z3 have coarser grain size than zone Z1 while there is not significant grain size
difference between zones Z2 and Z3. ...47 Figure 3.5 Mechanical properties of FSW joints produced by tool E, F and G at
750 RPM and 50 mm/min. The joint produced with tool F demonstrated higher mechanical strength and elongation. ...48 Figure 3.6 Fracture locations after monotonic tensile tests found in the middle of
the joint or on the advancing side in the TMAZ. a) sample F1, b) sample G1. The fracture locations correspond to the locations with
lowest hardness values in Figure 3.3-b. ...48 Figure 3.7 Typical fractography micrographs observed by SEM after monotonic
tensile tests. a) sample F1 with a fracture in the middle of the joint, b) higher magnification from a, c) sample G1 with a fracture on the advancing side in the TMAZ of AA2198, d) higher magnification from c. 49
Figure 4.1 Cross-sectional macrographs of joints produced by tool F with parameters of Table 2.4. The tunneling defect was found only in the joint F6 with highest rational speed (1000 RPM) and highest traverse
speed (450 mm/min). ...52 Figure 4.2 Two dimensional hardness map across the ND-CW section through the
weld joints of samples F1, F2 and F4. Higher welding speed increases
the general hardness of joint. ...53 Figure 4.3 Mechanical properties of FSW joints produced by tool F according to
parameters of 750 RPM and 450mm/min produced the joint with
highest yield strength. ...54 Figure 5.1 Cross-section observations in CWD-ND plane of as-welded samples:
a)AW-T3 and b)AW-T8. The both micrograph are similar and S shape zone with lighter color can be seen in the center of nugget. ...57 Figure 5.2 Two dimensional hardness map across the ND-CW section through the
weld joint: a) AW-T3 b) PW-T8 c) PRPW-T8 and d) AW-T8. The red lines are fracture locations. ...58 Figure 5.3 Mechanical properties of FSW joints in as welded and post weld heat
treated conditions. ...59 Figure 5.4 Fractography micrographs observed by SEM after monotonic tensile
tests of as-welded and post weld heat treated samples: a) AW-T3 (location: TMAZ of AA2198) b) PW-T8 T3 (location: TMAZ of AA2024) c) PRPW-T8 T3 (location: TMAZ of AA2024) d) AW-T8 T3 (location: TMAZ of AA2198) ...60 Figure 5.5 SEM back scattered images of fracture surface for heat treated samples
by SEM after monotonic tensile tests. a) PW-T8 b) PRPW-T8 ...61 Figure 5.6 Local in-plane strain distribution obtained with DIC. The strain
localization for as-welded samples are same (nugget center and AA2198 TMAZ/HAZ) while applying post weld heat treatment
changed the strain localization to AA2024 TMAZ. ...62 Figure 5.7 Temperature measurement of TMAZ and HAZ during FSW process. a)
TMAZ-thermocouple is located on weld edge. b) HAZ- thermocouple
is located 2mm far from weld edge. ...63 Figure 6.1 Work price geometry and meshing around the pin area. The dimensions
are millimeter. ...69 Figure 6.2 Schematic representation of velocity field as a result of traverse speed
and rotational speed. ...70 Figure 6.3 Temperature distribution of workpiece in different welding traverse
speed and same rotational speed of 750 RPM with and without cooling: a) 50 mm/min b) 450 mm/min c) 450 mm/min with cooling ...76 Figure 6.4 The comparison of measured and simulation thermal history of a point 2
mm far from the shoulder (HAZ,750 RPM, 50 mm/min) . ...78 Figure 6.5 The effect of welding traverse speed on thermal history of a point on the
Figure 6.6 The effect of welding traverse speed and cooling jet of liquid CO2 on thermal history of a point on the edge of shoulder (TMAZ) in the
LIST OF ABREVIATIONS
AA Aluminum Alloy FSW Friction Stir Welding FEM Finite Element Method HAZ Heat Affected Zone
TMAZ Thermal Mechanical Affected Zone PWHT Post Weld Heat Treatment
UTS Ultimate tensile strength LOP Lack of penetration YS Yield strength
LIST OF SYMBOLS 0C Degree Celsius µm Micrometer Cm Centimeter HI Heat Index KJ Kilo joule MPa Mega Pascal
mm millimeter
nm Nanometer
T Temperature T Time
INTRODUCTION
Aerospace industry always is looking for decreasing the weight and increasing the strength of aeronautic structures. 3rd generation Al-Li alloys e.g. AA2198 have highly desirable combinations of specific properties compared to their conventional counterparts, e.g. AA2024 which is a high demanded raw material for aeronautic structures. AA2198 is superior to AA2024 in high cycle fatigue (HCF) and fatigue strength. AA2198 has the capability to absorb between 2 to 3 times more energy to fracture in comparison to AA2024 for the same normalized applied stresses (Alexopoulos, Migklis, Stylianos, & Myriounis, 2013; Dursun & Soutis, 2014) that makes Al-Li alloys as good replacement for conventional aluminum alloys. However, they are relatively expensive. Therefore, an economical solution is to use hybrid designs with AA2198 alloys only for critical regions, while the remaining structure retain AA2024 alloys. In order to produce hybrid structures containing last generation and conventional aluminum alloys; a joining method is required. Unfortunately, conventional fusion welding methods cannot be used because of the fact that they produce welding defects, such as hot cracking (Handbook & Welding, 2005). The solution is to use a solid-state welding technique such as friction stir welding (FSW). FSW process is commercialized very well in both automobile and aerospace industry, e.g. it is currently used as an alternative to riveting for the assembly of airplane fuselages (Lohwasser & Chen, 2009). Therefore, FSW is an appropriate process for joining of AA2024 to AA2198. The goal of this study is the mechanical properties improvement of hybrid structures made by friction stir welding between AA2198 and AA2024 materials. Different tool designs, welding speed parameters, base metal heat treatment (T8 and T3), post weld heat treatment and the possibility of using active cooling during welding were investigated in order to improve the mechanical properties of the joint.
CHAPTER 1 LITERATURE REVIEW 1.1 Historical Development of Al-Li alloys
Aluminum alloy 2024-T351 plates were used for the lower wing skin of airplanes for many years (Cantor, Assender, & Grant, 2015). A research for conventional aluminum alloys replacement by aluminum-lithium material was started by Alcoa and Bombardier in order to decrease the weight and increase inspection interval (Giummarra, Thomas, & Rioja, 2007). The material substitution selection for 2024-T351 is important to decrease fuel consumption and maintenance cost. The fatigue crack growth (FCG) is the most important material properties for determining the inspection interval (Giummarra et al., 2007). The result of this study showed using aluminum-lithium alloy, e.g. 2199-T8E79 can decrease the airplane weight up to 25 percent over the 2024-T351 material. Composite forecasts & consulting LLC has calculated that decreasing just one pound of an aircraft weight could save between 440 to 700 $ per year for jumbo jets through decreasing annual fuel consumption. It shows how much is the importance of 2024-T351 replacement by AL-Li alloys. There are more details about this new material in the following sections.
1.1.1 First generation of AL-Li alloys
Improvement of mechanical properties is always on demand by industry. It is possible to improve the mechanical properties of aluminum alloys by work hardening and/or precipitate hardening. Lithium has high solubility at high temperatures and its solubility decreases by lowering the temperature. It is then good element for precipitate hardening. On the other hand, lithium is a light element so it is an interesting candidate for weight reduction (Prasad, Gokhale, & Wanhill, 2013). The research on the addition of lithium to aluminum alloys started in 1920S (Roberto & John, 2012). The earliest industrial application of first generation of aluminum alloys was 1958 in Table 1.1. The first generation of aluminum- lithium alloys had low
toughness and their production was expensive due to special requirement for reaction of lithium with oxygen during casting (Prasad et al., 2013).
Table 1.1 The earliest industrial application of first generation of Al-Li alloys (Prasad et al., 2013; Roberto & John, 2012)
Alloy Li (Wt%) The application Year
2020 1.2 the wings of the Navy’s RA-5C Vigilante aircraft 1958 01420 2.1 vertical-takeoff and landing aircraft Âk36 and Âk38 and
liquid oxygen tanks
1970
1.1.2 Second generation of aluminum- lithium alloys
Research on the development of 2nd generation of AL-Li alloys started in early 1980S. Some proposed alloys are shown in Table 1.2 (Roberto & John, 2012). The 8090 alloy has the most successful application between the second generation of Al-Li alloys. It was used in European EH101 helicopters as structural components. Mostly, if any second generation aluminum-lithium alloys were used in aircraft besides the EH101 helicopter, it had been used for nonstructural, light duty applications (Cantor et al., 2015).
Table 1.2 The 2nd generation of AL-Li alloys which were prosed as a substitution of conventional aluminum alloys (Roberto & John, 2012)
Institution Conventional material 2nd generation replacement year
Alcoa 7075-T6 2090-T81 1984 Pechiney (from France) 2024-T3 2091-T8X 1985 British Aerospace Establishment 2024-T3 8090-T81 1984
In general, the preceding 2nd generation Al-Li products contained Li concentrations above 2 wt. pct. Although density reduction was clearly attractive, these products exhibited several characteristics that were considered undesirable by airframe designers. The advantage and limitation of 2nd aluminum alloys are summarized in Table 1.3 (Giummarra et al., 2007; Rioja & Liu, 2012).
1.1.3 Third generation of aluminum- lithium alloys
The shortcomings of 1st and 2nd generation of Al-Li alloys pushed the scientists to work more on the alloy design principles of Al-Li alloys and it led to the successful development and commercialization of the 3rd generation Al-Li alloys with reduced Li concentration (Alexopoulos et al., 2013). 3rd generation Al-Li alloys have less than 1.8 wt. pct. of lithium. The chemical composition of some 3rd generation of aluminum alloys is shown in the Table 1.4 sorted by the year of introduction (Prasad et al., 2013; Roberto & John, 2012). It can be seen Li content of 3rd generation of Al-Li alloys has not changed significantly during recent years, in contrast to 2nd and 1st generation. The role of each element (alloy design principles) in 3rd generation Al-Li alloys has been summarized and it goes as follow (Rioja & Liu, 2012): -Lithium and Magnesium: Age hardening, solid solution strengthening and density reduction -Copper and Silver: Age hardening and solid solution strengthening
-Zinc: corrosion enhancement and solid-solution strengthening
-Zirconium and Manganese: controller of recrystallization and texture of wrought products -Titanium: Grain refinement during ingots solidification
Iron, silicone, sodium and potassium are impurities and they have negative effect on the fracture toughness, fatigue, and corrosion (Roberto & John, 2012). It is important to understand the influence of chemical composition, geometry and location of precipitates and their role in the microstructure of 3rd generation alloys.Schematics of precipitates geometry and location in the 3rd generation Al-Li alloys is shown in Figure 1.1. T1 (Al
2CuLi), δ’ (Al3Li), and θ’-type (~Al2Cu) precipitates increase the material strength. While T1 (Al2CuLi), T2 (Al6CuLi3), β’(Al3Zr), and Al20Cu2Mn3 precipitates improve the fracture toughness. TEM micrographs of the strengthening precipitates in 3rd generation Al-Li alloys are shown in the Figure 1.2.
Table 1.3 The advantage and limitation of 2nd aluminum alloys
Advantage limitation
Higher Young modules Lower density
lower fatigue crack growth (FCG) rates and higher fatigue life
Poor corrosion resistance
Lower short-transverse fracture toughness Lower plane stress (Kc) fracture
toughness/residual Strength in sheet form Tensile properties anisotropy
Typically, cold stretching is applied on Al-Cu-Li alloys before artificial aging to increase dislocations which are low energy nucleation sites for strengthening precipitates (Deschamps, Livet, & Bréchet, 1998). The material reaches to its maximum strength when T1, δ’ and θ’ precipitates are finely dispersed (S.-f. Zhang, Zeng, Yang, Shi, & Wang, 2014).
Table 1.4 Nominal Composition of Al-Li Alloys (Wt%) (Rioja & Liu, 2012)
Year Alloys Li Cu Mg Ag Zr Mn Zn 1992 2195 1.0 4.0 0.4 0.4 0.11 - - 1997 2297 1.4 2.8 0.25 max - 0.11 0.3 0.5 max 2000 2196 1.75 2.9 0.5 0.4 0.11 0.35 max 0.35 max 2000 2098 1.0 3.5 0.5 0.4 0.11 0.35 max 0.35 max 2002 2397 1.4 2.8 0.25 max - 0.11 0.3 0.1 2003 2099 1.8 2.7 0.3 - 0.09 0.3 0.7 2004 2050 1.0 3.6 0.4 0.4 0.11 0.35 - 2005 2198 1.0 3.2 0.5 0.4 0.11 0.5 max 0.35 max 2005 2199 1.6 2.6 0.2 - 0.09 0.3 - 2010 2296 1.6 2.45 0.6 0.43 0.11 0.28 - 2011 2060 0.75 3.95 0.85 0.25 0.11 0.3 - 2012 2055 1.15 3.7 0.4 0.4 0.11 0.3 -
Figure 1.1 Schematics of precipitates geometry and location in the 3rd generation Al-Li alloys (Prasad et al., 2013)
AA2198 alloy is a good candidate from the 3rd generation of aluminum alloys. It has high mechanical properties while its damage tolerance and formability is also good (Heinz et al., 2000; Knüwer, Schumacher, Ribes, Eberl, & Bes, 2006). It has been used successfully for fuel tanks of Falcon 9 rocket (Li, Song, Guo, & Sun, 2013). Alcan developed AA2198 as a derivate of AA 2098 with lower content of copper and some minor chemistry modification for toughness optimization (Knüwer et al., 2006). It is possible to apply age hardening heat treatment on AA2198 close to net final shape, so the parts can obtain excellent combination of strength and toughness (S.-f. Zhang et al., 2014). The optical grain structure micrographs of
a) b) c)
Figure 1.2 Dark-field TEM images of precipitates in 3rd generation Al-Li alloys : a) δ’(Al3Li), b) T1 (Al2CuLi), c) θ’(Al2Cu) (Roberto & John, 2012).
rolled 2198-T3 and 2024-T3 are shown in Figure 1.3.TD, RD and ND represents traverse direction, rolling direction and normal direction. he microstructure of 2198-T3 consists in flat pancake lying in the TD-RD plane (Robe, Zedan, Chen, Feulvarch, & Bocher, 2015) while 2024-T3 has equiaxed grains in TD-RD plane.
a) b)
Figure 1.3 Three dimensional microstructures: a) AA2024-T3 , b) AA2198-T3 (Robe et al., 2015)
Zhang et. al. (S.-f. Zhang et al., 2014) have investigated the effects of ageing treatments on evolution of microstructure, properties and fracture of aluminum-lithium alloy 2198. In other words, they have compared T3 heat treatment condition with T8 heat treatment condition. T8 condition could be achieved by applying artificial aging on T3 conditions. They found out AA2198 has a considerable ageing response and its mechanical properties are very dependent to ageing temperatures due to different microstructures. Their characterization proved only the presence of ( ) in naturally aged condition (T3) while high density of precipitates appeared after T8 heat treatment. The majority of these precipitates are
( ), ( ) 1( ). Their results show that higher aging temperatures increase the density of precipitates. The main precipitates are ( ), ( ) at aging temperatures under 160 0C. The dominant strengthening phase is 1( ) above 160 C. Fracture mode changes by increasing aging temperature from a typical dimple type to a mixed
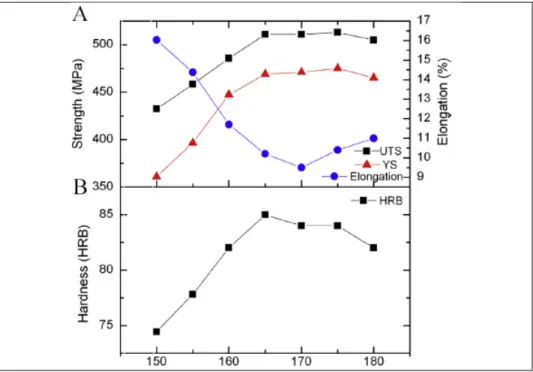
of dimple and intergranular. Mechanical properties (yield strength, ultimate strength, elongation and hardness) variation of 2198 alloy at different ageing temperatures as a function of aging temperature have been measured in their research as shown in Figure 1.4. It is clear that the effect of T8 heat treatment temperature on tensile properties of 2198 alloy is significant. Compared with the data in T3 state, all tensile strength data in T8 state get significantly increased, indicating a strong ageing response of this alloy. The optimum values for having the highest yield strength and ultimate tensile strength are 175 0C and 14 hours of aging temperature and time, respectively.
Figure 1.4 Mechanical properties variation of 2198 alloy at different ageing temperatures: a) Yield strength (YS), Ultimate strength (UTS)
and elongation and b) Hardness as a function of aging temperature (S.-f. Zhang et al., 2014)
1.2 Friction Stir welding process
Friction stir welding (FSW) is a solid-state welding technique using a rotary pin to locally mix the materials of the two sides of the joint below the melting point temperatures. There is no melting of the base material so the possibility of the cracks and porosity from liquid is eliminated. Furthermore, there is no need for filler material (Guerra, Schmidt, McClure, Murr,
& Nunes, 2002; Shigematsu, Kwon, Suzuki, Imai, & Saito, 2003). FSW has been widely utilized to join difficult to weld aluminum alloys such as AA2××× and AA7××× series. It is currently used as an alternative to riveting for the assembly of airplane fuselages (Mishra & Ma, 2005). The heat source of FSW process is provided from tool rotation and its contact with part surface. Researches show that 86% of the heat needed to reach plasticity is obtained from friction between tool shoulder and part surface, the rest being a result of plastic strain and friction between pin and part. Figure 1.5 shows schematic of the FSW process (Sattari, Bisadi, & Sajed, 2012).
Figure 1.5 Schematic of friction stir welding process (Sattari et al., 2012)
1.2.1 Welding joint zones
FSW process creates four different zones in the joint as shown in Figure 1.6 which are completely different when compared to the joints created by fusion welding process (McQueen et al., 2013; Sattari et al., 2012).
(1) Nugget or stir zone, where dynamic recrystallization completely occurred. The friction between tool shoulder with workpiece surface causes higher temperature on the top of joint compare to the bottom of joint which could causes different grain size in joint.
(2) Thermo-mechanically affected zones (TMAZ) that are located immediately on each side of the nugget. TMAZ is subjected to thermal cycles is extremely deformed. The grains of TMAZ are stretched upward in parallel to the material flow. The applied plastic deformation on this zone is not enough for recrystallization process.
(3) Heat affected zones (HAZ) which is located adjacent to the TMAZ. It experiences a thermal cycle without mechanical deformation. This zone experiences temperatures which will effect on the precipitations process.
(4) The last zone is the unaffected base material.
Retreating side Advancing side
Figure 1.6 Different welding zones as a result of FSW process (Sattari et al., 2012)
1.2.2 Friction stir welding process parameters
Choosing the right parameters of FSW process is important for producing a defect free joint and generally the parameters selection is not a straightforward work, it needs experience and knowledge. The input parameters of FSW process and resulting output parameters are shown in Figure 1.7 (De Backer, 2014). The following section explain more details about the mentioned parameters in Figure 1.7, such as tilt angle, welding speed, plunge depth and etc.
Figure 1.7 Input parameters affecting the FSW process and the resulting output parameters (De Backer, 2014)
1.2.2.1 Welding speeds
Rotational and traversal speed are two main parameters of FSW process. The material is stirred and mixed by rotation and forward movement of tool. Contribution of thermal cycle has higher importance compared to material flow for the precipitation evolution of second phase particles. Mishra et. al. (Mishra & Ma, 2005) proposed to estimate the heat input of FSW by the following formula.
=4 3
(1.1)
Where Q is the heat input per unit of length and α, P, R and μ stand for heat input efficiency, pressure of tool on the joint, shoulder radius and friction coefficient, respectively. ω and v are the rotation and traverse speeds, respectively. It can be concluded that a relatively higher ω/v ratio can increase heat input so more metal around the pin can reach plastic state, flow and deform with the pin rotation, and then recrystallize. Therefore, the areas of the weld nugget and HAZ are relatively wider with higher ratio of ω/v (Ma, Xia, Jiang, & Li, 2013).
The following experimental relationship for calculation of average peak temperature (T) was proposed (Dixit, Mishra, Lederich, & Talwar, 2009).
= ( ) (1.2)
=
× 10
(1.3)
K and A are constants and they can be calculated from experimental results, is the melting point of material. HI is heat index. There is a direct relationship between peak temperature as well as the duration of thermal cycle with HI. In other words, HI is an appropriate candidate for the depiction of average thermal profile during FSW. Generally, a cold weld is produced for HI <1.42 and generates worm hole defects in nugget; whereas, the hot cold has weaker mechanical properties (Dixit et al., 2009). Figure 1.8 shows an outline of the influence of process parameters on quality of weld, microstructure and mechanical. Highlighted region represents range of process parameters appropriate for FSW of Al-2024 (T3) alloy for attaining high tensile properties. It could be seen, combination of high traverse speed and low rotational speed produces a “cold weld” and it increases the possibility of worm hole defect (cavity). While, a combination of low traverse speed and high rotational speed produces a “hot weld” and it increases the grain and precipitates sizes (Dixit et al., 2009). The investigation of Dixit et. al. (Dixit et al., 2009) showed that heat index about 3.94 can produce a defect free joint of AA2024-T3 with highest tensile strength.
It should be noted that as the frictional coupling of tool surface with workpiece is governing the heating, it is not expected that the heating will monotonically increase with tool rotation rate, as the coefficient of friction at interface will decrease with increasing tool rotation rate (Song & Kovacevic, 2003). So, the heat input is not a simple linear function of welding speed parameters and FEM simulation is required for more precise prediction of peak temperature.
Figure 1.8 Process map of FSW for determining hot and weld cold conditions (Dixit et al., 2009)
Mastanaiah et. al. (Mastanaiah, Sharma, & Reddy, 2016) have investigated the effects of process parameters on material inter-mixing, defect formation, and mechanical properties of AA2219-AA5083 aluminum alloys joints. They have calculated the ratio between defect and joint surface versus tool rotation speed and tool traverse speed which can be seen in Figure 1.9. The area of defects increases at higher tool rotation speed and traverse speeds. They have explained that less shearing is required to transport softened material at higher temperature that causing considerable turbulence and resulting in defective welds.
a) b)
Figure 1.9 Percentage defect (%D) versus tool traverse speed and tool rotation speed: a) Surface plot and b) Contour plot (Mastanaiah et al., 2016)
The effect of the rotational speed, traverse speed were studied on dissimilar AA7075-AA6061 aluminum alloys joined by FSW (Hasan, Ishak, & Rejab, 2016) They used response surface methodology (RSM) with central composite design (CCD) for their experimental process to correlate welding properties and UTS. They found that the relationship of welding traverse speed and rotational speed with ultimate tensile strength presents an optimum value for each of them. Their results showed that 1100 RPM tool rotation speed, 300 mm/min traverse speed are the optimum value to create the stronger joint.
a) b)
Figure 1.10 Response 3-D contour plots and clustered column showing the relation between the independent variables and the ultimate strength: a) rotational speed, b)
Bitond et al. (C. Bitondo et al., 2010) studied the effect of FSW parameters on mechanical properties of AA2198-T3 joints and its optimization by a full-factorial experimental design using analysis of variance (ANOVA). They considered tool rotational speed and welding traverse speed as analysis factors and ultimate tensile strength (UTS) and yield strength (YS) for the response of their analysis. They observed that greater mechanical performance can be achieved by welds produced in cold conditions. UTS depends strongly on rotational speed and for lower value of rotational speed the greater values of UTS are achieved, while YS increases with weld traverses speed.
Bitond et al. (Bitondo, Prisco, Squilace, Buonadonna, & Dionoro, 2011) developed an empirical models based on regression analysis to predict FSW joint mechanical properties, as a function of the rotational and traverse speeds for rolled plates of AA2198 T3 aluminum alloy in particular yield and tensile strength. They did not investigate the metallurgical aspect of joints e.g. the defects such as JLR, kissing bond, tunneling cavity and microstructure of weld joint which is important for fatigue properties of material.
The advised parameters and the correspond optimum YS and UTS from difference researches for joining similar 2024 and similar 2198 FSW joint are shown in Table 1.5. It can be observed that the optimized rotational speed for joining AA2024 is approximately the same as the advised parameters for joining AA2198. The optimized traverse speed is lower for AA2024 than AA2198 and it can be a challenge for welding AA2198 to AA2024.
Table 1.5 Optimal welding conditions for 2198 and 2024 similar FSWed joint Material Optimize desirability ω v YS UTS Reference 2198-T3 YS and UTS
500 300 252 354 (Bitondo, Prisco, Squillace, Giorleo, & Buonadonna, 2010) 2198-T3 YS and UTS 531 300 253 348 (Bitondo et al., 2011) 2198-T851 Flawless joint
1200 480 290 420 (Le Jolu et al., 2014; Le Jolu, Morgeneyer, & Gourgues-Lorenzon,
2010)
2024-T351 UTS 750 73 - 395 (Radisavljevic, Zivkovic, Radovic, & Grabulov, 2013)
2024-T351 UTS 750 93 - 355
2024-T351 UTS 1180 116 - 398
2024-T3 UTS 500 50 - 370 (Eramah et al., 2014)
2024-T351 YS 560 20 296 - (Anil Kumar, Karur, Chipli, & Singh, 2015)
2024 YS and
UTS
500 80 - - (Kasman, 2016)
ω= rotational speed (RPM), v=welding advancing speed (mm/min), YS=Yield strength (MPa), UTS=ultimate tensile strength (MPa).
1.2.2.2 Tilt angle
The tool tilt angle with respect to the surface of workpiece is another welding parameter. An appropriate tilt angle ensures that the shoulder of the tool holds the surface material and moves it efficiently to the back of the shoulder. In most cases a tilt angle of about 3 degree is advised (Rai, De, Bhadeshia, & DebRoy, 2011; YN Zhang, Cao, Larose, & Wanjara, 2012).
1.2.2.3 FSW tool design
The FSW tool has the responsibility of localizing the heating and material flow. Furthermore, tool design governs the joint microstructure uniformity, mechanical properties and process loads, so its design is important (Mishra & Ma, 2005).
FSW tool composed of shoulder and pin as shown schematically in Figure 1.11. The pin of FSW tool can be fixed or adjustable. Another shoulder can be added to the tool in order to
cover the bottom of joint. This kind of tool with two shoulder is named bobbin tool. All of these tools are illustrated in Figure 1.12. (YN Zhang et al., 2012).
Figure 1.11 Schematic of the FSW tools (Mishra & Ma, 2005)
Figure 1.12 different types of FSW/P tools; a) fixed, b) adjustable and c) bobbin type tools (YN Zhang et al., 2012)
1.2.2.3.1 Pin profile
Salari et al. (Salari, Jahazi, Khodabandeh, & Ghasemi-Nanesa, 2014) studied the influences of different design elements such as combination of the conical and cylindrical pin, threaded pin, stepped pin on mechanical properties of AA5456 aluminum alloy in lap joint configuration by FSW process. Four different tool pin profiles were used as show in Figure 1.13. They have used a pin diameter equal to plate thickness. Tensile test showed adding stepped feature to the
pin can improve the mechanical properties while tool with triflute pin creates tunneling defect and shows the lowest mechanical properties. Furthermore, Shude et. al. (Ji et al., 2013) have showed a tool with a half-screw pin improves material flow behavior during friction stir welding and avoid root flaws. In both researches, changing of design in the middle of pin helps material flow in the mid thickness of the joint.
Figure 1.13 The effect of different tool designs on tensile tests (Salari et al., 2014)
Amirafshar et. al (Amirafshar & Pouraliakbar, 2015) have studied different designs of tool for joining ST14 structural steel and they have concluded that the cubic pins compared to cylindrical and conical pin create smaller nugget grain size and higher nugget hardness while cubic pin has the maximum tool wear. In a similar research (Mohanty, Mahapatra, Kumar, Biswas, & Mandal, 2012), aluminum joints manufactured with three pin designs as shown in Figure 1.14 were studied to find the best design. It was observed that use of a tapered cubic pin (trapezoidal) and tapered cylindrical pin instead of straight cylindrical tools does not necessarily improve joint mechanical properties for commercial grade aluminum alloys. Besides, tapered pin is less plunging force of the tool at the starting point of the process. The reason of no difference in mechanical properties is not mentioned clearly. In other research (Hasan et al., 2016), five tools with concave shoulders and different pin profiles (cylindrical and tapered, smooth and threaded, flatted and non-flatted) were used for joining AA7075-AA6061 aluminum alloys showing that the most influential factor on the tensile strength and
material mixing is tool design. Tool with tapered probe and additional features such as threads and flat can produce defect free weld with smooth surface finish, material mixing and high tensile strength. On the other hand, smooth cylindrical or even tapered pin result in poor material mixing which cause lower joint strength. They just mentioned the effect of tool design on ultimate tensile strength, so the effect of tool design on the joint yield strength, which is more important parameter for engineering application, is not clear.
Figure 1.14 Different FSW tool geometries used by (Mohanty et al., 2012)
Figure 1.15 Stress–strain curves of the joints between AA7075-AA6061 using the five different pin designs such as cylindrical and tapered, smooth and threaded, flatted
1.2.2.3.2 Shoulder profile
There are three possibilities for shoulder design which are flat, convex and concave profiles. Concave shoulder profile feed the material into the tool shoulder cavity. Hence the concave surface serves as an escape volume or reservoir for the displaced material during welding. The proper, application of concave requires the tilting angle around 3 degrees. In the case of welding machine limitation for creating tilt angle, flat shoulder could be useful. The both flat and convex produces a lot of flash defect because they push the material away from the tool. In order to avoid the flash defect, excessive features such as scroll or groove could be useful. (YN Zhang et al., 2012).
Trueba et al. (Trueba Jr., Heredia, Rybicki, & Johannes, 2015) studied the effect of shoulder features on mechanical properties and surface finish of AA6061-T6 joint. They designed six different tool shoulders in order to improve the metal constraint and flow to the pin. Their shoulder designs had a fan shape could be recessed, raised or ramped in relation to the shoulder surface. Their studies proved that raised fan shoulder (tool C) have the maximum capability for manufacturing defect free welds with perfect finishing surface even under non-ideal welding parameters. Their shoulder designs, resulted finish surface and weld macrograph are shown in Figure 1.16. In similar research (Scialpi, De Filippis, & Cavaliere, 2007), the effect of different shoulder geometries (Figure 1.17) on the mechanical and microstructural properties of a friction stir welded 6082 aluminum joints were investigated. It can be seen, the shoulder with a cavity around pin has less flash defect and highest mechanical properties. However, more flash and low mechanical properties of the joint is related to the flat shoulder profile.
Figure 1.16 Effect of shoulder designs, resulted finishing surface and weld macrograph (Trueba Jr. et al., 2015)
a) b) c)
Figure 1.17 Different shoulder designs and resulted surface finish: a) recessed fan shoulder, b) shoulder with circular cavity around pin, c) flat shoulder (Scialpi et al., 2007)
1.2.2.3.3 Tool dimensions
The highest fraction of heat during FSW process is generated by the shoulder and the material should be sufficiently softened for flow by tool. Therefore, shoulder and pin dimensions are important (Rai et al., 2011). The following relationships for calculating the pin and shoulder diameter is proposed by Zhang et. al (YN Zhang et al., 2012) as a function of sheet thickness. They have proposed this formula on the basis of data collected from literature on 53 joints made from various materials includes Al, Mg, Cu, Ti, Ni and steel material.
= 2.2 ∗ Plate thickness (mm) + 7.3 (1.4) = 0.8 ∗ Plate thickness (mm) + 2.2 (1.5) It can be seen, the thicker workpiece requires a larger shoulder for higher heat input generation which is required for moving larger material around pin.
Furthermore, recent research on the effect of shoulder to pin diameter ratio on microstructure and mechanical properties of dissimilar friction stir welded AA2024-T6 and AA7075-T6 aluminum alloy joints concluded that the optimum ratio between shoulder and pin diameter is around three (Saravanan, Rajakumar, Banerjee, & Amuthakkannan, 2016).
1.2.2.4 Plunge depth
The plunge depth of tool is important for creating defect free welds with flat shoulders. When the plunge depth is too low, the shoulder of the tool has not enough contact with the workpiece surface, Thus the stirred material cannot move well from the front to the back of the pin by rotating shoulder, resulting in generation of welds with surface lack of fill or tunneling defect. On the other hand, deep plunging creates excessive flash (Mishra & Ma, 2005). Kumar et. al. (K. Kumar & Kailas, 2008) studied influence of the tool plunge depth on the quality of FSW joints, they designed an experimental process where the plunge depth of the tool was continuously was increasing during FSW process . The normal force was measured during process and then the joint macrograph was obtained by metallography at different welding normal forces. Figure 1.18 shows the cross-sections of the joint produced at various tool plunge depth. The experiments showed that normal forces increase by increasing plunge depth. The defect size was reduced by increasing the tool plunge depth. Figure 1.18-f shows normal load higher than 7.4 kN can remove defects thanks to sufficient shoulder contact with the base material. Their study shows the importance of appropriate plunge depth and normal force.
Figure 1.18 Development of weld defect free joint as a function of the shoulder interaction with the base material (K. Kumar & Kailas, 2008)
1.2.3 Friction stir welding imperfections
Imperfection is any deviation from the ideal weld, while defect is an unacceptable imperfection. Welding imperfections are classified according to ISO 6520 ("ISO 6520: Classification of geometric imperfections in metallic materials," 1998) while their acceptable limits are specified in ISO 5817 ("ISO 5817: Welding -- Fusion-welded joints in steel, nickel, titanium and their alloys (beam welding excluded) -- Quality levels for imperfections," 2014) and ISO 10042 ("ISO 10042: Welding -- Arc-welded joints in aluminium and its alloys -- Quality levels for imperfections," 2005). Both mentioned standards are applicable for fusion welding processes and most of defects in conventional welding processes are related to the solidification process. As the basis of FSW process is solid state material flow thus the nature of defects is different compared to the conventional welding processes (Mishra & Ma, 2005).
Most common defects of FSW process are shown in Figure 1.19. It is crucial to expand the knowledge boundaries about FSW process defects and their effect on joint mechanical properties.
Figure 1.19 The most common defects of FSW process (Lohwasser & Chen, 2009) Zhoe et al (Zhou, Yang, & Luan, 2006) have compared the fatigue strength of defect free FSW joints with defective joints containing joint line remnant (JLR or oxide entrapment in Figure 1.19) and kissing bond defects. They concluded that the fatigue strength of AA2024 flawed joint decreased by 55% compared to defect free joint. However, they used the published data for fatigue strength of defect free joints so their conclusion may be not accurate because the welding parameters of literature are different and maybe is related to deferent micro-structure due to different heat input history during FSW process. Jolu et al. (Le Jolu, Morgeneyer, Denquin, & Gourgues-Lorenzon, 2015) worked on effects of defects on fatigue lifetime and tearing resistance of AA2198 AL-Cu-Li alloy friction stir welds. In their research, four series
of FSW joints were prepared. (1) Bead on plate (2) FSW on two plates which creates JLR defect due to the surface oxide (3) FSW with short pin on two plates which creates JLR and Kissing Bond defect due to lack of penetration and (4) FSW on two plates with 0.7 mm gap between the plates with short pin which creates JLR, Kissing bond and cavity (Le Jolu et al., 2014) Their results showed that kissing bond and JLR have not a significant effect on fatigue properties but the joints with a gap cause a significant decrease of fatigue strength (about 30%) as shown Figure 1.21. The results have a good agreement with Kadlec’s research (Kadlec, Růžek, & Nováková, 2015) who worked on FSW of AA 7475 FSW joint. Also Kadlac (Kadlec et al., 2015) have found kissing bond and JLR do not affect significantly the tensile strength and yield strength but these defects decrease the elongation especially in specimens where the crack initiation site is the kissing bond. This result is in agreement with the result of Jolu et al. (Le Jolu et al., 2015) shown in Table 1.6.
Figure 1.20 Schematic drawing of (a) ‘‘sound’’ welds, (b) welds bearing a joint line remnant, (c) welds bearing a kissing bond, (d) welds with a gap left between the parent
Figure 1.21 The fatigue strength of AA2198 base metal, defect free joint, and joints contain different defects (Le Jolu et al., 2015)
Table 1.6 Tensile properties of the welded joints and 2198-T851 base metal in different direction (Le Jolu et al., 2014)
YS
(MPa) (MPa) TS Elongation Efficiency Ratio Fracture Locus Base metal (TD) 470 515 10.0 - - sound 282 to 302 412 to 429 19.5 to 22.4 80 to 83 TMAZ (RS) JLR-
bearing 285 to 296 413 to 416 15.7 to 17.5 80 TMAZ (RS) in two cases, TMAZ (AS) in one case KB-
bearing 265 to 287 398 to 410 14.2 to 19.5 77 to 80 weld nugget, starting from KB Gap0.7 277 to
281 398 to 399 14.8 to 15.4 77 weld nugget, starting from ‘‘sensitive GBs’’ 180 210 240 270 300 330 360 390 420 10000 100000 1000000 10000000 ∆σ (MPa)
Fatigue Cycles to fracture N
Base Metal Defect Free Joint
Joint Line Remnant Defect Kissing Bond Weld With Gap
1.2.4 Characterization of AA2198 to AA2024 joint
Microstructural and mechanical characterization of AA2198-T3 and AA2024-T3 joint produced by FSW process, have been investigated by Robe et. al. (Robe et al., 2015). The joint macrograph is shown in Figure 1.22. It can be seen that the nugget is divided into two different zones by S shape border. It was observed left side of S shape border (AA2024-RS) has smaller grain size compare to right side (AA2198-AS). Besides, EDS analysis showed the difference in the magnesium content of the two sides on the border, proving that the nugget is non-mixed. It means a special tool design for a complete mixing between AA2024 and AA2198 is required.
Figure 1.22 The macrograph of joint between AA2198 and AA2024 with higher magnification of different zones (Robe et al., 2015)
In another research (Texier et al., 2016) on the same joint (AA2198-T3 to AA2024-T3), the near surface mechanical heterogeneities of weld has been investigated in CWD-WD plane (Figure 1.23) within the nugget region. The banded microstructure is disappearing by going from top to bottom in normal direction (ND) due to the reduced effect of the shoulder. The band distance along welding direction (WD) is equal to the tool movement in welding direction per tool revolution. This banded structure is not the fracture origin in tensile test, but it could make a weakness point for fatigue strength. The fatigue properties of joint are not examined in the mentioned research.
Figure 1.23 Macrograph of the dissimilar joint at various CWD-WD sections showing the presence and the vanishing of banded macrostructures: (a) at 150 μm underneath the top surface, (b) at 250 μm underneath the top surface, (c) at 450 μm underneath the top surface
(Texier et al., 2016)
Hardness map of the surface at the top of the weld is shown in Figure 1.24. The minimal hardness is located out of the nugget region on the advancing side at the TMAZ region (AA2198) which is fracture location. Also, digital image coloration (DIC) measurement shows strain localization is located at crack location (Robe et al., 2015). So, special consideration should be taken for AA2024 and AA2198 joint, in order to solve the low hardness problem of AA2198 at advancing side e.g. post weld heat treatment to recover the loss of mechanical properties of AA2198.
1.3 Base metal heat treatment and post weld heat treatment
Many researches on FSW joints showed that the elongations of as-welded joints are only between 20 to 40% of the base metal elongation (Hu, Yuan, Wang, Liu, & Huang, 2011). Using post weld heat treatment (PWHT) could be effective for improving joint mechanical properties. The PWHT can be solution heat treatment and then precipitation or just aging treatment in order to recover the loss of mechanical properties in the joint zone. A few studies on the PWHT of FSW aluminum alloys such as dissimilar joint AA2024 and AA 7075 or similar joint such as 7449 , 6061-O , 2219-O and 2024-T4 showed that the PWHT recovered a large portion of the lost strength in the nugget, but it comes with loss of ductility (Hu et al., 2011; Muruganandam, Raguraman, & Kumaraswamidhas, 2015). The investigations have proved that the fine recrystallized grains of nugget are instable and they become coarse grain structures after PWHT through abnormal grain growth (AGG) (Aydın, Bayram, & Durgun, 2010; Charit & Mishra, 2008; Sullivan & Robson, 2008).
The selection of heat treatment cycles for aluminum alloys depends on the predefined requirements of the aeronautical structures. T3 (solution heat treated, cold worked, and naturally aged) and T8 (Solution heat treated, cold worked, and then artificially aged) are two common heat treatment for aluminum alloys (Hunsicker, 1984). The mechanical properties of AA2024 and AA2198 in both T8 and T3 heat treatment condition is reported in Table 1.7. It can be seen that T8 condition is more appropriate for higher strength application than T3 condition due to higher values of yield strength. It should be noted that applying artificial aging after cold work for T8 heat treatment is expensive.
Table 1.7 Tensile mechanical properties of 2024 and 2198 aluminum alloys (Alexopoulos et al., 2013; Srivatsan, Vasudevan, & Park, 2007).
Material Heat treatment YS (MPa) UTS (MPa) Elongation (%)
AA2024 T3 391 500 19
T8 445 476 9
AA2198 T3 315 375 15
T8 469 510 14 AA2198 in T8 heat treatment condition has been used for aircraft fuselage/pressure cabins
heat treated plates and then join them by FSW process. The disadvantage of this method is the possible loss of strength in the joint area due to the high temperature of welding, which causes fracture at the TMAZ/HAZ regions of FSWed joints. In the case of dissimilar joints, this method has the advantage of applying special designed heat treatment cycle for each material. Another option is applying T8 heat treatment after welding or post weld heat treatment (PWHT). PWHT can only be a solution heat treatment and then precipitation hardening or it can be just aging treatment in order to recover the loss of mechanical properties in the joint zone. The challenge is finding an optimum post weld heat treatment suits the non-homogenized weldments.
1.4 Summaries
The goal of this research is to manufacture a defect free joint between AA2198 and AA2024 materials. The next goal of this research is the improvement of the joint mechanical properties in order to make it reliable for aerospace applications. Hence, frictions stir welding process could be used for joining of 3rd generation Al-Li alloys because it is a solid state welding process without fusion of base metal. Friction stir welding is sensitive to tool design and welding parameters for creating a reliable joint which is free of defect. It means tool design and welding parameters should be designed properly for joining of 3rd generation Al-Li alloys to conventional aluminum alloys. Wrong tool design causes welding defects such as flash, kissing bond and tunneling defects. On the other hand, inappropriate welding parameters causes low mechanical properties of the joint. The 3rd generation of Al-Li alloys are relatively new materials and there is not enough research about their appropriate FSW tool design. There is some information at literature about similar joints of 3rd generation Al-Li alloys. Also there is plenty of information about friction stir welding of conventional aluminum alloys. In contrast, there is a gap for optimized parameters of the joint between the 3rd generation Al-Li alloys to conventional aluminum alloys. This research is going to fill the existed gap of information about the appropriate tool design and right welding parameters of FSW for joining of AA2198 to AA2024. In the light of the fact that the last generation of aluminum alloys is relatively new materials and specifically AA2198 has a good response to aging heat treatment; according to the authors’ knowledge, no research on the heat treatment of dissimilar AA2024
and AA2198 joints has been reported in the open literature. So, the effect of PWHT on mechanical properties of AA2198 to AA2024 is going to studied in the current research.
CHAPTER 2
EXPERIMENTAL PROCEDURES, MATERIALS AND METHODS 2.1 Introduction
FSW is currently used as an alternative to riveting for the assembly of airplane fuselages (Mishra & Ma, 2005). However, defects can be found in the FSW joints, such as flash, tunneling, and kissing bond (Lohwasser & Chen, 2009). The key point to produce reliable joints by FSW process is to concurrently select appropriate welding tool and process parameters (Mishra & Ma, 2005). On the other hand, high strength joints are necessary for aerospace industry. Post weld heat treatment can recover the loss of mechanical properties in the joint area. The goal of this chapter is to describe the experimental process for tool selection, FSW parameters optimization and post weld heat treatment of the joint between AA2024 and AA2198.
2.2 Tools and fixture designs
A specific fixture was designed to assure the repeatability of the friction stir welding process, as shown in Figure 2.1. The welding direction, the cross-weld direction and the normal direction are denoted WD, CWD and ND, respectively. Stoppers, supporters, and clamps have been used to fix the plates in the directions WD, CWD, and ND respectively. Clamps and supporters are equipped with screws so they apply opposite force to ND and CWD directions, respectively; while there is no need to apply force in welding direction due to presence of welding force. The manufactured fixture is shown in Figure 2.2.
Figure 2.1 Fixture designed for the repeatability of the FSWed joints. The welding plate is fixed by stoppers, supporters, and clamps in the directions WD, CWD,
and ND respectively.
Figure 2.2 Manufactured fixture used for FSW process.
AISI 4340 steel hardened up to 49-HRC by quenching and tempering before machining, was selected for tool material as recommended by (YN Zhang et al., 2012). Seven tool configurations denoted from A to G in Figure 2.3 were designed and manufactured. Tool profile design for different tools has been chosen based on literature review, as shown in Table 2.1. The formulas for the calculation of the tool dimensions are shown in Table 2.2. It is worth
mentioning that tool F is a new tool design emerging from the combination of judicious tool features found in the open literature. The design of this new tool is a combination of conical and straight cylindrical pin concepts.
Figure 2.3 Design of the different tool configurations: (A) Flat shoulder with conical pin, (B) Raised spiral shoulder with stepped conical pin, (C) Raised fan shoulder with stepped conical pin, (D) Raised fan shoulder with threaded cylindrical pin, (E) Raised fan shoulder
with cylindrical pin, (F) Raised fan shoulder with tapered cylindrical pin, (G) Raised fan shoulder with cubic pin.
Table 2.1 Selected tool profiles for the design of different tools.
Profile Design Tool
Shoulder profile
Flat shoulder
(Mustafa, Kadhym, & Yahya, 2015) A Recessed spiral shoulder
(YN Zhang et al., 2012) B
Raised fan shoulder
(Trueba Jr. et al., 2015) C, D, E, F and G
Pin profile
Conical pin
(K. Kumar & Kailas, 2008) A Stepped conical pin
(Salari et al., 2014) B and C Half-screw pin
(Ji et al., 2013) D
Straight cylindrical pin
(Mohanty et al., 2012) E
New tool design F
Square pin
(Amirafshar & Pouraliakbar, 2015; Elangovan & Balasubramanian, 2008; Kamble, Soman, &
Brahmankar, 2012)
Table 2.2 Selected dimensions for FSW tool design (*PT = plate thickness = 3.2 mm). Parameter Suggested formula Used value
(mm) Types
Tool Shoulder Diameter
2.2*PT (mm) + 7.3 (YN Zhang et al., 2012)
15.8
All Pin length Up to 0.3 mm smaller than PT (Meilinger & Török, 2013) 2.7 All Max outer pin
diameter Equal to PT (Salari et al., 2014) 3.1 A, B and C 0.8*PT (mm)+2.2
(YN Zhang et al., 2012) 4.7 D, E, F and G Min-pin Diameter Equal to PT 0.5 * PT 1.6 3.1 A, B and C F The dynamic volume of a pin can be computed by it rotation around its axis e.g. rotation of tool G (cubic pin - diameter=4.7mm) around its axis generate the profile of tool F (cylinder pin - diameter of 4.7mm) as shown in Figure 2.4. The nugget size has direct relation with pin dynamic volume. Besides, The ratio between the real volume to dynamic volume of a pin defines the path for the material flow from the leading edge to the trailing edge of the rotating tool pin (Elangovan & Balasubramanian, 2008). So, calculating the real and dynamic volume of pin is helpful for material flow investigation and nugget size.
Figure 2.4 The dynamic shapes of tool E and G. The both tool have the same profile with same dimensions during tool rotation.
2.3 Base materials
Base materials AA2024-T3 and AA2198-T3 rolled sheets (thickness of 3.2 mm) were used in the present investigation. The nominal chemical compositions of these base materials are reported in Table 2.3. The microstructures of the two base aluminum alloys are already detailed in a previous study (Robe et al., 2015).
Table 2.3 Chemical compositions of AA2024 and AA2198 alloys in wt.% (Bussu & Irving, 2003; Chen, Madi, Morgeneyer, & Besson, 2011).
Alloy Cu Li Mg Ag Mn Fe Zn Si Ti Al. AA2024 3.8-4.9 - 1.2-1.8 - 0.3-0.9 ≤0.5 0.2 ≤0.5 0.15 Bal. AA2198 2.9-3.5 0.8-1.1 0.25-0.8 0.1-0.5 ≤0.5 ≤0.01 ≤0.35 ≤0.08 - Bal.
2.4 Welding process
The first goal of the present study is to find appropriate tool geometry for friction stir welding of AA2024-T3 and AA2198-T3. To ensure that the mismatch between plates edges of AA2024 AA2198 do not affect the formation of defects within the joints and any defects present would only be related to the tool design, two series of weld were preliminary produced and investigated. First weld series were made by moving the tool into a seamless AA2024-T3 sheet (i.e. bead-on plate weld). On the basis of metallography and visual examinations of the first weld series (bead-on plate), tools that produce defect free joints were selected for the dissimilar welding of AA2024-T3 and AA2198-T3 plates. Then, the tool that could create a joint between AA2024 to AA2198 with highest yield strength, would be selected as the best candidate. The bead on plate joins were done by constant welding parameters i.e. the rotation speed, the welding traverse speed, the plunge depth and the tilt angle were 750 RPM, 50 mm.min-1, 0.2 mm, and 0 degree, respectively. These selected parameters are close to the parameters recommended in references (Anil Kumar et al., 2015; Bitondo et al., 2011; Ciro Bitondo et al., 2010; Kasman, 2016; Radisavljevic et al., 2013). In order to optimize the welding speeds for selected tool, the combinations of the traverse and rotational speeds used in the present study and their related sample codes are presented Table 2.4. This combination starts from low