HAL Id: tel-01892576
https://tel.archives-ouvertes.fr/tel-01892576
Submitted on 10 Oct 2018HAL is a multi-disciplinary open access
archive for the deposit and dissemination of sci-entific research documents, whether they are pub-lished or not. The documents may come from teaching and research institutions in France or abroad, or from public or private research centers.
L’archive ouverte pluridisciplinaire HAL, est destinée au dépôt et à la diffusion de documents scientifiques de niveau recherche, publiés ou non, émanant des établissements d’enseignement et de recherche français ou étrangers, des laboratoires publics ou privés.
Applications of artificial intelligence in e-commerce and
finance
Yang Jiao
To cite this version:
Yang Jiao. Applications of artificial intelligence in e-commerce and finance. Artificial Intelligence [cs.AI]. Institut National des Télécommunications, 2018. English. �NNT : 2018TELE0002�. �tel-01892576�
Spécialité : Informatique
Ecole doctorale : Informatique, Télécommunications et Electronique de Paris
Présentée par Yang JIAO Pour obtenir le grade de DOCTEUR DE TELECOM SUDPARIS
Applications of Artificial Intelligence in E-Commerce and Finance
Soutenue le 7 Septembre 2018 Devant le jury composé de : Directeur de thèse :
Walid BENAMEUR - Professeur – Télécom SudParis Encadrant de thèse :
Jérémie JAKUBOWICZ – Maître de conférence – Télécom SudParis Rapporteurs :
Arthur CHARPENTIER – Professeur – Université de Rennes Romuald ELIE – Professeur – Université Paris-Est
Examinateurs :
Bruno GOUTORBE – Chercheur – Cdiscount.com Amel BOUZEGHOUB – Professeure – Télécom SudParis
“I visualize a time when we will be to robots what dogs are to humans, and I’m rooting for the machines”
CHAPITRE
1
REMERCIEMENTS
A l’issue de la r´edaction de cette th`ese, je suis convaincu que la th`ese est loin d’ˆetre un travail solitaire. En effet, je n’aurais jamais pu r´ealiser ce travail doctoral sans le soutien d’un grand nombre de personnes.
En premier lieu, je tiens `a exprimer mes remerciements les plus sinc`eres `a mes directeurs de th`ese monsieur J´er´emie Jakubowicz et monsieur Matthieu Cornec, pour m’avoir encadr´e sur ce sujet de recherche, pour leur disponibilit´e et pour leur patience et gentillesse tout au long de ce parcours.
Je souhaiterais aussi exprimer ma plus grande gratitude `a monsieur Bruno Goutorbe pour m’avoir guid´e sur plusieurs projets que j’ai effectu´es au sein de Cdiscount ainsi que ses multiples encouragements, notamment lors de la phase finale de cette r´edaction.
Je remercie ´egalement mes chers coll`egues `a Cdiscount pour leur accueil chaleureux `a chaque fois que j’ai sollicit´e leur aide ainsi que leur bonne humeur et des discussions tr`es int´eressantes au tour de la machine caf´e : Christelle Grauer, Romain Savidan, Maxime Danini, Yoann Diguet, Philippe Bruneau, Maxime Danini, Maxime Blanchet, Pierre Deneuville, S´ebastian Romano, Thomas Lentali, Thomas Cozien, Michel Povlovitsch Seixas, Pierre Anquetil, Damien Garaud, Stefan Duprey, Pierre Anquetil, Aziza Echa¨ıb, Marjolaine Didier, R´emy Baudou,Nicolas Per-ekrestow, Xiaolei Zheng, Emmanuel Gosse, Louis Albert, Charles-Antoine Souplet.
J’ai suivi des s´eminaires vari´es `a l’Universit´e de Bordeaux dont j’ai beaucoup appris ainsi je tiens `a remercier les organisateurs pour ces ´ev´enements tr`es ´educatifs : Adrian Richou, Boris Detienne et Alexandre Genadot.
Mes remerciements vont aussi `a Nabil Abdellaoui, Sameh Faidi, et Arto Antikainen pour notre participation ensemble aux concours data science et pour le brainstorming que nous avons men´e. Ces travaux collaboratifs m’ont permis de progresser ´enorm´ement et d’ouvrir des nouvelles
REMERCIEMENTS
perspectives de la science de donn´ee. Je remercie aussi Axel Reichwein, Paul Lhoste, Jingyi Wang, Vincent Testet, Giorgio Bona, Thierry Silbermann et Pablo Raman Sanchez Chisvert pour notre succ`es d’´equipe au Workshop d’Airbus et pour nos discussions passionnantes.
Je remercie enfin mes amis et ma famille qui m’ont beaucoup soutenus pendant la th`ese. Sans eux, rien n’aurait ´et´e possible.
R´esum´e
L’Intelligence Artificielle est pr´esente dans tous les aspects de notre vie `a l’`ere du Big Data. Elle a entraˆın´e des changements r´evolutionnaires dans divers secteurs, dont le commerce ´electronique et la finance. Dans cette th`ese, nous pr´esentons quatre applications de l’IA qui am´eliorent les biens et services existants, permettent l’automatisation et augmentent consid´erablement l’effi-cacit´e de nombreuses tˆaches dans les deux domaines. Tout d’abord, nous am´eliorons le service de recherche de produits offert par la plupart des sites de commerce ´electronique en utilisant un nouveau syst`eme de pond´eration des termes pour mieux ´evaluer l’importance des termes dans une requˆete de recherche. Ensuite, nous construisons un mod`ele pr´edictif sur les ventes quotidiennes en utilisant une approche de pr´evision des s´eries temporelles et tirons parti des r´esultats pr´evus pour classer les r´esultats de recherche de produits afin de maximiser les revenus d’une entreprise. Ensuite, nous proposons la difficult´e de la classification des produits en ligne et analysons les solutions gagnantes, consistant en des algorithmes de classification `a la pointe de la technologie, sur notre ensemble de donn´ees r´eelles. Enfin, nous combinons les comp´etences acquises pr´ec´edemment `a partir de la pr´ediction et de la classification des ventes bas´ees sur les s´eries temporelles pour pr´edire l’une des s´eries temporelles les plus difficiles mais aussi les plus attrayantes : le stock. Nous effectuons une ´etude approfondie sur chaque titre de l’indice S&P 500 en utilisant quatre algorithmes de classification `a la pointe de la technologie et nous publions des r´esultats tr`es prometteurs.
Abstract
Artificial Intelligence has penetrated into every aspect of our lives in this era of Big Data. It has brought revolutionary changes upon various sectors including e-commerce and finance. In this thesis, we present four applications of AI which improve existing goods and services, en-ables automation and greatly increase the efficiency of many tasks in both domains. Firstly, we improve the product search service offered by most e-commerce sites by using a novel term weighting scheme to better assess term importance within a search query. Then we build a pre-dictive model on daily sales using a time series forecasting approach and leverage the predicted results to rank product search results in order to maximize the revenue of a company. Next, we present the product categorization challenge we hold online and analyze the winning solu-tions, consisting of the state-of-the-art classification algorithms, on our real dataset. Finally, we combine skills acquired previously from time series based sales prediction and classification to predict one of the most difficult but also the most attractive time series: stock. We perform an extensive study on every single stocks of S&P 500 index using four state-of-the-art classification algorithms and report very promising results.
Dedicated to my parents and my wife
TABLE OF CONTENTS
1 Remerciements 4 R´esum´e 5 Abstract 6 List of Figures 9 List of Tables 11 2 Introduction 142.1 Background and motivations . . . 15
2.2 Organization of this thesis . . . 18
3 Literature review 19 3.1 Semantic search and term weighting . . . 20
3.2 Search result ranking . . . 21
3.3 Product categorization . . . 22
3.4 Stock prediction . . . 23
4 An entropy-based term weighting scheme and its application in e-commerce search engines 25 4.1 Introduction . . . 27
4.2 Problem framework . . . 28
4.2.1 Purchase data description . . . 28
4.2.2 Ranking with purchase data using similar queries . . . 29
TABLE OF CONTENTS
4.3.1 Importance of a term . . . 30
4.3.2 Mathematical framework of entropy based term weighting . . . 31
4.4 Application of the proposed scheme and experimental evaluation . . . 33
4.4.1 Entropy-based query similarity metrics . . . 33
4.4.2 Experiment setting . . . 34
4.4.3 Evaluation metric . . . 34
4.4.4 Results and analysis . . . 34
4.5 Conclusion and future work . . . 36
5 Reranking strategies based on fine-grained business user events benchmarked on a large e-commerce data set 38 5.1 Introduction . . . 40
5.2 Data set . . . 41
5.3 Reranking strategies . . . 42
5.3.1 Reranking by multivariate auto-regression . . . 44
5.3.2 Granger causality test . . . 45
5.4 Evaluation metric . . . 46
5.5 Results and discussion . . . 47
5.5.1 Analysis of the coefficients of the VAR model . . . 48
5.6 Conclusion . . . 50
6 The Cdiscount 2015 datascience.net challenge: a large e-commerce data set released to benchmark classification methods 51 6.1 Introduction . . . 53
6.2 Data set . . . 53
6.3 Description of the challenge . . . 56
6.4 Analysis of the winning contributions . . . 57
6.5 Teaching materials . . . 60
6.6 Conclusion . . . 60
7 Predicting stock movement direction with machine learning: an extensive study on S&P 500 stocks 62 7.1 Introduction . . . 64
7.2 Related Works . . . 66
7.3 Data Description . . . 67
7.5 Time Series Feature Engineering . . . 69
7.6 Experiment Setup . . . 71
7.6.1 Data Pipeline . . . 71
7.6.2 Validation Scheme . . . 71
7.7 Results and Analysis . . . 73
7.7.1 Whether stocks are self predictable? . . . 73
7.7.2 What features can we use to predict stock movement direction? . . . 75
7.7.3 What is the best model for stock movement direction prediction? . . . 76
7.7.4 What is the best validation scheme? . . . 77
7.7.5 Are there stocks more easily predictable than others? . . . 77
7.7.6 Is it possible to predict the S&P 500 index movement direction? . . . 79
7.8 Conlcusion and future directions . . . 79
8 Conclusion and Future Works 81 8.1 Summary . . . 82
8.2 Future works . . . 84
LIST OF FIGURES
2.1 Some onsite product search engines in French market1 . . . 16 2.2 Hedge funds performance comparison. Source: Eurekahedge . . . 18 4.1 Term purchase distributions of ‘hp‘ and “3050a”. On the one hand, the purchase
distribution of “hp” is extremely dispersed, which is indicated by the diversity of colors in the pie chart (a). Hence a high entropy is assigned to “hp”. “3050a”, on the other hand, has a relatively concentrated purchase distribution (b), which explains its low entropy value. . . 32 4.2 Performance comparison of entropy-based weighting and tf-idf weighting using
different basic similarity metrics. X-axis is the number of allowed recommen-dations, corresponding to the parameter r of (4.7). Y-axis is the Precision@r value. . . 35 5.1 (a) Distribution of the purchases by query; (b) cumulative percentage of purchases
associated with queries (queries generating most purchases first). . . 42 5.2 Examples of times series of number of clicks, add-to-basket and purchases per day
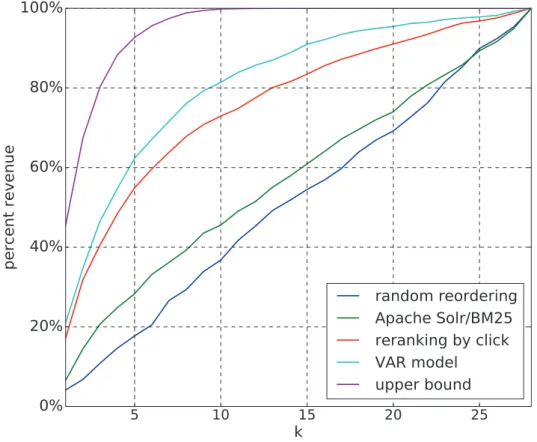
related to two different products following the user query ‘printer’. . . 43 5.3 Average percent revenue generated by the top k products (relative to the list of
28 products) of each reranking algorithm. . . 48 5.4 Normalized coefficients of the VAR model related to the number of purchases,
averaged over pairs of {query, product} and testing days, function of time lag. Shaded areas show one standard error around the mean. . . 49
LIST OF FIGURES
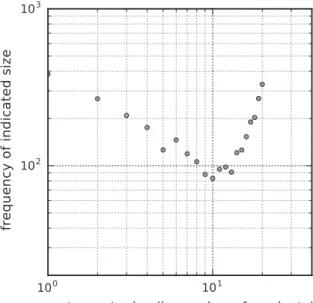
6.1 (a) Size distribution of the categories: size corresponds to the number of products belonging to a category (e.g., the point shown by an arrow indicates that there are slightly more than 100 categories which contain only 2 products). (b) Cumulative percentage of products held by the categories, sorted by the number of products they contain. (c) Recurrence distribution of the brands: recurrence corresponds to the number of products associated with a brand (e.g., the point shown by an arrow indicates that more than 3,000 brands are represented by a single product in the catalogue). (d) Recurrence distribution of the words of the vocabulary used in descriptions: recurrence corresponds to the number of products wherein a word of the vocabulary appears (e.g., the point shown by an arrow indicates
that about 105 words of the vocabulary appear in exactly 4 distinct products). . 55
6.2 (a) Recurrence distribution of the brands: recurrence corresponds to the num-ber of distinct categories containing at least one product associated with a given brand. (b) Recurrence distribution of the words of the vocabulary used in product descriptions: recurrence corresponds to the number of distinct categories contain-ing at least one product wherein a given word of the vocabulary appears. . . 56
6.3 Size distribution of the categories in the testing set: size corresponds to the number of products belonging to a category. . . 57
7.1 Daily return of Apple, Amazon and Microsoft . . . 68
7.2 Data pipeline . . . 72
7.3 Sequential split scheme. . . 73
7.4 Cross Validation Split. . . 73
7.5 Train-Validation Split. . . 73
7.6 Histogram of AUC using Random Forest . . . 74
LIST OF TABLES
4.1 A sample of purchase data log . . . 31
4.2 Purchase distributions of terms . . . 31
4.3 Examples of term entropy . . . 36
4.4 Examples of entropy-based term weighting with λ = 2 and tf-idf term weighting. Both schemes are normalized on the weight of “sony” in order to have a relative view of term importance. . . 36
4.5 Similarities with “sony black ps4” on different metrics . . . 36
5.1 Summary of the final data used in this study . . . 42
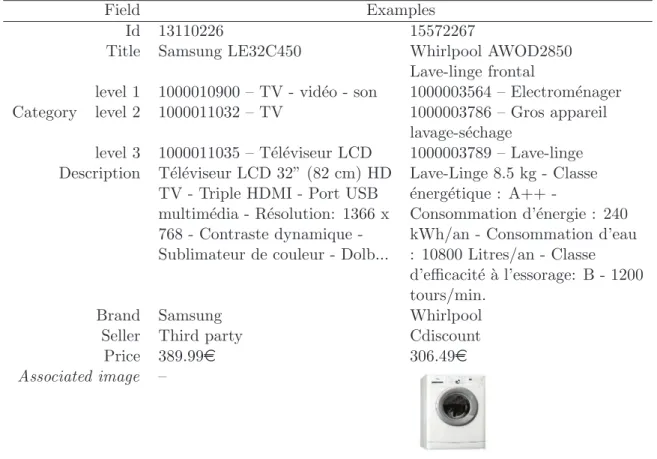
5.2 Evaluation scores of the reranking algorithms according to the revenue@k metric. 47 6.1 Fields of the data set and examples of products (with associated image). Note that the description can end with an ellipsis. . . 54
6.2 Key numbers on the data set. . . 54
6.3 Summary of the winning contributions. . . 58
7.1 Data summary . . . 67
7.2 8 global market index used as environment indicators . . . 68
7.3 Apple (APPL)’s lag features with step 1 to 3 . . . 70
7.4 Prediction evaluation of 483 stocks using random forest with sequential validation scheme. . . 74
7.5 Prediction evaluation of 483 stocks using random forest with sequential validation scheme. . . 75
7.6 Grid Searched Model Parameters . . . 76
LIST OF TABLES
7.8 Validation Schemes Comparison . . . 77
7.9 Prediction performance of top 10 stocks . . . 78
7.10 Evaluations on selected top 10 stocks using logistic regression . . . 78
7.11 Evaluations on selected top 10 stocks using logistic regression . . . 78
CHAPTER
2
INTRODUCTION
Can machines think?
Alan Turing
2.1 Background and motivations . . . 15 2.2 Organization of this thesis . . . 18
INTRODUCTION
2.1
Background and motivations
Artificial Intelligence promises to improve existing goods and services, and, by enabling automation of many tasks, to greatly increase the efficiency with which they are produced. Although “AI is still in its infancy”1, there seems to be a significant amount of entry and experimentation across numerous sectors. Within the business sphere, AI is poised to have a transformational impact. Although it has already been deployed in thousands of companies around the globe, most big opportunities have not yet been tapped. According to a study conducted by International Data Corporation2, the industries that will invest the most in AI are banking and retail. Therefore, it is of particular interest to conduct studies on AI applications in those two industries, more specifically, in finance and e-commerce which are two most technology-driven branches of both industries.
E-commerce, as a newcomer to the world, became possible only when the Internet opened to commercial use in early 90s. However it rapidly revolutionized the traditional commerce tunnel by allowing consumers to exchange goods and services with no barriers of time nor distance. Over the past decade, it has rapidly grown enabling customers to purchase any product with a click of a button. And nowadays, it has become an integral part our daily lives. In 2016, e-commerce sales reached 1.86 trillion US dollars, accounted for 8.7 percent of all retail sales worldwide and is projected to grow to 4.48 trillion US dollars in 2021, which represents 15.5 percent of all retail sales3. Nowadays, existing major platforms have evolved into large B2C and/or C2C marketplace having large inventories with up to tens of millions of products. Therefore, a key component for the success of such platforms is their ability to quickly and accurately retrieve the desired products for the customers within such large inventory. Product search and categorization, powered by AI, are two crucial services provided by these sites dealing with this issue.
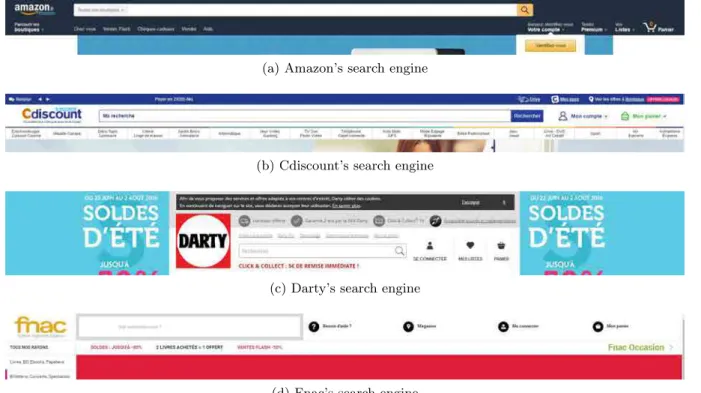
Search engines are essential for consumers to be able to make sense of these large collections of products available online. The first stage in the consumer buying process is commonly recognized to be that of the information search. The ability to collect product information and make comparisons between the different product offerings from different providers, possibly across national and currency boundaries, is often viewed as one of the main services offered by e-commerce websites. Therefore, onsite product search engine has become a salient part for most major e-commerce companies, as show in Figure 2.15. Major e-commerce website usually provide users with a simple interface with a search bar inviting them to formulate queries using
1. https://drive.tech/en/stream-content/artificial-intelligence-is-still-in-its-infancy 2. https://www.idc.com/getdoc.jsp?containerId=prUS41878616
3. https://www.statista.com/statistics/534123/e-commerce-share-of-retail-sales-worldwide/ 5. Screens captured on the 23rd June 2016
INTRODUCTION
(a) Amazon’s search engine
(b) Cdiscount’s search engine
(c) Darty’s search engine
(d) Fnac’s search engine
Figure 2.1 – Some onsite product search engines in French market4
characteristics of the product they are interested in.
Despite of its importance to e-commerce sites, product search still has room for improvement. It has been reported that there exists a mismatch between user issued queries and seller provided product description where both use different terms to describe the same concepts (Li et al., 2014; Nurmi et al., 2008). Thus, there is an urgent need for better semantic matching methods. Moreover, product search is quite different from other entity finding task such like books, people, groups etc. First, product search engines only operate within a single domain. Second, user queries in product search consist of free-form text as opposed to the semi-structured queries with additional type or relational constraints being used. Third, products are often associated with significant amount of user data, such as purchase history and review, which could provide additional information to the search algorithm.
Furthermore, products of e-commerce are generally organized into a hierarchical taxonomy of multilevel hierarchical categories. Product classification is the task of automatically predict-ing a taxonomy path for a product in a predefined taxonomy hierarchy. It is a backbone for successful marketing and sale of products listed on several online stores like Amazon6, eBay7, Cdiscount8 etc. Since a large number of business users list their products and expect to find buyers for their products, it is crucial that the products are listed in accurate categories. In
6. https://www.amazon.com/ 7. http://www.ebay.com/ 8. https://www.cdiscount.com/
INTRODUCTION
addition, it also plays a vital role in customer oriented services like search and recommenda-tion. Description, title, images etc. are all useful sources to extract relevant features to classify products. Major actors like Amazon, e-Bay, Cdiscount among others use different taxonomies to organize products making it hard and labor-intensive for sellers to categorize the products. Sometimes sellers are encouraged to find similar products to those they sell and adopt this cat-egory to their products. However, this mechanism leads to two main problems: (1) it takes a lot of time for a merchant to categorize items and (2) such taggings can be inconsistent since different sellers might categorize the same product differently. To solve these problems, ideally one would like to have an automated procedure, which can classify any product into a given product taxonomy. Such process will both alleviate human labor and further improve product categorization consistency in e-commerce websites.
As for the financial sector, it plays an important role on the economical and social organi-zation of modern society and has existed since the dawn of human activity, much longer than ecommerce has. Since Adam Smith, it has been governed by the Efficient Market Hypothesis -“There is no other proposition in economics which has more solid empirical evidence supporting it than the Efficient Market Hypothesis”, as said by Jensen (Jensen, 1978). However, for the last decades, this concept has been challenged and the recent development of AI has irreversibly broken the balance. Numerai9, a hedge fund created in 2015, uses artificial intelligence to make trading decisions. Instead of developing the algorithms themselves, they’ve outsourced the task to thousands of anonymous data scientists, who compete to create the best algorithms and win cryptocurrencies for their efforts. Many other companies like Numerai, also referred to as FinTech, have emerged over the past few years and are having a huge impact on the finance in-dustry. Meanwhile, with the large amount of transactional data publicly accessible, researchers are also provided with this unique opportunity to compete with professional traders without prior knowledge nor experience in trading.
As a result, driven by the irresistible temptation of potential benefits, financial giants such as Goldman Sachs and many of the biggest hedge funds are all switching to AI-driven systems that can foresee market trends and make trades better than humans10. It has been reported that Goldman Sachs’ US cash equities trading desk in its New York headquarters employed 600 traders in 2000, but today, only two remains with the machines doing the rest11. From a global scale, around 9% of all funds12, managing $197 billion, rely now on AI models built by
9. https://numer.ai/
10. https://fr.scribd.com/document/341347760/AI-REPORT-GOLDMAN-SACHS-FT-Artificial-Intelligence 11. https://www.technologyreview.com/s/603431/as-goldman-embraces-automation-even-the-masters-of-the-universe-are-threatened/
INTRODUCTION
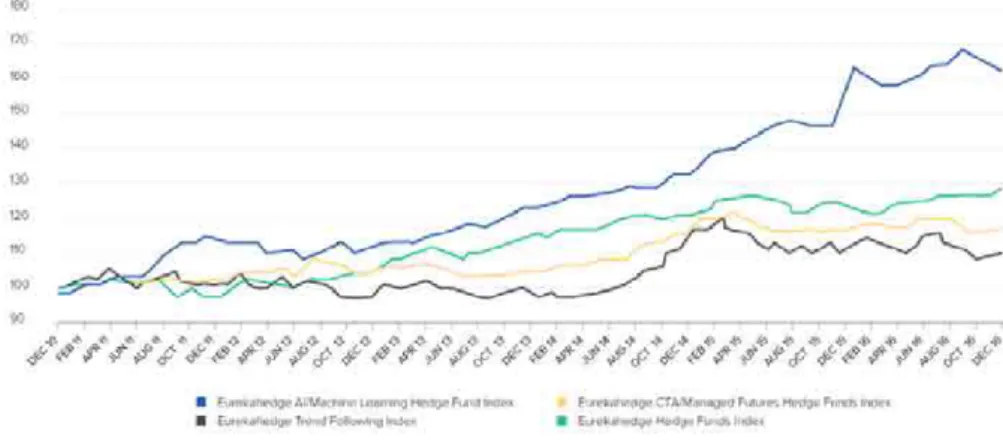
data scientists. A recent study performed by investment research firm Eurekahedge13 tracked the performance of 23 hedge funds utilizing AI from 2010-2016, finding that they outperformed those managed by more traditional quants and generalized hedge funds, as shown in Figure 2.2.
Figure 2.2 – Hedge funds performance comparison. Source: Eurekahedge
Confronted with those aforementioned challenges, driven by the increasingly demand and motivated by the power of AI, this thesis aims to reveal, in a preliminary way, the potential im-pact of artificial intelligence in e-commerce and finance fields through a few concrete applications and to shed some light on the future development of those fields in this era of Big Data.
2.2
Organization of this thesis
The rest of this thesis is organized as follows. Chapter 3 is focusing on reviewing related works of topics discussed in this thesis, including semantic search, search result ranking, product categorization and stock prediction. Chapter 3 - 6 present our work on addressing those afore-mentioned four problems. In Chapter 3, we present a novel term weighting scheme to better assess text similarity thus improve the product search accuracy. In Chapter 5, we use a time series model to predict daily sales of products and used a search result reranking algorithm based on sale prediction to increase the revenue of the company. In Chapter 6, we describe the product categorization competition we held on an online platform and present some state-of-the-art solu-tions regarding to our real-world problem. In Chapter 7, we follow our study on time series and present our work on predicting S&P stocks using various machine learning algorithms. Finally, Chapter 8 gives a summary of this thesis as well as discusses on directions for future work.
CHAPTER
3
LITERATURE REVIEW
A year spent in artificial intelligence is enough to make one believe in God.
Alan Perlis
3.1 Semantic search and term weighting . . . 20 3.2 Search result ranking . . . 21 3.3 Product categorization . . . 22 3.4 Stock prediction . . . 23
LITERATURE REVIEW
3.1
Semantic search and term weighting
Today, Google and other search engines are smarter than ever and has penetrated into every aspect of our lives. They look after tracks we leave on the Internet and use artificial intelligence to process those data and rank information to our own taste. But the Internet was not always so easy to navigate. There was a time when you had to know the exact wording of some content to be able find it. Accurately interpreting the meaning of a search query has been and still is a major topic for researchers in the field of semantic search.
Term weighting, by placing high weight on terms containing important information within a search query, is one of the techniques to improve query interpretation accuracy, which, in return, improves the over-all accuracy of a search engine. Term weighting is built upon the Vector Space Model (Salton and McGill, 1986), where each document is represented by a bag of words vector with one component in the vector for each dictionary term. The term weighting scheme tf-idf (Sp¨arck Jones, 2004) is a commonly used scheme in Information Retrieval. The “idf” part of the scheme is based on the assumption that rare terms are more relevant than frequent ones. Such assumption, although relevant in a large amount of situations (Roul et al., 2014; Paik, 2013), does not always hold in the context of e-commerce. Therefore in Chapter 4, we present a novel term weighting scheme tailored to the need of e-commerce companies. Our proposed scheme is based on in-depth analysis of user purchase record. Using such user feedback information, implicit or explicit, has been commonly acknowledged to be able to boost the performance of search engines (Baeza-Yates and Maarek, 2012; Balakrishnan and Zhang, 2014). As a result, various types of user-system interactions have been incorporated to improve search experience of users (Ruthven, 2008). Query log is an important source of information as it provides signals of what people are searching for and what they have found appealing through some user interaction data. Various types of information revealing user interest can be exploited:
1. Time. The amount of time a user spend on a web page is often used to filter out irrelevant clicks. It is reasonable to incorporate the dwell into account to better interpret events like clicks (Kim et al., 2000; Kelly and Belkin, 2004; Ramachandran, 2005).
2. Click sequence. Clearly users do not click at random, but make a (somewhat) informed choice. While click-through data is typically noisy and clicks are not “perfect” rele-vance judgments, the clicks are likely to convey some information (Agichtein et al., 2006; Veilumuthu and Ramachandran, 2007; Craswell and Szummer, 2007).
3. Click position. Clicks often suffer from positional bias where highly ranked items get more clicks than poorly ranked ones regardless of their relevance to the given search. Click position can thus help us to better interpret the click stream registered in the log
LITERATURE REVIEW
database (Joachims, 2002; Xue et al., 2004; Agichtein et al., 2006).
4. Click through rate (CTR). Click through rate is the ratio of total clicks over total im-pressions. It’s often used in online advertisement domain to measure the effectiveness of an ad. It’s also shown to be useful in log data analysis to improve search engine performance (Ramachandran, 2005; McDonnell, 2014).
It is also worth noticing that these logs have also been shown to be useful for a multitude of applications outside of search result ranking. For example, in spelling correction (Ahmad and Kondrak, 2005), user behavior modeling (Dupret and Piwowarski, 2008; Guo et al., 2009; Wang et al., 2010).
Furthermore, eye tracking data (Buscher et al., 2012; Cutrell and Guan, 2007; Li et al., 2015; Buscher et al., 2010) and cursor movement (Chen et al., 2001; Rodden et al., 2008; White and Buscher, 2012) constitute an additional information source to improve the search query interpretation accuracy, thus user experience overall.
3.2
Search result ranking
While semantic search and term weighting are crucial for a search engine to understand user’s search intention and retrieve accurately relevant information, how to rank those results to better fit the business objective of a company is another essential issue, especially in the domain of e-commerce. For example, when a user search for “Television”, it is indeed important to correctly get all the televisions from our product database, but the issue of choosing which one to be placed ahead has not been tackled yet while having a significant financial implication for the business.
Some previous studies have already addressed such issue using click data and have shown promising results in improving document search (Joachims et al., 2005; Agichtein et al., 2006) and image search (Jain and Varma, 2011) performance. In Chapter 4, we exploit purchase data improve product search performance via a collaborative filtering framework. We further, In Chapter 5, propose a more sophisticated reranking strategy built upon the prediction on daily sales of a product using time series prediction. However, when click data is largely used to decide which search result to present, a particular attention needs to be paid on positional bias. The probability of an item being clicked depends not only on its relevance, but on its position in the results page. The effect of such bias has been confirmed in numerous papers (Craswell et al., 2008; Yue et al., 2010). Moreover, input search query can often be ambiguous to some extent, which makes the system even more difficult to infer the user’s search intention. In fact, when the user’s actual information need is uncertain, relevance estimations may be misguided,
LITERATURE REVIEW
leading to a complete retrieval failure and the abandonment of the query (Chen and Karger, 2006), which is crucial for most business. How relevant the document is in light of the multiple possible information needs underlying the search query (Sp¨arck-Jones et al., 2007) and in light of the other retrieved documents (Clarke et al., 2009) should also be taken into account for ranking purpose. As for evaluating ranking performance, various metrics have been proposed. Some commonly used ones include precision@k, MAP, NDCG (Wiener, 1956; Croft et al., 2010) along with their derivatives (Liu et al., 2007; Voorhees, 2003). However they are not tailored to our e-commerce scenario where the objective is often to maximize the revenue generated through search engine. Therefore in our study, in Chapter 5 a novel metric revenue@k is proposed. It measures average percent revenue generated by the top k displayed products.
3.3
Product categorization
Categorization or classification is the problem of identifying to which of a set of categories, a new observation belongs, on the basis of a training set of data containing observations whose category membership is known. The problem has been widely studied in the domain of data science and artificial intelligence and has many applications already changing our daily lives, such as email spam classification (Pantel et al., 1998; Blanzieri and Bryl, 2008; Yu and Xu, 2008) and disease prediction (Cruz and Wishart, 2006; Kaundal et al., 2006; Chen et al., 2017).
On-line retailers are also interested in such technology and are attempted to automatically put their products into the correct category to increase their visibility and, in return, improve user engagement and satisfaction. In Chapter 6, we present our challenge to the data science community to use the state-of-the-art algorithms predicting the category of a product based on its textual description and image on a large dataset retrieved from Cdiscount. Text based and image based classification are subjects actively followed by researchers of related fields. In (Yang and Liu, 1999), various kinds of text classification algorithms are reviewed. Many of the classification algorithms have been implemented in different software systems and are pub-licly available such as BOW toolkit (McCallum, 1996), Mallet (McCallum, 2002), NLTK (Bird, 2006) and WEKA1. Probabilistic classifiers, such as Naive Bayes, have gained a lot of popularity recently and have shown to perform remarkably well (Joachims, 1996; Koller and Sahami, 1997; Larkey and Croft, 1996; Sahami et al., 1998) where Bayes rule is used to classify new examples and select the class that is most likely has generated the example (McCallum et al., 1998). Support Vector Machine is another family of classification algorithms that has been commonly used in text classification. Initially introduced in (Cortes and Vapnik, 1995; Vapnik and Kotz,
LITERATURE REVIEW
1982), SVM is robust against high dimensionality which makes it popular in classifying text, indeed in text mining dimension can be as large as multiple dictionaries of languages (Hotho et al., 2005; Joachims, 1998).K-Nearest-Neighbors has also been observed in some studies to classify textual data (Han et al., 2001; Rezaeiye et al., 2014; Sebastiani, 2002). Decision tree along with its derivatives Random Forest and Boosted Trees are also commonly used in text classification and often report highest accuracy among other models (Johnson et al., 2002; Xu et al., 2012; Schapire and Singer, 2000). All of those aforementioned algorithms can be found in our top competitors solution presented in Chapter 6 and combining various models together is another way to further improve the accuracy of classification as reported in Chapter 6. Image based classification can also be beneficial for e-commerce companies and a recent classification competition launched by Cdiscount was solely based on product images2. With the recently de-velopment of deep learning, promising results have been reported in various studies (Chan et al., 2015; Krizhevsky et al., 2012). Particularly, in (Ciregan et al., 2012), the author built a deep neural network and was the first to achieve a near human performance of classification accuracy on the public MNIST dataset. With this recently launched competition, we are expecting to see further improvement on the state-of-the-art image classification research.
3.4
Stock prediction
Stock market has long been characterized by its dynamic, complicated, and non-stationary nature (Fama, 1965). Market movements are dependent upon various factors ranging from polit-ical events, firms policies, economic background, commodity prices, exchange rates, movements of other stock markets to psychology of investors (Gidofalvi and Elkan, 2001; Committee, 2013). In addition, the Efficient Market Hypothesis (Peters, 1996) assumes that asset prices are fair and adjust quickly to reflect all past and present information, which implies that future stock price movements are independent from pending and past information and should therefore follow a random walk pattern. If this hypothesis were true, then any attempts to predict the market would be fruitless (Taylor, 2008). If there is to be one “father” of the EMH, this man is Eugene Fama, who remains an outspoken proponent of the hypothesis to this day (Fama, 1965; Malkiel and Fama, 1970; Fama, 1991). The hypothesis has been tested extensively across various markets. The results are, however, sometimes contradictory. Many early work support the random walk model (Alexander, 1961). “There is no other proposition in economics which has more solid empirical evidence supporting it than the Efficient Market Hypothesis”, as said by Jensen (Jensen, 1978). However, modern studies (Fama, 1991; Gallagher and Taylor, 2002)
LITERATURE REVIEW
on stock markets reject the random walk behavior of stock prices and a substantial number of market inefficiencies or “anomalies” has been documented (Palan, 2004).
Besides the efficient market hypothesis, there are two schools of thought regarding stock market predictions: fundamental analysis and technical analysis. Fundamental analysis (Dechow et al., 2001) consists of evaluating the intrinsic value of a stock by examining the financial condition of a company. However, the proponents of the EMH argue that the intrinsic value of a stock is always equal to its current price. Technical analysis, on the other hand, is a study of the market itself. Technical analysts believe market action tells everything, so price and trading volume time series are enough for prediction tasks. Since market driving forces (i.e., human psychologies) hardly change, the prices are then considered to be recurrent and predictable since history always repeats itself.
Recently development on Artificial Intelligence has drawn attention from both practitioners and researchers of stock market. Artificial neural network is one of the most promising model used by researchers to predict stock movement (Guresen et al., 2011; Bahrammirzaee, 2010; Naeini et al., 2010; Ticknor, 2013), because, theoretically ANN can approximate any nonlinear function to an arbitrary degree of accuracy with a suitable number of hidden units (Hornik et al., 1989). Other models including SVM (Lin et al., 2013; Sands et al., 2015; Kazem et al., 2013; Yuan, 2013), Random Forest (Ballings et al., 2015; Patel et al., 2015; Khaidem et al., 2016) etc. have also been extensively studied for the stock prediction tasks. Attempts combining various approaches to improve prediction accuracy have also been made (Huang et al., 2008; Lee, 2009;
˙
Zbikowski, 2015; Patel et al., 2015) resulting in promising results.
In addition, social media offers a powerful outlet for people’s thoughts and feelings. It is an enormous ever-growing source of texts ranging from everyday observations to involved discussions. Using sentiment analysis to extract emotions and opinions from text will serve as another importance source of information and has been pursued actively by researchers of the field (Medhat et al., 2014; Nguyen et al., 2015; Kearney and Liu, 2014; Azar and Lo, 2016). Taking Twitter as an example, in (Skuza and Romanowski, 2015), Twitter messages are retrieved in real time using Twitter Streaming API and a classification model built on Naive Bayes algorithm is proposed to predict future stock price based on analysis of twitter data. The author in (Pagolu et al., 2016) applied sentiment analysis and various supervised machine learning algorithms to tweets extracted from twitter API and analyzed the correlation between stock market movement of company and sentiments in tweets. Both results are promising.
CHAPTER
4
AN ENTROPY-BASED TERM WEIGHTING SCHEME AND ITS
APPLICATION IN E-COMMERCE SEARCH ENGINES
E
-commerce search engines play a crucial role for large online retailers.Indeed, a large number of purchases are derived from searches. It is now widely acknowledged that pure content based indexation techniques are less efficient than hybrid approaches taking user feedback into account to rerank the output. Purchase data is a valuable source of feedback, arguably less noisy than other sources, such as clicks: the fact that money is spent, is interpreted as a strong signal of interest for the purchased object. Unfortunately, a large portion of queries, which we refer to as “rare queries”, have unavailable or insufficient associated purchase information. In that case, following ideas from neighborhood-based collaborative filtering, we introduce a similarity function between queries. The main contribution of this paper consists in defining a new weighting scheme based on entropy that seems to work well in practice. This claim is backed up by numerical experiments where the proposed entropy based approach outperforms tf-idf weighting on real e-commerce purchase data.AN ENTROPY-BASED TERM WEIGHTING SCHEME AND ITS APPLICATION IN E-COMMERCE SEARCH ENGINES
4.1 Introduction . . . 27 4.2 Problem framework . . . 28 4.2.1 Purchase data description . . . 28 4.2.2 Ranking with purchase data using similar queries . . . 29 4.3 Our entropy based term weighting scheme . . . 30 4.3.1 Importance of a term . . . 30 4.3.2 Mathematical framework of entropy based term weighting . . . 31 4.4 Application of the proposed scheme and experimental evaluation . . . 33 4.4.1 Entropy-based query similarity metrics . . . 33 4.4.2 Experiment setting . . . 34 4.4.3 Evaluation metric . . . 34 4.4.4 Results and analysis . . . 34 4.5 Conclusion and future work . . . 36
AN ENTROPY-BASED TERM WEIGHTING SCHEME AND ITS APPLICATION IN E-COMMERCE SEARCH ENGINES
4.1
Introduction
The majority of e-retailers rely on a search engine for the customers’ sake to find the most relevant products. Therefore search engines have become a vital tool for the e-commerce in-dustry. A now widely acknowledged procedure to boost the performance of a search engine consists in incorporating users feedback information in its design (Baeza-Yates and Maarek, 2012; Balakrishnan and Zhang, 2014). In particular, in the context of e-commerce, purchase data is a useful feedback. They are a collection of pairs having the form hquery, producti, where product corresponds a purchase made just after query has been submitted, if any. It is indeed arguably less noisy than other feedback sources, such as clicks because it involves mon-etary transactions (Parikh and Sundaresan, 2008). However, purchase data can be challenging to exploit, for mainly two reasons. Firstly, the vast majority of queries are unique, i.e. they do not appear elsewhere in the database. Secondly, a given user at a given time rarely buys many products: purchase data are extremely sparse (a few products among millions are associated to a given query).
In order to deal with such highly valuable but sparse data, a certain amount of regularization is needed. A popular way of performing such regularization is the so-called “collaborative filtering” (Herlocker et al., 1999). Roughly speaking, it consists in suggesting products not only associated with the given query, but also associated with other similar queries. The starting point is therefore a similarity function between two queries. There are basically two ways of comparing queries. The first way is to compare queries via the products purchased after them. For instance, query “Apple tablet” and query “Ipad” are similar in the sense that they usually yield the same purchases; although their content, i.e. the terms they are made of, are not similar. The second way is to compare their constituting terms. In this line of thoughts, it is important not to give the same weight to each term. Indeed, some terms are more informative than others. For instance query “sony black ps4” is closer to query “promo ps4” than to query “sony black smartphone”, even though the it is not the order implied by the number of common words. In this example, giving more weight to the term “ps4” than to the term “sony” or “black” can solve the problem. This weighting is meaningful, as the term “ps4” is arguably more informative than the term “sony”, as it, alone, can limit considerably the relevant products range while “black” and “sony” can be used to describe a wide range of other products.
The weighting scheme tf-idf (Rajaraman and Ullman, 2011) is a commonly used scheme in Information Retrieval. The “idf” part of the scheme is based on the assumption that rare terms are more relevant than frequent ones. Our claim is that the tf-idf scheme, although relevant in a large amount of situations (Roul et al., 2014; Paik, 2013), is not relevant in the context we
AN ENTROPY-BASED TERM WEIGHTING SCHEME AND ITS APPLICATION IN E-COMMERCE SEARCH ENGINES are interested in. In the tf-idf scheme, rare terms mean terms that do not appear frequently in the database, whatever the purchases associated to them. For instance, the term “ps4”, that appears relatively frequently in the database, because the product “Playstation 4” is popular, is not considered as important as the term “color”, which appears a little bit less in our database. We are interested in exact figures at this stage but more on conceptual matters. Let us argue that “color” is less informative than “ps4”. Should one recommend a product based on the sole query “color” it would be a daunting task to make a good guess of what the user has in mind; whereas for “ps4”, there is a good chance that the user is interested in a product related to “Playstation 4”. In our proposed method, contrarily to the tf-idf weighting, we believe that the importance of a term should not solely be based on its number of occurrences, but should be mainly based on the diversity of purchases it has lead to. More precisely, we advocate that when the same term used in a large variety of purchases, it is less important than another term which is systematically associated to the very same purchase. Shannon entropy is a quantitative way to measure how much diverse a given term is. This is the reason why our proposed weighting scheme is based on entropy. We claim that this entropy-based weighting scheme gives interesting results in practice, compared to tf-idf; at least on our database. Notice that both methods are distinct not only on the exact formula used to compute the weights but also and more importantly on a conceptual ground, since tf-idf only uses the query database, while the entropy weighting scheme uses both query and product.
The main contribution of this paper is to present a novel term weighting scheme suitable for e-commerce context and to the best of our knowledge, no such term weighting scheme has ever been proposed.
The rest of this paper is organized as follows. We first present the problem framework in Section 4.2. Then in Section 4.3, we introduce our entropy based term weighting scheme with its mathematical framework. Its application in e-commerce is described in Section 4.4 based on real-world data. Finally, in Section 7.8 we provide conclusions and directions of our future work.
4.2
Problem framework
4.2.1 Purchase data description
E-commerce purchase data is a valuable source of feedback information. Our purchase data is use consists of a set of hq, pi pairs where q is the last searched query before purchasing the product p. The entire data is further split into two sets: D as training set with cardinality D and T as test set with cardinality T . In addition, the product catalog of our database is denoted by P.
AN ENTROPY-BASED TERM WEIGHTING SCHEME AND ITS APPLICATION IN E-COMMERCE SEARCH ENGINES Along with search query log, purchase data is capable of revealing the purchase intention of searchers. It is thus logical to re-rank the items that searchers really want to buy at top positions. However, a few challenges come along with purchase and need to be addressed.
1. Sparsity. Every query is related to a very small percentage of the product catalog. Indeed, the frequency of the queries is very small in comparison with the size of the product catalog. 2. Power-law distribution of query frequency. Very few distinct queries are very commonly seen and explain a large amount of purchases while a large number of very rare queries still account for a significant amount of purchases. This power law distribution of e-commerce query frequency has also been reported in (Parikh and Sundaresan, 2008). Furthermore, those rare or so called long tail queries are not less important than the frequent or so called short head ones for an e-commerce company (Goel et al., 2010).
3. New query. Queries without historical purchase data occur in a daily basis. Studies an anther e-commerce company show that a query-log of one day contains over 20% of new queries relative to a 4-months query log (Hasan et al., 2011). This observation is also confirmed on our data set.
In order to deal with these challenges, we used a collaborative filtering (Herlocker et al., 1999) based framework, commonly used in product recommendation systems, that we shall describe in the sequel.
4.2.2 Ranking with purchase data using similar queries
In our context of product searching, the idea of collaborative filtering is quite simple: if two queries are similar, we can use the purchases of one query to improve the product ranking of the other query. The ranking function we use is formulated in equation (4.1).
r(q, p) = α log s(q, p) + (1 − α)X q0
sim(q, q0) log s(q0, p) (4.1)
where s(q, p) denotes the number of purchases on product p using q as the last search query and the parameter α can be further tuned on training set. In order to apply this formula, one has to come up with a quantitative way to measure query similarity.
For frequent queries, the component ps(q, p) in (4.1) is usually sufficient to generate high quality rankings, without the aid of similar queries. Moreover the Pearson coefficient on purchase data can further be applied to measure similarity between two frequent queries and two queries are similar if they share many common purchases. It can, indeed, identify similar queries with no terms in common, like “ipad” and “apple tablet”, but it is not applicable on new queries
AN ENTROPY-BASED TERM WEIGHTING SCHEME AND ITS APPLICATION IN E-COMMERCE SEARCH ENGINES Lexical similarity, also called term matching, is commonly used in the field of information retrieval. By regarding each query as a bag of words, a straightforward way to compute query similarity is to normalize the number of terms that occur in both queries. Let {q} denote the set of terms composing the query q. Some commonly used similarity metrics are listed as follows.
1. simDice(q, q0) = 2|{q} ∩ {q0}|/(|{q}| + |{q0}|) 2. simJaccard(q, q0) = |{q} ∩ {q0}|/|{q} ∪ {q0}| 3. simOverlap(q, q0) = |{q} ∩ {q0}|/ min(|{q}|, |{q0}|) 4. simCosine(q, q0) = |{q} ∩ {q0}|/p|{q}| × |{q0}|
However those similarity metrics work poorly for short text segments (Metzler et al., 2007) which is the our case since e-commerce search query length is around three in average. We will describe in the next section our proposed term weighting scheme to improve those lexical similarity metrics.
4.3
Our entropy based term weighting scheme
4.3.1 Importance of a term
Consider the search query “apple ipad” was just entered. The term “ipad” clearly carries most of the information contained in this query, as it alone can tell us what product is expected while the term “apple” can almost be considered as superfluous. When computing query simi-larities, we should consider queries sharing the term “ipad” be more similar to the query than those sharing the term “apple”. Therefore “apple ipad” should be more similar to “ipad 128g” than “apple fuji”. Notice that all three queries occur commonly on large e-retailers.
A convenient way to assess the importance of a term is to use the so-called tf-idf (Term Fre-quency - Inverse Document FreFre-quency) term weighting scheme (Rajaraman and Ullman, 2011), which is universally applied in document retrieval. It is generally based on two assumptions.
1. idf assumption: rare terms are more relevant than frequent terms.
2. tf assumption: multiple occurrences of a term in a document are more relevant than single occurrence.
This scheme is perfectly relevant for large size documents, however, it is less relevant for e-commerce queries which are composed of three terms in average. Moreover, it is quite clear already that the “tf” component, i.e. the frequency within document/query, is nearly useless for e-commerce queries: a user rarely repeat a term in a query. Thus a term importance is solely based on its frequency in database. However in e-commerce query log, the best-seller products
AN ENTROPY-BASED TERM WEIGHTING SCHEME AND ITS APPLICATION IN E-COMMERCE SEARCH ENGINES such like “ps4”, “fifa” etc. Those terms are thus heavily penalized by tf-idf weighting scheme while they still carry valuable information on what products are expected.
In the context of e-commerce, search engine users usually have a purchase intention in mind. The term importance could be related to its ability of telling us the searcher’s purchase intention. Terms used in purchasing very various range of products should be less important than those used in purchasing a very narrow range of products. Therefore our basic idea is not to judge the importance of a term by its number of occurrences in the database, but by how dispersed are the purchases associated to it.
To turn this idea into a quantitative way, we employ the notion of Shannon’s Entropy of a discrete random variable (Cover and Thomas, 1991), which we shall explicitly describe in the sequel.
4.3.2 Mathematical framework of entropy based term weighting
Recall the notion of Shannon’s Entropy of a discrete probability distribution (Cover and Thomas, 1991). Given a probability distribution π on a finite set I, the Shannon Entropy is defined as:
H(π)def= −X i∈I
πilog πi (4.2)
Now, to each term t, associate the following probability distribution, referred to as term purchase distribution: πt= 1 Zt X hq,pi∈DN I{t ∈ q}δp (4.3)
where δpdenotes the probability distribution with all its mass on product p and Zt, corresponding to the number of purchases associated to t is a normalization term such that πtbe a probability distribution over P.
For a term t, its entropy H(t) is then defined as
H(t)def= H(πt) (4.4)
As a specific example, table 4.1 shows a small sample of purchase log and the table 4.2 describes purchase distributions of the related terms.
Query Product hp printer p1 hp printer p2 hp 3050a p1
hp pc p3
Table 4.1 – A sample of purchase data log
p1 p2 p3 hp 12 14 14 printer 12 12 0
3050a 1 0 0
pc 0 0 1
AN ENTROPY-BASED TERM WEIGHTING SCHEME AND ITS APPLICATION IN E-COMMERCE SEARCH ENGINES
The entropy of terms in the previous sample can be calculated as follows.
H(hp) = −12log(12) − 2 × 14log(14) = 32 × log 2 H(printer) = −2 ×12log12 = log 2
H(3050a) = − log 1 = 0 H(pc) = − log 1 = 0
(4.5)
In average, frequent terms have higher entropy values than rare ones since the maximum entropy of a term is the logarithm of its frequency. Nevertheless, term frequency is not the determinant factor of its entropy. In fact, among frequent terms, those with dispersed purchase distribution have higher entropy values than those with concentrated one. For instance, purchase distribution of “hp” and “3050a” generated using our training set are presented in figure 4.1 with pie chart. We can clearly see that the purchase distribution of “hp” is extremely dispersed while that of “3050a” is relatively concentrated, which explains the higher entropy value of the former.
(a)H(hp) = 5.79 (b) H(3050a) = 1.05
Figure 4.1 – Term purchase distributions of ‘hp‘ and “3050a”.
On the one hand, the purchase distribution of “hp” is extremely dispersed, which is indicated by the diversity of colors in the pie chart (a). Hence a high entropy is assigned to “hp”. “3050a”, on the other hand, has a relatively concentrated purchase distribution (b), which explains its low entropy value.
So far, we have seen that term importance is inversely related to its entropy. We further apply an exponential transformation on entropy to quantify importance of a term with the following term weighting scheme.
wentropy(t) = exp(−λ × H(t)) (4.6)
The smoothing parameter λ can be further tuned by cross validation on training set. It is worth noticing that our weighting scheme takes values in (0, 1]. The lowest weight occurs on terms
AN ENTROPY-BASED TERM WEIGHTING SCHEME AND ITS APPLICATION IN E-COMMERCE SEARCH ENGINES with extremely dispersed purchase distribution. In our data set, “femme” and “homme”, i.e. “woman” and “man” in English, have the lowest weights since a very large range of diverse products are associated to them.
In what follows, we shall show our our proposed term weighting can be used to improve query similarity metric and to be applied in e-commerce product search.
4.4
Application of the proposed scheme and experimental
eval-uation
4.4.1 Entropy-based query similarity metrics
Query similarity metric is the key element of our collaborative filtering framework employed in (4.1). It is well acknowledged that lexical similarity metrics performs poorly when queries in question are extremely short (Metzler et al., 2007), which is precisely our case where the average length of a search query in e-commerce is around three. Techniques based on query reformulation are proposed in various papers (Yang et al., 2014; Parikh et al., 2013) to rewrite a query into a more meaningful form before any further processing. Our proposed approach keeps the original form of a query and assigns different weights to different terms based on their term entropy defined previously in order to highlight the most important ones in a query so that query similarity relies mainly on the most important terms. Roughly speaking, for a given pair of queries q and q0, our entropy based weighting consists in normalizing P
t∈q∩q0
wentropy(t) instead of |{q} ∩ {q0}| in lexical similarity metrics. For example, recall that Jaccard similarity metric is simJaccard(q, q0) = |{q} ∩ {q0}|/|{q} ∪ {q0}|, then the corresponding entropy weighted Dice similarity metric is defined as
sim EntJaccard(q, q 0)def= P t∈q∩q0 wentropy(t) P t∈q∪q0 wentropy(t)
Similarly, computation of entropy weighted similarity metrics of Dice, Overlap and Cosine is straightforward.
In our numerical experiments, we implemented all those four entropy weighted similarity metrics into our ranking function (4.1).
In order to demonstrate the effectiveness of our entropy based term weighting scheme, we conducted numerical experiments on real e-commerce data. We shall begin by presenting our experiment setting, then follow by introducing the evaluation metric we use to compare different algorithms. Experiment results will also be analyzed in detail latter in this section.
AN ENTROPY-BASED TERM WEIGHTING SCHEME AND ITS APPLICATION IN E-COMMERCE SEARCH ENGINES
4.4.2 Experiment setting
We extracted purchase data from a major e-commerce company for a given period. The entire purchase set was further split into a training set of 1,000,000 samples and a test set of 100,000 samples. Each sample consists of a hq, pi pair, where q is the last searched query before purchasing the product p. As we worked on a French corpus, each query was passed through a query pre-processing procedure. It consists of French accent removal, stop-words removal, special character replacement by space, lower-casing and stemming. We used Porter’s stemmer (Porter, 2001) to aggregate syntactically similar queries. It allows to alleviate term plurality and French gender mismatching issue. For example the term “ch`eres” is stemmed to “cher” and “tables” is stemmed to “tabl”. It helped to reduce about 5% of our term dictionary size and thus increased the accuracy of our term weighting scheme.
4.4.3 Evaluation metric
We employed our ranking function (4.1) to rank all the products for each query in the test data after tuning the parameters α using training set. In our experiments, the optimal α is found at 0.8.
In order to compare performance of different ranking functions, there are several well known metrics (Croft et al., 2010): MAP, NDCG, or simply the Precision@r metric which is the one we use. In our context where a test set T consisting of pairs “query/product”, hq, pi is given, the metric is defined by:
Precision@r(fr) = 1 T X hq,pi∈T r X i=1 I{fr(q)i= p} (4.7)
where fr is a function returning the top ranked r products by ranking function (4.1) for each input query q. Notice that Precision@r depends on r. Consequently, it may happen that a given search engine performs better at a given r but worse at another r0. In that case, using integrated metrics such as MAP can help. However, it is going to turn out in our experiments that such a sophistication is not needed.
4.4.4 Results and analysis
We implemented four similarity metrics, Jaccard, Cosine, Dice and Overlap using two term weighting schemes: tf-idf and our proposed entropy based in ranking function (4.1). Notice that the tf term, i.e. the term frequency within query, is nearly useless for e-commerce queries: a user rarely repeat a term in a query. In consequence, the tf-idf term weighting scheme takes the
AN ENTROPY-BASED TERM WEIGHTING SCHEME AND ITS APPLICATION IN E-COMMERCE SEARCH ENGINES following form.
wtf idf(t) = log(
D
|{(q, p) ∈ D : t ∈ q}|)
Experimental results using Precision@r metric with different values of r are presented in figure 4.2. We observe that entropy-based term weighting outperforms tf-idf on all similarity metrics implemented at all values of r.
(a)Jaccard (b) Dice
(c) Cosine (d) Overlap
Figure 4.2 – Performance comparison of entropy-based weighting and tf-idf weighting using dif-ferent basic similarity metrics. X-axis is the number of allowed recommendations, corresponding to the parameter r of (4.7). Y-axis is the Precision@r value.
Some detailed analysis are conducted. Comparing to tf-idf which assigns constantly higher weight to rare terms and lower weight to frequent terms, our entropy based term weighting scheme share some common points but also differs in some others. Rare terms have, in average, a low entropy value thus high importance since the maximum entropy value of a term positively depends on term frequency. But if a frequent term has a relatively concentrated distribution such like “galaxy3”, it can still have a relatively low entropy value, thus high importance. Only terms with high frequency and dispersed purchases are considered not important. Some examples are presented in table 4.3.
Moreover since terms describing best-sellers occur quite often, high frequency terms could be more important than less frequent ones. For example, the term “ps4” is more frequent than the
AN ENTROPY-BASED TERM WEIGHTING SCHEME AND ITS APPLICATION IN E-COMMERCE SEARCH ENGINES
Term Entropy Explanation
hp 5.8 high freq., dispersed purchases galaxy3 0.69 high freq., concentrated purchases
cn046a 0.5 Low frequency
Table 4.3 – Examples of term entropy
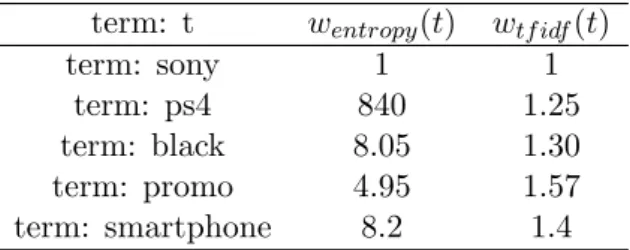
term “black” in our query log, however the former is clearly more informative than the latter about what products the user is looking for, see table 4.4.
term: t wentropy(t) wtf idf(t)
term: sony 1 1
term: ps4 840 1.25
term: black 8.05 1.30
term: promo 4.95 1.57
term: smartphone 8.2 1.4
Table 4.4 – Examples of entropy-based term weighting with λ = 2 and tf-idf term weighting. Both schemes are normalized on the weight of “sony” in order to have a relative view of term importance.
sony black ps4 Jaccard tf-idf entropy sony black smartphone 0.5 0.46 0.01
promo ps4 0.25 0.24 0.98
Table 4.5 – Similarities with “sony black ps4” on different metrics
Let us take the query “sony black ps4” as an example. It is more similar to “sony black smartphone” than to “promo ps4” using tf-idf, in accordance to table 4.5, which is controversy to our intuition. Entropy-based weighting reveals that “ps4” is far more informative than others as most queries containing “ps4” end up with purchasing a play station 4. Thus “promo ps4” is considered as very similar to “sony black ps4” regardless of the number of terms in common.
4.5
Conclusion and future work
We have seen in this paper that the measuring similarities between queries was an important issue, at the core of higher level tools, such as collaborative filtering. After having reviewed a popular weighting scheme, namely tf-idf, which is based on the idea that corpus-wise rarest terms are the most important, we introduced a brand new weighting scheme. This novel weighting scheme is based on the idea that the importance of a term cannot be decided on its number of occurrences in the database alone. Rather, term importance, as we defined it, is based on how concentrated were the purchases it lead to. This notion was implemented through the
AN ENTROPY-BASED TERM WEIGHTING SCHEME AND ITS APPLICATION IN E-COMMERCE SEARCH ENGINES computation of term entropy that we defined in this paper. Numerical experiments, performed on real-world purchase data, showed encouraging results of our entropy-based term weighting over tf-idf. Detailed analysis were also conducted to explain the obtained results. Many questions still remain open. The term weighting scheme we defined in this paper is indifferent to the containing query, such that the same term has the same importance in different queries. Therefore we may consider it as a global term weighting scheme. By weighting each term conditionally to its containing query, a local term weighting scheme could be envisaged in the aid of the notion: conditional entropy. This idea will be carried on in our future work.
CHAPTER
5
RERANKING STRATEGIES BASED ON FINE-GRAINED BUSINESS
USER EVENTS BENCHMARKED ON A LARGE E-COMMERCE
DATA SET
A
s traditional search engines based on the text content often fail to ef-ficiently display the products that the customers really desire, web companies commonly resort to reranking techniques in order to improve the products’ relevance given a user query. For that matter, one may take advan-tage of fine-grained past user events it is now feasible to collect and process, such as the clicks, add-to-basket or purchases. We use a real-world data set of such events collected over a five-month period on a leading e-commerce com-pany in order to benchmark reranking algorithms. A simple strategy consists in reordering products according to the clicks they gather. We also propose a more sophisticated method, based on an autoregressive model to predict the number of purchases from past events. Since we work with retail data, we assert that the most relevant and objective performance metric is the per-cent revenue generated by the top reranked products, rather than subjective criteria based on relevance scores assigned manually. By evaluating in this way the algorithms against our database of purchase events, we find that the top four products displayed by a state-of-the-art search engine capture on av-erage about 25% of the revenue; reordering products according to the clicks they gather increases this percentage to about 48%; the autoregressive method reaches approximately 55%. An analysis of the coefficients of the autoregres-sive model shows that the past user events lose most of their predicting power after 2–3 days.RERANKING STRATEGIES BASED ON FINE-GRAINED BUSINESS USER EVENTS BENCHMARKED ON A LARGE E-COMMERCE DATA SET
5.1 Introduction . . . 40 5.2 Data set . . . 41 5.3 Reranking strategies . . . 42 5.3.1 Reranking by multivariate auto-regression . . . 44 5.3.2 Granger causality test . . . 45 5.4 Evaluation metric . . . 46 5.5 Results and discussion . . . 47 5.5.1 Analysis of the coefficients of the VAR model . . . 48 5.6 Conclusion . . . 50
RERANKING STRATEGIES BASED ON FINE-GRAINED BUSINESS USER EVENTS BENCHMARKED ON A LARGE E-COMMERCE DATA SET
5.1
Introduction
The recent growth of on-line retail industry has made on-site product search engine a salient part of e-commerce companies. Product search is not only a problem of significant commercial importance, it also raises fundamental research questions at the intersection of natural language processing, machine learning and information retrieval. The catalog of products of the largest companies can reach millions – if not tens of millions – of items, while user queries are typically made of very few words carrying limited semantic content. This greatly hampers the performance of traditional search engines based on text retrieval, in terms of conversion of the displayed results to purchases. Many companies thus opt for strategies to rerank the products using additional sources of information, in order to achieve better user satisfaction and larger revenue.
Fortunately, sophisticated tracking systems and ‘big data’ technologies now make it feasible to collect, store and process all user paths of the form:
query → click on product → add-to-basket → purchase,
over the whole site. It is then straightforward to build indicators with a granularity at the product level following a user query: e.g., number of clicks, add-to-basket and purchases per date. These numbers can directly serve the reranking purpose, if one argues that relevant products are simply those most likely to be viewed or purchased. This purely user behavior-based point of view leads to simple and objective reranking strategies, but it is not exempt from criticism. For instance, some products (such as erotic items) are likely to attract many curiosity clicks, and could therefore end up polluting many otherwise unrelated queries. Nevertheless, we believe that the use of past user events has the potential to improve conversion rates on e-commerce websites.
Previous studies discussed reranking strategies based on click data to improve retrieval of relevant web documents (Joachims et al., 2005; Agichtein et al., 2006) or images (Jain and Varma, 2011). Jiao et al. (2015) exploited purchase data to improve product search performance via a collaborative filtering framework. In the present work we had access to a real-world data set of click, add-to-basket and purchase events collected over a five-month period from Cdiscount, a leading French e-commerce company. Based on this, our objective is to quantify the improvements brought by reranking strategies on top of a state-of-the-art semantic search engine using the BM25 statistics (Robertson et al., 1995). The most straightforward strategy consists in re-ordering products according to the clicks they gather over a fixed period after a user query: this follows the philosophy of previous works, applied to different contexts (Joachims et al., 2005; Agichtein et al., 2006; Jain and Varma, 2011). We further propose a more sophisticated