Official URL
DOI :
https://doi.org/10.978.8896471/371
Any correspondence concerning this service should be sent
to the repository administrator:
[email protected]
This is an author’s version published in:
http://oatao.univ-toulouse.fr/24877
Open Archive Toulouse Archive Ouverte
OATAO is an open access repository that collects the work of Toulouse
researchers and makes it freely available over the web where possible
To cite this version: Quintero Rincon, Antonio and Batatia,
Hadj and Alejandro Pereyra, Marcelo and Risk, Marcelo Detection
of onset in epilepsy signals using generalized Gaussian
distribution.
(2014) In: 5th International Conference on Advances
in New Technologies, Interactive Interfaces and Communicability
(ADNTIIC 2014), 10 November 2014 - 12 November 2014
(Córdoba, Argentina).
Detection of Onset in Epilepsy Signals using
Generalized Gaussian Distribution
Antonio Quintero-Rincón1, Hadj Batatia2, Marcelo Pereyra3, Marcelo Risk1,4
1 Department of Bioengineering, Instituto Tecnológico de Buenos Aires (ITBA) Av. Eduardo Madero 399 C1106ACD, Buenos Aires, Argentina
2 University of Toulouse, IRIT - INP-ENSEEIHT,
Toulouse, 2, rue Charles Camichel, B.P. 7122, 31071 Cedex 7, France 3 Department of Mathematics, University of Bristol, University Walk, Clifton
Bristol BS8 1TW, U.K.
4 Consejo Nacional de Investigaciones Científicas y Técnicas (CONICET), Argentina [[email protected], [email protected],
[email protected], [email protected]]
Abstract. Extracting information from scalp EEG signals is a challenging biomedical signal processing problem that has a potentially strong impact in the diagnosis and treatment of numerous neurological conditions. In this work we study a new methodology for extracting information from EEG signals from patients suffering from epilepsy. The methodology is based on a multi-resolution wavelet representation and a statistical generalized Gaussian model, which provide a compact description of the time-frequency information in the EEG signal array. Preliminary experiments suggest that the information captured by the model is potentially useful for effectively detecting the onset of epileptic seizures, which is key for epilepsy diagnosis and treatment.
1 Introduction
Appropriate diagnosis and treatment of epilepsy is a main public health issue. Patients suffering from this disease often exhibit epileptic seizures, which result from the synchronous and excessive discharge of a group of neurons in the cerebral cortex. Epileptic seizures usually have a sudden onset, spread in a matter of seconds or minutes and, in most instances, are brief. The manifestation of a seizure depends on where in the brain it starts and how far and fast it spreads, and correctly identifying this information is key to treatment.
Electroencephalography (EEG) is a non-invasive and widely available biomedical modality that can be used to diagnose epilepsy and plan treatment. One particular task that has received a lot of attention is the detection of epileptic seizures from EEG signals measured on the brain scalp. It is widely acknowledged that detection can be improved by summarizing the EEG signals using relevant descriptors; that is, quantities computed from the EEG signals that capture the main relevant features of
the seizure and whose values help discriminate between normal and abnormal brain activity. The most relevant EEG features studied in the literature can be classified in 3 groups: a) spectral properties such as band power and edge frequency; b) signal morphological properties such as wave amplitude, sharpness, line length, zero crossings; and c) statistical descriptors such as statistical moments, correlation times, entropies, etc. (see [7]-[14] for some works on this topic).
In this work we investigate a statistical model for summarizing EEG signals and highlighting epileptic seizures. The remainder of this document is structured as follows. Sections 2 and 3 describe the proposed statistical methodology that is used to describe EEG signals and highlight epileptic seizures. This methodology is then applied to real EEG signals from patients suffering epileptic seizures in Section 4. Discussions and conclusions are finally reported in Section 5. Notice the potential applications of this work in E-health, for instance in telemedicine where physicians evaluate patients remotely.
2 Mathematical Concepts
Before presenting the proposed methodology we define the statistical model that is considered in this work. The univariate generalized Gaussian distribution (GGD) is a flexible statistical model for one-dimensional signals that has found numerous applications in science and engineering (see [2], [3], [4], [5], [6] for more details and examples). This parametric distribution has 3 parameters, and its probability density function (PDF) is given by:
f x;
(
µ,σ ,β)
= β 2α(σ )Γ 1 β exp −(x− µ) β 2σ2 (2) withα
(σ
) =σ
Γ 1( )
β
Γ 3( )
β
, Γ z( )
= e−te− z−1dt, z > 0 0 +∞∫
(3)and where µ ∈ℜ is a location parameter, σ ∈ℜ+ is a scale parameter and β ∈ℜ+ is a shape parameter that controls the shape of the density’s tail. The PDF (2) has many properties that are useful for modeling: i) the value of (2) approaches zero as x approaches positive and negative infinity, ii) the mean and mode of (2) is µ, iii) (2) is symmetric with respect to µ. Notice that the GGD parametric family comprises many popular distributions that are commonly used in biomedical signal processing. For example, setting β=1 leads to a Laplacian or double-exponential distribution, β=2 to a Gaussian or normal distribution, and β→∝ to a uniform distribution. We refer the reader to [1] for a comprehensive treatment of the mathematical properties of the GGD model.
3 Methodology
We are now ready to describe the proposed methodology and its application to EEG signals. The first step of this methodology is to represent the signals using a time-frequency representation. This step will allow separating each EEG signal in the array of signals into different frequency bands with specific anatomical behaviors (clinicians typically use the bands 0-1Hz, 1-2Hz, 2-4Hz, 4-8Hz and 8-16Hz to capture different types of neurological activity). In this work this is achieved by using a Dauchebies wavelet decomposition with 5 resolution scales, designed to capture the bands described above [10]. From the wavelet decomposition it is then possible to assess how the energy in the signal is spread over the frequency spectrum, and how this distribution evolves over time.
Once the array of EEG signals has been transformed to the wavelet domain (notice that this operation can be done “online” as the signals are acquired), we divide the wavelet coefficients associated with each of the 5 resolution scales into groups corresponding to 2-minute time frames or windows. In this work we use overlapping groups with an overlapping factor of 119 seconds (i.e., frames differ by 1 second). Notice that the wavelet transform used is orthogonal and therefore these coefficients contain all the information of the array of EEG signals.
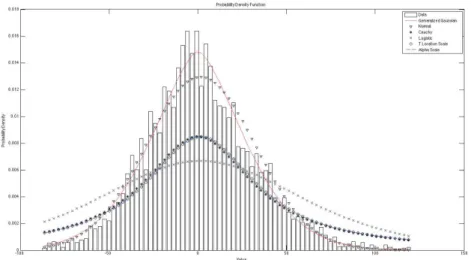
The third main step of our methodology is to summarize the information contained in each group of wavelet coefficient by modeling their statistical distribution with a GGD. Precisely, for each group of coefficients (that is, each time resolution level and each time window), we compute the statistical estimates of the GGD parameters defined in (2). Given that EEG signals have zero mean we have µ=0, and it is only necessary to estimate σ and β. Here we have computed these estimates using the algorithm [6] that computes estimates for α(σ) and β. For comparison we contrasted visually the fit of the GGD model with other statistical models: Normal, Cauchy, Logistic, T-Location Scale and Alpha-Scale, we found that the GGD often produces the best results, see Figure 1. We also used goodness-of-fit measures such as the Kolmogorov-Smirnov test and Cramer-von-Mises test to evaluate the GGD model and obtained satisfactory results (p < 0.05) that were in agreement with the results from the literature [16], [17].
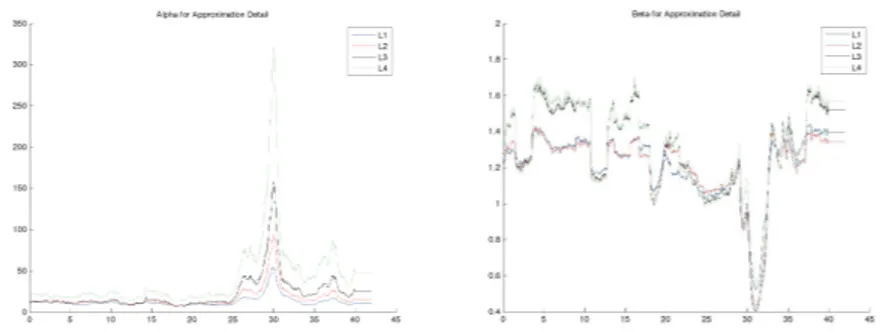
In this work we study the hypotheses that rapid changes in the values of α(σ) and β over time (at least for certain frequency bands) reveal the onset of an epileptic seizure, see Figure 2. Also we have investigated this hypotheses by monitoring the values of α(σ) and β for each frequency band over time and identifying visually the points in which significant rapid changes occur. The development of automatic detection methods is currently under investigation.
The performance of the proposed seizure onset detector was evaluated using the Children's Hospital Boston database [15], which consists of 36 EEG recordings from pediatric subjects with intractable seizures. In this work we used 30 crisis from 10 subjects. A set including two to five bipolar EEG recordings sampled at 256Hz were
available for each subject. Each recording contained a seizure event with a labeled onset that was detected by an experienced neurologist, who worked backward from the observed clinical onset to find the electrographic onset. The signals epochs have 42 minutes, 30 minutes before crisis and between 10 to 12 minutes after crisis, depending on the duration of the crisis.
No distinctions regarding the types of seizure onsets were considered; the data contains focal, lateral, and generalized seizure onsets. Furthermore, the recordings were made in a routine clinical environment, so non-seizure activity and artifacts such as head/body movement, chewing, blinking, early stages of sleep, and electrode pops/movement are present in the data. The set of recordings lasted on average 35 minutes for 30 subjects in total; 2 hours for 4 subjects; and 12 hours for 2 other subjects. Taken together the recordings account for 60 hours of EEG recordings and 139 seizures [15].
Fig. 1. This Distribution-Fitting example shows the best fit for different distributions: GGD (__), Normal (∇), Cauchy (*), Logistic (Χ), T-Location Scale (ο) and Alpha-Scale (--); the plots present a Generalized Gaussian distribution how the best options; Normal distribution has a good performance and Cauchy, T-Locale Scale and Alpha-Scale distributions present a similar shape, however they do not comply in full fit; also for Logistic distribution.
4 Results
The proposed methodology for detecting epileptic seizures was assessed using the Children's Hospital Boston database described above. Performance was measured using conventional sensitivity and specificity criteria, defined as !"#$%&%'%&()* +,&-.* +/$012+,&-.*!"%345"$0, where TPs mean True Positives, and !6"7%8%7%&(*2!0*)*+,&-.* 9/*&%:";*+,&-.*<,#=!"%345"* &%:", where FPs mean False Positives. The sensitivity results we obtained are 0.77 for (the visual inspection of) α(σ) and 0.80 for β. The
specificity results we obtained are 0.27 for α(σ) and 0.23 for β. For completeness we also evaluated the latency of our method, which we found to be on average 0.17 seconds for both parameters.
Fig. 2. For illustration, this figure shows the trace plots of α(σ) and β for one
spectral band. These plots have been computed from the array of EEG signals of a patient that exhibited an epileptic seizure at minute 30 (!–axis). We observe that the values of α(σ) and β are indeed very sensitive to this event and clearly highlight the period when the seizure takes place.
5 Discussion
The appropriate detection of epileptic seizures from EEG signals is very important for the diagnosis and treatment of epilepsy, and has key applications in a clinical facility setting as well in E-health. In this work we have investigated the use of a new methodology for detecting seizures from EEG signals. This methodology is based on a GGD statistical model for the wavelet representation of the signal. Preliminary results suggest that the parameters of this model are very sensitive to epileptic seizure and therefor potentially interesting for devising automatic detection algorithms.
Perspective for future work include an extensive evaluation of this methodology, comparisons with other detection methods from the state of the art, the development of fusion methods that combine many detection techniques to increase robustness to noise and artifacts, and a study of seizure intensity, duration and spread, and other characteristics.
6 Acknowledgements
Part of this work was funded by the SuSTaIN program - EPSRC grant EP/D063485/1 - at the Department of Mathematics, University of Bristol.
References
1. Nadarajah, S.: A Generalized Normal Distribution. In: Journal of Applied Statistics. (2005) 32:7, 685-694.
2. Bazi, Y., Bruzzone, L., Melgani, F.: Image thresholding based on the EM algorithm and the generalized Gaussian distribution. In: Pattern Recognition 40 (2007) 619–634.
3. Hesse, C.W., Holtackers, D., Heskes, T.: On The Use Of Mixtures Of Gaussians And Mixtures Of Generalized Exponentials for Modelling and classification of Biomedical Signals. In: Belgian Day on Biomedical Engineering, IEEE Benelux EMBS Symposium (2006).
4. Bicego, M., Gonzalez-Jimenez, D., Grosso E., Alba Castro, J.L.: Generalized Gaussian Distributions for Sequential Data Classification. In: IEEE International Conference Proceedings on Pattern Recognition (ICPR08) 1-4, (2008).
5. Novey M., Adalı, T., Roy, A.: Complex Generalized Gaussian distribution Characterization, Generation, and Estimation. In: IEEE Transactions on Signal Processing 58:3 (2010). 6. Pascal, F., Bombrun, L., Tourneret, J.Y., Berthoumieu, Y.: Parameter Estimation For
Multivariate Generalized Gaussian Distributions. In: IEEE Transactions on Signal Processing, 61:23 (2013).
7. Gotman, J.: Automatic recognition of epileptic seizures in the EEG. In: Electroencephalography and Clinical Neurophysiology. 54:530–545 (1982).
8. Agarwal, R., Gotman, J., Flanagan, D., Rosenblatt, B.: Automatic EEG analysis during long-term monitoring in the ICU. In: Electroencephalography and Clinical Neurophysiology, 107(1): 44–58 (1998).
9. Bergey, G. K., P. J. Franaszczuk.: Epileptic seizures are characterized by changing signal complexity. In: Clinical Neurophysiology. 112(2):241–249 (2001).
10. Subasi, A., Alkana, A., Koklukayab, E., Kiymik M.K.: Analysis Of Epileptic Seizure Detection Methods Based on Parameter Estimation, Power Spectrum Density And Morlet Wavelet Transform. In: Neural Networks 18 985–997 (2005).
11. Diambra, L., Bastos de Figueiredo, J., and Malta, C.: Epileptic activity recognition in EEG recording. In: Physica A 273 495– 505 (1999).
12. Paivinen, N., Lammi, S., Pitkanen, A., Nissinen, J., Penttonen, M., Gronfors, T.: Epileptic seizure detection: A nonlinear viewpoint. In: Computer Methods and Programs in Biomedicine 79, 151–159 (2005).
13. Bruzzo, A.A., Gesierich, B., Santi, M., Tassinari, C. A., Birbaumer, N., Rubboli,G.: Permutation entropy to detect vigilance changes and preictal states from scalp EEG in epileptic patients. A preliminary study. In: Neurological Sciences. 29:3–9 (2008).
14. Zandi, A. S., G. A. Dumont, M. Javidan, R. Tafreshi.: An entropy-based approach to predict seizures in temporal lobe epilepsy using scalp EEG. In: IEEE Conference Proceedings Engineering in Medicine and Biology Society. 228–231 (2009).
15. Shoeb A, Edwards H, Connolly J, Bourgeois B, Treves T, Guttag J.: Patient-specific seizure onset detection. In: IEEE Conference Proceedings Engineering in Medicine and Biology Society. 1:419-22 (2004).
16. Anderson, T. W.: On the Distribution of the Two-Sample Cramer-von Mises Criterion. In: Annals of The Institute of Statistical Mathematics. 33:3, 1148-1159 (1962).
17. Nafornita, C., Berthoumieu, Y., Nafornita, I., Isar, A.: Kullback-Leibler Distance Between Complex Generalized Gaussian Distributions. In: 20th European Signal Processing Conference (EUSIPCO 2012) Bucharest, Romania (2012).