Macrodynamics of Economics: A Bibliometric History
François Claveau1 and Yves Gingras2
This document is the post-refereeing version of History of Political Economy 48-4 (2016): 551-592. Abstract
A history of specialties in economics since the late 1950s is constructed on the basis of a large corpus of documents from economics journals. The production of this history relies on a combination of algorithmic methods that avoid subjective assessments of the boundaries of specialties: bibliographic coupling, automated community detection in dynamic networks and text mining. These methods uncover a structuring of economics around recognizable specialties with some significant changes over the time-period covered (1956-2014). Among our results, especially noteworthy are (a) the clearcut existence of 10 families of specialties, (b) the disappearance in the late 1970s of a specialty focused on general economic theory, (c) the dispersal of the econometrics-centered specialty in the early 1990s and the ensuing importance of specific econometric methods for the identity of many specialties since the 1990s, (d) the low level of specialization of individual economists throughout the period in contrast to physicists as early as the late 1960s.
Keywords: Specialty structure, macrohistory of disciplines, bibliometrics, network
analysis, automated community detection, quantitative history of science
Introduction
Academic disciplines have grown enormously since the Second World War and economics is no exception. Among the economics articles indexed in Thomson Reuter’s Web of Science, around a thousand were published in 1956, while nearly twenty thousand are annually published today. This increase amounts to an average annual growth rate between 5 and 6 percent, which is comparable to the global annual growth of science over the same period (Larsen and von Ins 2010). To be sure, these numbers give only a rough indication of the growth of economics because the Web of Science does not index all academic articles, but only a subset appearing in
1 Université de Sherbrooke, Department of Philosophy and Applied Ethics; Centre
interuniversitaire de recherche sur la science et la technologie. francois.claveau@usherbrooke.ca
2 Université du Québec à Montréal, Department of History; Centre interuniversitaire de
the major academic journals around the world. Yet, these rough numbers are sufficient to indicate the magnitude of the transformations that have affected the scale of scientific research in general and in economics in particular over the last half century.
Although traditional types of analysis of the development of economics – textual analysis of published documents and archives, interviews, biographical reconstruction of major figures, genealogy of concepts and methods – remain useful, specific tools are worth exploring to grasp the global structure and morphology of economics as it changed over the second half of the twentieth century. This article introduces a combination of such tools to the history of economics. We combine bibliometrics with dynamic network analysis to identify a changing specialty structure in economics from the late 1950s to 2014. We map how specialties have emerged, grown in relation to each other and (for some of them) disappeared. Our results nicely combine with more narrative accounts of the recent history of economics (for instance, Backhouse 2002, ch.14; Backhouse and Cherrier 2014; Morgan and Qin 2015): they confirms certain claims that can be found in the existing literature and identify intriguing patterns that invite more in-depth, qualitative research. (See section 5)
Bibliometric data have been used in economics, but essentially for descriptive statistics with evaluative purposes – for instance, rankings of journals and most-cited authors (Kalaitzidakis, Mamuneas, and Stengos 2003; Kodrzycki and Yu 2006; Ritzberger 2008; Stern 2013; Zimmermann 2013; Card and DellaVigna 2013). Only a few articles using bibliometric data from economics have no explicit evaluative goal, focusing rather on the structure of authorship and the methods used in articles in a small number of so-called ‘top’ journals (Hamermesh 2013), on identifying the characteristics of the most-cited articles (Kim, Morse, and Zingales 2006) or on describing the evolution of the number of papers in a given research domain (e.g., Silva and Teixeira 2008, 2009).
To our knowledge, this article is the first in the field of the history of economics to combine bibliometric data and dynamic network analysis. In addition, our corpus of around 415,000 documents is vastly larger than the corpora used in most other studies on the history of economics.3 Our article follows in the footsteps of a number
3 The closest research on the history of economics we are aware of is Kelly and Bruestle (2011)
in which the proportion of articles in each general JEL subject category is tracked through time. One downside of this approach is that it has to accept at the start the JEL categories as an appropriate grid to classify economics. Our approach lets the algorithm generate the grid at each period of time. Another downside is that their approach cannot be exported to disciplines that do not have institutionalized classificatory schemes such as JEL codes. In contrast, our article is inserted in a larger project aimed at mapping specialty structures in various disciplines. We also start the analysis in 1956 while they start in 1970.
of studies that have shown that bibliometrics and network analysis are particularly well suited for large scale studies of the historical development of scientific disciplines and specialties (Garfield 2009; Cole, Cole, and Dietrich 1978; Boyack, Börner, and Klavans 2009; Gingras 2010a, 2010b, 2010c; Gingras and Schinckus 2011). The great advantage of combining bibliometrics and network analysis is the possibility to algorithmically detect and visualize patterns in the research output of large groups. Patterns that might remain hidden or blurred with standard historical methods suddenly come in full light.
The main results and analysis are in section 5. What is uncovered is a structuring of economics around recognizable specialties with some significant changes over time and up to the end of our period. Figure 4 is the most informative representation of our results in an article format. But there is an even more revealing representation in the form of an interactive web platform, which combines figure 4 with much more information.4 Before presenting and analyzing the results, the next four sections describe the conceptual framework, the general method adopted, the data and the specific empirical procedure. We have decided to reduce the technical information to a minimum in the article; the interested reader is referred to our technical appendix.
1. Conceptual Framework: Economics as a Network of
Specialties
In any mature scientific discipline, the scientific community is in fact composed of relatively autonomous sub-units (the specialties) in which new knowledge is made public through publications. These different specialties, which emerged over time with the morphological growth and ensuing division of labor within the discipline, are more or less connected to each other, much as the discipline itself is more or less connected to other disciplines making up the global scientific field. Whereas the discipline usually corresponds to the entry-level basic (BA) training in a university department, the specialty corresponds more to the research level learned at the MA and PhD levels and lead to new knowledge production (Hagstrom 1965; Cole and Cole 1973; Whitley 1976; Whitley 2000; Bourdieu 2004; Wray 2005).
Disciplines are not eternal, but they tend to be much more stable and institutionalized – as university departments for example – than specialties (Abbott 2001). We could have looked at the changing links and boundaries between economics and other disciplines such as sociology or psychology. Instead, our
4 The web platform is located at:
http://epistemologiepratique.recherche.usherbrooke.ca/digital-history/economics/. We thank the History of Economics Society and the Université de Sherbrooke for financial support.
analysis here focuses on the changing internal structure of economics and thus reconstructs the dynamics of emerging and dying specialties within a given discipline (economics).
Some clarifications of our notion of specialties are in order. First, the claim that a discipline is divided into more or less autonomous specialties is compatible with the claim that it has a core set of theories or methods that most, if not all, specialties rely on.5 Differential equations are all over physics and basic equations, such as Maxwell's equations, are also widely used. Similarly, the biomedical sciences make massive use of randomized control trials, although research in oncology and in psychiatry are most probably not in the same specialty. In economics, a large fraction of research relies on a common set of general econometric methods and rational choice models. One might even say that the sharing of these two elements make economics hold together as a discipline. Yet, research on the budget allocation of poor households in Bangladesh is quite different from theoretical research on optimal monetary policy.
To pursue this point further, we must note that the idea of a specialty structure is also compatible with the widespread view of economics that it has a core that is then applied to different objects (e.g., Ruggles 1970). At a given point in time, some of the specialties might be properly understood as working on developing the future core. For instance, one might think that, early after the second World War, research on general equilibrium and in econometric theory produced the core theories and methods that have been applied in the following decades to a vast number of topics – this is, in fact, not far from what we find (see section 5.1). In terms of specialties, this view of economics implies that we should find two specialties working on general equilibrium and econometric theory early after the Second World War. These “core” specialties would first develop in parallel with other specialties, but – for these specialties to become the “core” – a period of diffusion would need to follow. The peripheral specialties would come to rely on this core to various degrees. They might even lose their distinct identity and merge with others in the process. During this process of diffusion, other specialties might emerge that work on fundamental topics and strive to influence peripheral specialties, thus becoming the new core (if they succeed). Finally, a core that remains stable for some time can undergo what Robert K. Merton (1968, 35) famously labelled “obliteration by incorporation”: researchers, taking this core for granted, will come to refer little to the foundational work, rather focusing on connecting explicitly to more recent research that adapts this core to the concerns of their specialty.6
5 We thank Beatrice Cherrier for encouraging us to be more precise on this point.
6 In future work, we plan to identify, through the relative dispersion of citations, the specialties
Our second clarification comes from the distinction between specialties and the fields of researchers. We conceive specialties as cognitive divisions, rather than organizational divisions among a population of researchers based on their primary professional afsuccessions. The implication is that the specialty structure does not map each researcher to a single specialty. In fact, some of our results relate to how much economists straddle the specialties of their discipline in comparison to physicists (see section 5.2).
Third and finally, we take the research article as the transmittable knowledge unit
par excellence and thus understand specialties as constituted by a set of articles
having a relatively high cognitive similarity compared to the rest of articles in the discipline. Cognitive similarity can be due to the sharing of various aspects: shared empirical objects (e.g., education or finance), shared methods (e.g., time series or cross-section econometrics), shared theoretical traditions (e.g., neoclassical or Sraffian economics). Which aspects are more important in determining the identity of specialties depends on context. One advantage of the method we use is that we do not have to a priori decide which aspect must predominate. As we describe below, we use the method of bibliographic coupling to measure cognitive similarity.
2. Methods
To move from this conceptual understanding of disciplines and specialties to a procedure making it possible to follow their development over time, we have to define a measure of the cognitive similarity of two units. This measure will be used to decide whether or not the units belong to the same specialty.
An informal procedure to assess similarity is to rely on insider knowledge: scientists from the discipline often use their trained judgment to evaluate how closely related various bits of research are. Though this informal procedure is often at the source of standard classifications of disciplines and fields, it comes with likely biases (see Cherrier 2015 for a history of the difficult task of updating JEL codes). First, it judges similarity from the available categories for distinguishing specialties. It risks being backward-looking for recent research and might thus force the newest publications into categories that do not correspond anymore to the state of the field. Even if it tries to be forward-looking, determining what is likely to become important is a difficult prognosis. For older research, it risks being anachronistic: without sound historical knowledge, one might try to impose current categories that did not apply then. Second, it is vulnerable to strategic claims of similarity and distinctness. Scientists have personal interests at stake in the identification of research that is purportedly close or distant to their own. It might be valuable to be associated to some favorably perceived research or to be perceived as unrelated to other research. It might be even more important for a group to be recognized as distinct and have, for
instance, its own JEL code. This boundary work (Gieryn 1983) inside science contaminates the informal assessment of similarity.
At the world level of the discipline where thousands of units are involved, approaches fully relying on insider knowledge of the discipline are even less appealing. Our alternative procedure starts by defining the knowledge units of a
discipline as the documents that are published in journals recognized in that
discipline (Meadows 1974; Hagstrom 1965; Merton 1973). To delimit specialties however, no subjective understanding is relied on, since cognitive similarity can be measured from the references contained in the documents of the corpus. Indeed, the method of bibliographic coupling offers a manner to connect two publications on the basis of the similarity of the lists of documents they refer to (Kessler 1963).
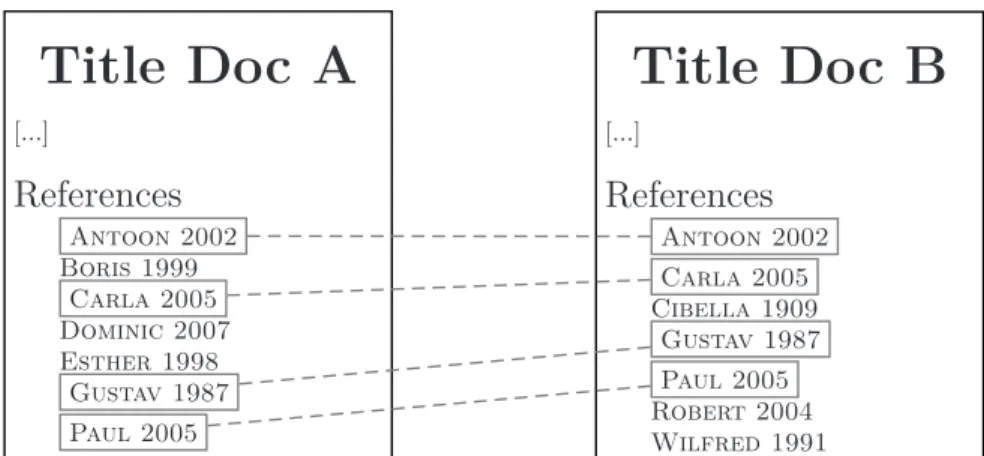
Bibliographic coupling is thus used here to measure similarity between two documents: two documents are considered close to each other when there is a high proportion of overlap in their references. For example, two documents in economics might, at one extreme, contain highly similar work – e.g., same theoretical literature, same object, same method – and thus have almost identical lists of references. At the other extreme, two documents can both be published in economics journals – thus being in the same discipline – but have little else in common. These two documents might have not a single shared reference. They are then probably associated with two very distant specialties of the discipline. The exact measure of similarity between two documents that we use is the number of shared references divided by the square root of the product of the number of references in each document – i.e., the widely used cosine measure (Salton and McGill 1983). Figure 1 illustrates the bibliographic coupling of two documents.7
A fundamental assumption of bibliometrics is that bibliographic coupling is an appropriate empirical indicator of the cognitive similarity of two documents. The culture and functions of citations in science offer a solid justification for this assumption. Some key functions of citations are to recognize intellectual priority (Kaplan 1965) and persuade the targeted audience of the novelty and validity of one’s research (Gilbert 1977). To perform these functions, authors selectively pick their references based on what they judge relevant to the cognitive content of their paper and what they think their audience will find relevant. It is thus likely that two documents belonging to the same specialty will have a higher proportion of references in common than two documents that are more cognitively distant. In sum,
7 It is worth noting that one could also construct the cognitive structure of the discipline by
using a complementary manner of creating connections between documents, namely the co-citations method. From that point of view, which usually gives results similar to bibliographic coupling, two documents are close to each other when they are frequently cited together in other documents (Small and Griffith 1974; Sullivan, White, and Barboni 1977).
the assumption that the similarity in references is an appropriate indicator of proximity and of belonging to a given specialty is well supported by what we know about the culture and functions of citations in science.
Now that we have an operational definition of cognitive similarity between two documents, we could use different methods to identify the specialties inside the discipline. Multidimensional scaling (MDS) in association with hierarchical clustering is often used (e.g., Kreuzman 2001), but it is much less effective when the corpus includes thousands of documents. Network analysis is a much more powerful method when used in conjunction with community detection techniques (Wallace, Gingras, and Duhon 2009). The nodes of the networks are documents and the intensity of the connections (the edges) between them is given by the bibliographic coupling of each pair of documents.
We can group nodes (documents) in communities8 by partitioning the set of all nodes in the network. An appropriate partition should group together nodes that are strongly linked – documents with highly overlapping references – and put in different communities nodes that are not linked – documents with no shared reference. The standard measure for the goodness of a partition is called modularity and community detection proceeds by attempting to select the partition maximizing this measure (Newman and Girvan 2004). Modularity is further discussed in Section 4 and in the
technical appendix.
These tools will help us analyze the evolving specialty structure of economics. Each specialty will correspond, at a given time, to a subset of the larger network defined by the discipline as a whole. At a larger scale, the same method could be used to partition the whole field of science in different disciplines (Börner 2010). Instead of doing that, we first define economics using a set of journals already recognized within that discipline and included in the Web of Science database. Then, the different specialties emerging over time are determined in an automated fashion by the similarity of the references contained in the documents. No predetermined classification schemes are used to identify specialties. After the specialty structure is produced, each specialty is named by retrieving the terms in the titles of its documents that are most characteristic of it.
8 Communities is the technical name in this literature for the groups of nodes found by the
detection algorithm. It is not necessary identical to a specialty: the latter is made of communities, but some communities might not be specialties. We will define the relevant terms in section 5.
3. Data
The data used in this analysis come from the Web of Science of Thomson Reuters. This database samples the entire academic literature; a subset of it corresponding to economics is used here. The corpus has been defined in four steps (see the technical appendix for details).
First, a subset of journals in the Web of Science has been selected and divided into mainly-economics and partly-economics journals. The earliest economics publications indexed go back to 1899 and our sample runs until 2014. Second, documents in these journals have been retained according to different criteria for the two types of journals. The documents that are kept are only articles, notes and reviews containing references. Figure 2 illustrates the evolution of the number of journals (both mainly and partly economics) and the number of documents published per year in our corpus since 1956.
Third, a starting date for the corpus has been determined based on considerations of data quality. This study makes extensive use of data on references. Unfortunately, the quality of the available data is low for the earliest documents covering the period 1899-1955. For these early years, crucial fields such as first author, publication name or year of publication are empty for a great number of references. In these circumstances, identifying the document to which the information refers is difficult. Even after developing a custom identifier for references in order to maximize identification (described in the technical appendix), less than two thirds of the references are identified prior to 1956. This two-third threshold was chosen as the cutoff point. We will not report results prior to 1956 because the quality of data on references is too low.
In the fourth and last step of our corpus selection, it was decided to remove some documents that have vastly more references than the others. This step led to the removal of 8 documents. It is a precautionary measure: we do not want our results to be driven by these few peculiar papers. The final corpus is made of 401,278 documents from 536 journals listing a total of 10,381,564 identifiable references.
Our corpus changes in many respects through time. It has already been noted that the number of documents grows. One other crucial variable for us is the average number of references per document, which has also steadily grown (see Figure 3). Since the dynamic network that we construct uses documents as nodes and the references to generate the edges, we must be careful in interpreting some of the dynamic properties that we will uncover.
4. Empirical Procedure
Economics changes through time and this should be reflected in the structure of its publications. To follow this evolution, this study defines a window of 5 years representing a snapshot of publications at a certain moment. This window is moving through time: it starts with the time window 1956-1960, then moves to 1957-1961, and continues moving forward, one year at a time, until it reaches the last time window 2010-2014. The size of the window (5 years) is selected from a mixture of considerations. A window of one year is certainly too narrow: given the academic context (e.g., multiple delays in research and in publication), it is typical that papers published a few years back are considered contemporary. Adopting a one-year window also implies that successive snapshots will have no documents in common. In contrast, a multi-year window captures the intuitive idea that a specialty replenishes itself and evolves thanks to new contributions to it, while the older contributions gradually become part of the background. At the other extreme, a window of ten years is probably too wide: a ten-year-old contribution is usually not considered contemporary. In between these extremes, a time window of 5 years seems reasonable. It acknowledges the delays inherent to research and publishing and it implies that two successive time windows share a little less than 80 % of their documents. In the technical appendix, we also show the results with a window of 3 years. Overall, the specialty structure is highly robust to this change in the size of the time window. We will mention in the next section one pattern that is significantly different.
In the dynamic network, the nodes for a specific time window are the documents published in this window and the weighted edges are the number of references that two nodes share normalized with the cosine measure. On this dynamic network, we can apply techniques of automated community detection to group nodes together.
The algorithm used here attempts to maximize “modularity”, which is “a measure of the quality of a particular division of a network” (Newman and Girvan 2004, 7). Since exact maximization of modularity is computationally hard (Brandes et al. 2008), we use a popular approximate algorithm: the Louvain method (Blondel et al. 2008). This method has been shown to produce partitions with values of modularity at least as high as partitions found with other algorithms. It is also computationally efficient.9 A great advantage of the Louvain method for this study is that it can easily be adapted to a dynamic network.
9 For an argument in favor of using the Louvain method on co-citation data, see Wallace,
The Louvain method was originally developed for static networks and thus needs to be adapted for dynamic networks. The key to our modification (suggested by Aynaud and Guillaume 2010, 510–11; Aynaud 2011, sec. 3.5) is to run the algorithm for each time window, but to insert information from the previous time window in the initialization of the algorithm (for details, see the technical appendix). To have prior information even for the first window in our period (i.e., window 1956-1960), we start the process as far back as window 1899-1903, but show only results for in-period windows. For each window, the algorithm gives a partition of the documents into communities. A measure is then used to determine whether a community in time window w and one in w+1 are one and the same cluster.10
Here is the measure used in this study. Denote by Dw,w+1 the set of documents that
are in both time windows, by di ⊂ Dw,w+1 the subset of these documents that happen
to be in community i in window w, and by dij ⊂ di the subset of this subset with the
additional property of being in community j in window w+1. The relevant metric is γij = |dij|/|di|,
where |d| is the cardinality – the number of elements – of d. In short, metric γij is
giving the fraction of heritable nodes of i that j gets.
In this study, when γij ≥ 0.65, community j is considered a child of i.11 If community
j is the child of only community i, both communities are taken to be the same cluster
persisting through time. We thus have clusters surviving and changing size through time. If a cluster survives through a few windows, we can consider it as an existing
specialty. But specialties are born and die – the cognitive organization of economics
is dynamic. If j is the child of two (or more) communities, j is identified as the realization of a new cluster resulting from the merging of two (or more) clusters. Cluster merging is one type of relation of succession among clusters. In this case, more than one cluster disappear and another cluster is born in the process. This event is particularly significant when some of the merging clusters have been long-lived or when the merged cluster will be long-lived. In these cases, we are observing the reorganization of specialties. When all the involved clusters are short-lived, the
10 We attribute technical meanings to the terms ‘community’ and ‘cluster’. A community is nothing more than a subset of documents in a given time window, the subsets being determined by the community detection algorithm as applied to the time window. A cluster is a sequence of communities, one per time window for the life length of the cluster. If a cluster lives only one time window, it is identical to a single community.
11 For a justification of this threshold and the other threshold used below, see the technical
situation is better understood as one of weak divisions, not of rapidly changing specialties.
Another type of succession beyond mergers is the splitting of clusters: in this study, if there is no j such that γij > 0.65 and there is at least one j such that γij > 0.25, the
cluster of i is taken to have split. Again, the significance of a split regarding the dynamics of specialties hinges on whether it involves long-lived clusters or not.
Finally, we have cases of unilateral births and deaths. If a community is neither a child of one or many previous communities nor the result of a split, we have a case of the birth of a new cluster from scratch. Similarly, if a community i is such that γij ≤ 0.25
for all j, this cluster is taken to have simply dispersed, leaving behind neither a child nor a new cluster from its split.
Note that, in order to keep the description focused on important aggregate properties of the discipline, one further restriction is imposed: only the communities regrouping at least 1 % of the papers in a given time window are considered. The smallest communities are thus left out of the analysis. This restriction helps the analysis avoid being distracted by splits, mergers and dispersions involving only a tiny and unstable fraction of economics. This restriction combined with the content of our corpus also means that the specialty structure uncovered in this article is a ‘’global’’ structure dominated by English-American publications, which form the bulk of our corpus. Only regional research strands that are big and well-structured have a chance of being detected by our procedure.12
The method described so far groups nodes into dynamic clusters by using a modified Louvain method and a metric γij. Once we have clusters, we want to have an
overview of the documents they contain. What is the content of the research in the various clusters identified? To have such an overview, we produce a set of keywords for each cluster based on the titles of its documents.
Titles have been preprocessed with standard techniques in text mining: stop words, numbers and punctuations have been removed and the remaining words have been stemmed. Cluster naming then uses the relative frequencies of stemmed words. More specifically, we use the log-likelihood measure proposed by Rayson and Garside
12 Following the suggestion of an anonymous referee, we provide in the technical appendix what
the main representation looks like if the threshold is a number of documents (n = 10) instead of a percentage of the whole discipline. The general specialty structure stays intact, but the representation contains much more noise. We also discuss this alternative restriction below in footnote 15. For the researcher mainly interested in regional research strands, this exercise of changing the threshold indicates that a regional corpus and, perhaps, different methods should be used for this endeavor: looking below the 1 % bar does not give an enlightening picture of what occurred outside the Anglo-American nexus.
(2000) to retrieve (stemmed) words that are characteristic of each cluster (see the
technical appendix for details).
5. Results and Analysis
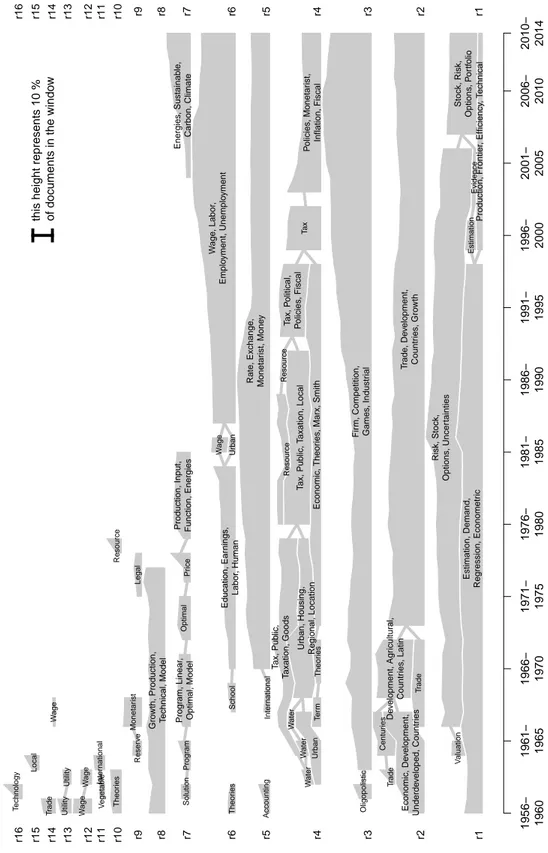
The most telling representation of our results suitable for a printed article is in Figure 4. This graphic represents all the detected specialties in economics over the whole period, their relative size through time (height of the polygons) and the clear successions due to splits and mergers (edges between polygons).
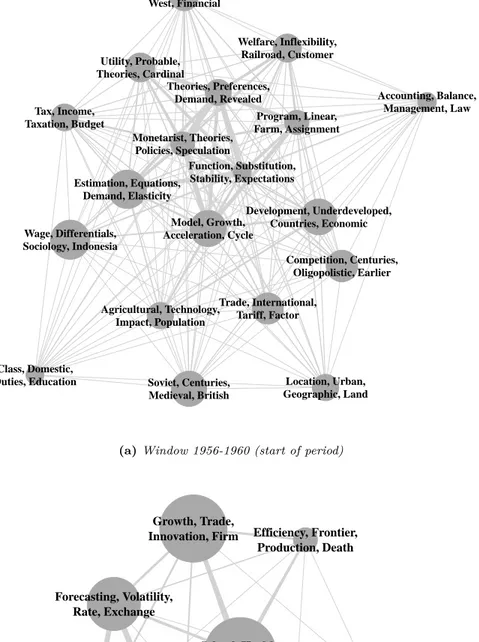
An even more insightful representation – this time not suitable for a printed article – is an interactive web platform.13 This platform combines the representation of Figure 4, which spans the whole period from 1956 to 2014, with snapshots of the dynamic network in every time window. In Figure 5, we present the snapshots of the first and last time windows. For each snapshot, nodes represent all the active clusters in this time window. Nodes sizes are based on relative shares of documents. The words on each node are the keywords associated with that cluster. The thickness of edges – i.e., the lines between nodes – and the proximity of nodes indicate the proximity of clusters in terms of proportion of shared references. That is, clusters that are close to each other and connected by a thick line are more similar than otherwise. The platform gives also information on each cluster – for instance, life length, characteristic keywords, most commonly cited works.
Since our results are rich, we encourage the reader to explore them with the help of the web platform and the Figures and Tables in this article. In this section, we want to analyze only a limited number of aspects of the results. We first discuss the 10 successions of specialties that are uncovered. We then turn to general properties of the specialty structure. Since the richness of our results might lead one to read too
much into them, we take care to express what we believe can and cannot be inferred
from our results.
5.1 The Transformation of Specialties
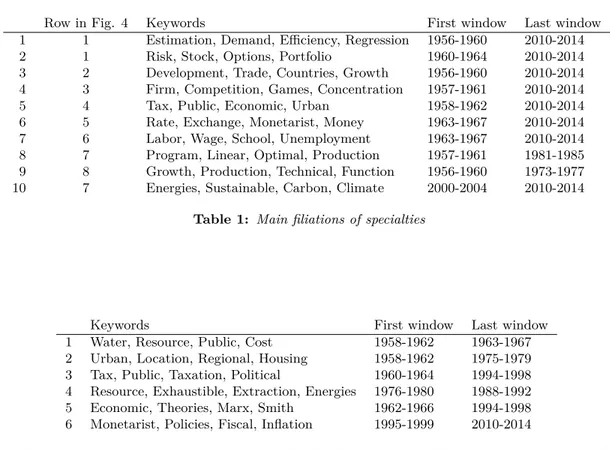
The polygons in our main representation (Figure 4) are clusters surviving for at least two time windows. Most of these clusters can be called specialties because they live long enough – we leave it to each reader to decide how long is long enough. Many clusters are connected to each other by relations of merger and split. We call a “succession of specialties” each set of clusters so connected when at least some clusters meet the condition to be specialties. Table 1 identifies the 10 successions of
13 To access it, please visit
specialties of economics from 1956 to 2014. Most live for almost all the period, while the last three span less than half of it. Some are made of few connected clusters, others have a more hectic existence. As will become clear below, even the ones that experience little mergers and splits change significantly throughout the period. We discuss each succession in turn.
1. The first succession, which spans our entire period, can without much risk be labelled econometric methods. It stays as a single specialty from time window 1956-1960 to window 1994-1998. Up to the mid 1980s, it most often refers to econometric textbooks: from Klein (1953) to, most importantly, Theil (1971 [1958]) and Johnson (1972). A transition occurs in window 1987-1991 when White's 1980 Econometrica article on heteroskedasticity jumps to the top of the citation list and stays comfortably there until the end of the specialty. This change is not primarily an evolution from a textbook culture to an article culture since it must be inserted into the larger dynamics of the discipline. In the 1980s, three other specialties become highly reliant on econometric methods (the second succession in row 1 of Figure 4 and the successions in rows 5 and 6). The methods developed also become more cognitively specific, for instance with a neater division between time-series econometrics and microeconometrics. As econometrics became “endemic, in various different forms, in the subfields of scientific economic research” (Morgan and Qin 2015, p. 10), it dispersed itself in our dynamic network. When the specialty splits after window 1994-1998, it gives birth to two small communities. The shortest lived, which continues citing White (1980) abundantly, comes after window 1997–2001 to merge with the succession in financial economics (to be discussed next). The other specialty remains small and focused on statistically measuring efficiency (referencing most often Farrell 1957; Charnes, Cooper, and Rhodes 1978; Aigner, Lovell, and Schmidt 1977). In sum, at the end of the period, there is not anymore a general purpose econometric specialty.
2. The second succession in row 1 of Figure 4 consistently has ‘stock’ and ‘risk’ among its keywords. It therefore seems totally appropriate to call it financial
economics. The succession stays as a single specialty for most of the period. In its
earliest time windows, Markowitz’s Portfolio Selection (1959) is the document with the most references. In the 1970s, Debreu’s Theory of Value (1959) takes over the first position. In the 1980s and the 1990s, the two most referenced documents become Jensen and Meckling’s ‘Theory of the firm’ (1976) and Black and Scholes’s ‘The Pricing of Options and Corporate Liabilities’ (1973). In the 1990s however, Kahneman and Tversky’s ‘Prospect Theory’ (1979) creeps to the third rank. After a small specialty reorganization in 2003-2007 (merger with the remnants of econometrics), this founding article of new behavioral economics14 becomes the most cited document of
14 The evolution of citations to Kahneman and Tversky’s article exhibits the “Nobel effect” (Gingras 2010b, 166): after Kahneman received the Bank of Sweden Prize in Economic Sciences in
the specialty, closely followed by Fama and French's ‘Common risk factors in the returns on stocks and bonds’ (1993).
3. In row 2 of Figure 4, we have a succession of specialties much focused on
economic development, trade and growth. Up to the 1970s, the specialties on economic
development – citing, for instance, Hirschman’s Strategy of Economic Development (1958) and Rostow’s Stages of Economic Growth (1960) – are distinct from the specialties on trade, which cite documents such as Johnson’s International Trade and
Economic Growth (1958). The two lines of specialties merge in time window
1969-1973. Hirshman's book remains highly cited in the 1970s while the specialty is by far the largest of the discipline with an average of 17 % of the documents per window. In the 1980s, the specialty slowly shrinks in relative size while it shifts to citing most often McKinnon's Money and capital in economic development (1973). In the late 1980s, a sudden shift in focus occurs with the rise of the new growth literature. Romer's ‘Increasing Returns and Long-Run Growth’ (1986) and Lucas’s ‘On the Mechanics of Economic Development’ (1988) swiftly install themselves as the most referenced documents by a wide margin, and Barro and Sala-i-Martin’s textbook
Economic Growth (1995) takes the lead in the late 1990s. One noteworthy aspect of
this shift to growth is that the previous literature on growth is in a separate succession which died in the mid-1970s (see Figure 4, row 8 and our discussion of this specialty below). It is only in the last few windows of the period that significant changes occur in the most referenced documents. Most importantly, Melitz's ‘The Impact of Trade on Intra-Industry Reallocations and Aggregate Industry Productivity’ (2003) sits in first position since window 2008-2012.
4. In row 3 of Figure 4, we find an extremely long-lived specialty with keywords ‘firm’, ‘competition’, ‘games’ and ‘industrial’. Its relative size stays modest from its birth in the late 1950s to the late 1970s, hovering around an average size of 8 % of the discipline. In its earliest time windows, it refers most often to Bain’s Barriers to
New Competition (1956). Scherer’s Industrial Market Structure and Economic Performance (1970) becomes more popular in the 1970s. We undoubtedly have here
a specialty we can label industrial economics. The 1980s is a period of change for this specialty, which starts significantly growing in relative size. Toward the end of the 1980s, new institutional economics has gained predominance, with two publications by Oliver E. Williamson as most referenced documents (Williamson 1975 and 1985). Noteworthy is also the first appearance in time window 1986-1990 of the term ‘games’ in the specialty's keywords. This shift in keywords supports the claim that industrial organization is the specialty where game theory first consolidated itself in economics (Backhouse 2002, p. 265). But the specialty mutated quite significantly in
2002, the annual number of citations to the article has kept growing instead of exhibiting the usual radioactive decay shape.
the process such that it cannot solely be identified with industrial economics in the most recent time windows. This topic undoubtedly remains with, for instance, Tirole’s Theory of Industrial Organization (1988) being among the three most referenced documents up to time window 2007–11. Other prominent research avenues include: institutional change with North's Institutions, Institutional Change
and Economic Performance (1990) being in the top 3 at the turn of the millennium,
and experimental economics. The latter is, in fact, dominant in the last time windows: the specialty's keywords lost most of their industrial-organization flavor (they are: ‘games’, ‘auctions’, ‘experimental’ and ‘competition’) and the three most referenced documents are in this experimental literature (Fischbacher 2007; Fehr and Schmidt 1999; Bolton and Ockenfels 2000). This diverse and refocused specialty is the largest in the 2000s, with an average of 23 % of the discipline per time window.
5. In row 4 of Figure 4, we discover the most tumultuous succession of specialties. Looking only at the keywords in Table 1 (i.e., ‘tax’, ‘public’, ‘economic’, ‘urban’), one might be tempted to identify this succession with public finance, but that is an oversimplification. To facilitate the analysis, we split this succession into shorter sequences of specialties that are listed in Table 2. The first sequence – small and short-lived – has a focus on efficient management of public resources. It merges with the second sequence after time window 1963-1967. This second sequence lives up to the late 1970s and, from its most referenced documents and its keywords, we can say that it centers around the topics of regional and urban economies. It merges with the third sequence, which is what looks most distinctively like a sequence focusing on public finance. Before the merger, this third sequence referred almost three times as much to Musgrave’s Theory of Public Finance (1959) than to its second most popular reference. The tides change rapidly after the merger. Downs’s Economic Theory of
Democracy (1957) becomes the most referenced document in time window
1980-1984 and later drops to the second rank after Barro's article ‘Are Government Bonds Net Wealth?’ (1974). In parallel to this transforming specialty, the fourth sequence of specialties, much smaller in size than the third, refers most often to Hotelling’s article ‘The Economics of Exhaustible Resources’ (1931) and indeed seems to focus on the topic of exhaustible resources. It merges with the third sequence after time window 1988-1992. In the early 1990s, this enlarged third sequence sharpens its focus on what we might call the economic analysis of politics (or, for short, public choice): its keywords now include ‘political’ and it refers most often to Olson's Logic of Collective
Action (1965), to Downs (1957) and to Barro (1974).
The story of this succession is not over because a fifth sequence that is born early in the period (window 1962-1966) finally interacts in the mid 1990s with the other large specialty. The identity of this fifth sequence is quite unlike what we have seen so far. It starts in the 1960s with a focus on the interest rate structure – referring most often to Hicks's Value and Capital (1939) and to Samuelson's Foundations of Economic
Analysis (1947). After a split in window 1969-1973, which leaves it smaller, the
referenced documents in the early 1970s are Schumpeter's History of Economic
Analysis (1954), Blaug's Economic Theory in Retrospect (1962) and Smith's Wealth of Nations (1776). In the mid 1970s, it takes a heterodox – mostly Marxian – flavor: the
name ‘Marx’ is part of its keywords from time window 1974-1978 to window 1987-1991, and Sraffa’s Production of Commodities by Means of Commodities (1960) is among its most referenced documents during the same period. This Marxian flavor is replaced in the early 1990s by a Keynesian seasoning: from window 1991-1995 to its last window (1994-1998), the specialty refers most often to Keynes's General Theory (1936) and has ‘Keynesian’ among its keywords. This appearance of Keynes is, from a broader perspective, a displacement: Keynes had been among the most cited authors up to the mid 1980s in the more mainstream specialty on macro/monetary economics (row 5 of Figure 4, to be discussed next).
Finally, the tumultuous succession of specialties in row 4 of Figure 4 ends by the merger of the small, historically-oriented specialty that we have just discussed with the larger specialty from the third sequence discussed above. This merger gives us the sixth sequence in Table 2. In the first time windows of this sequence, we have a clear mix of the previous two sequences, with both Keynes's General Theory and Olson's Logic of Collective Action among the most referenced documents. Yet, the sequence develops toward a focus on policy-oriented macroeconomics, with the most referenced documents becoming Calvo's ‘Staggered prices in a utility-maximizing framework’ (1983), Taylor's ‘Discretion versus policy rules in practice’ (1993) and Woodford's Interest and Prices: Foundations of a Theory of Monetary Policy (2003). The specialty at the end of the period – with its focus on macroeconomic (chiefly monetary) policy – is quite different from the former specialties in this tumultuous succession. Two elements are worth noting regarding this characteristic. First, it has to be connected with the evolution of the traditional macro/monetary economics succession (Figure 4, row 5) toward a widespread use of specific econometric methods (to be discussed next). Second, this succession between a former sequence of specialties focusing on public finance and public choice and a more recent specialty focused on macroeconomic policy should not be taken too strictly. Indeed, we have here the most important case of a characteristic that is not robust to a change in an assumption of our technique: the time windows of 5 years rather than 3. In the version of our analysis with 3-year-long time windows (see technical appendix), the succession focused on public finance and natural resources ends in the early 1990s and the specialty on macroeconomic policy develops in parallel. The lack of robustness of this characteristic does not mean that it should be totally discounted, but the interpretation of this instability would have to wait for a finner analysis of this part of economics than what we can do in this article.
6. The succession of specialties in row 5 of Figure 4 is much simpler to characterize than the previous succession. From the mid 1960s to the late 1980s, its main keywords steadily are ‘monetarist’, ‘rate’, ‘inflation’, ‘money’ and its most referenced document is Keynes's General Theory. The documents just following the General
Theory in popularity change however through this period: up to the mid 1970s, we
have Patinkin’s Money, Interest, and Prices (1965), Muth's article ‘Rational Expectations and the Theory of Price Movements’ (1961) has its years of glory in the late 1970s before being replaced with Lucas’s article ‘Some International Evidence on Output-Inflation Tradeoffs’ (1973) in the early 1980s. We thus have a cognitive specialty clearly dedicated to macroeconomic and monetary issues. Toward the end of the 1980s however, the specialty moves into vector autoregression techniques and, since then, the document receiving by far the most citations is Engle and Granger’s article ‘Co-Integration and Error Correction’ (1987). This emphasis on an econometric method applied to macroeconomic time series comes together with the development of a parallel specialty on macroeconomic policies (Figure 4, row 4, see the previous paragraph).
7. The last succession of specialties that endures for almost the whole period is in row 6 of Figure 4. The keywords in Table 1 already indicate its identity: ‘labor’, ‘wage’, ‘school’ and ‘unemployment’. It starts small relative to the discipline in the mid 1960s, but grows to become one of the two largest specialties since the mid 1990s. From its birth to window 1976-1980, it refers a lot more often to Becker’s Human Capital (1964) than to anything else. During the same period, its keywords indicate that it focuses on the topics of education and labor markets. In the early 1980s, it integrates the topic of ‘housing’ and diversifies its most referenced documents with, most notably, Rosen's ‘Hedonic Prices and Implicit Markets: Product Differentiation in Pure Competition’ (1974) and Heckman's ‘Sample Selection Bias as a Specification Error’ (1979). After the mid 1980s, its keywords attests of a concentration on labor markets issues – it is the period when persistently high unemployment in Europe becomes a key policy issue. During the same period, the reorientation toward micro-econometric methods which was already noticeable with the popularity of Heckman (1979) confirms itself. Maddala’s Limited-Dependent and Qualitative Variables in
Econometrics (1983) is by far the most referenced document up to window
1996-2000. It then alternatively shares the honor with Greene's Econometric Analysis (1993, first edition) and Heckman (1979). Starting in window 2003–7, these documents yield to a new generation of econometric texts: Wooldridge’s Econometric
Analysis of Cross Section and Panel Data (2002), Arellano and Bond’s ‘Some Tests of
Specification for Panel Data: Monte Carlo Evidence and an Application to Employment Equations’ (1991) and Blundell and Bond’s ‘Initial conditions and moment restrictions in dynamic panel data models’ (1998). The intensity of references to these three documents has been extreme in recent years as can been seen from Table 3: the three documents monopolize the top 10 of the most intensively referenced documents in a given year over our full corpus (i.e., without restricting to only this specialty). Concurrently to this dominance of new econometrics methods for (mainly) panel data, we notice a diversification of the specialty's keywords: ‘wage’
remains, but ‘school’ comes back and ‘health’ appears.15 Quite significantly, the keyword ‘evidence’ also emerges in the last three time windows. In short, we can confidently assert that this specialty is, toward the end of our period, a set of research on a diversity of topics that is united by specific econometric methods.
8. We are left with three successions of specialties that span less than half of our period. The succession on the left of row 7 in Figure 4 subsists for a total of 25 time windows. Its keywords indicate its focus on linear programming and, indeed, it refers most often to Linear Programming and Economic Analysis (Dorfman, Samuelson, and Solow 1958) up to the late 1960. Afterwards, Samuelson's Foundations of Economic
Analysis (1947) and Hicks's Value and Capital (1939, first edition) become its most
referenced documents and its keywords slightly diversify to include ‘price’, ‘consumption’, ‘welfare’, ‘production’. One might label it ‘post-war economic theory’, as it seems to be work related to the core of economic theory prior to the generalization of game theory. It dies after window 1981-1985 and no general, primarily theoretical specialty occurs again. This disappearance and the rising importance of econometric documents in the identity of many specialties as we approach closer to present support Backhouse and Cherrier's conjecture that “the discipline became more applied, applied work being accorded a higher status in relation to pure theory than was previously the case.”
9. In row 8 of Figure 4, we find a specialty active from the earliest time window to the mid 1970s and having keywords such as ‘growth’ and ‘production’. This specialty is clearly the ‘old’ growth theory. As one would expect, it refers most often to Arrow et al.’s article ‘Capital-Labor Substitution and Economic Efficiency’ (1961) and to Solow’s ‘Technical Change and the Aggregate Production Function’ (1957). It disappears in the mid 1970s and, as described above, the ‘new’ (endogenous) growth theory appears in the late 1980s in the succession associated with economic development (row 2 of Figure 4). This pattern supports an existing narrative that sees the 1970s and early 1980s as a period during which growth was a less prevalent research topic in economics (Boianovsky and Hoover 2009, p. 3).
10. Finally, a small specialty with no clear succession is born in time window 2000-2004 (Figure 4, row 7). It gradually grows in relative size to reach 12 % of the discipline at the end of the period. Its keywords clearly indicate its main topic: ‘energies’, ‘sustainable’, ‘carbon’, ‘climate’. But, the documents to which it refers the most are not on the topic of climate change. Again, they are documents contributing to specific econometric methods: Train's Discrete Choice Methods with Simulation (2003), McFadden's chapter ‘Conditional Logit Analysis of Qualitative Choice
15 In their study of the evolution of the relative frequencies of JEL codes, Kelly and Bruestle (2010, table 3) shows indeed that the subcategories of ‘Health’ (I10-19) and ‘Education’ (I20-29) have been among the fastest growing of the discipline since the 1990s.
Behavior’ (1973) and Louviere et al.'s Stated Choice Methods: Analysis and
Applications (2000).16
5.2. General Properties of the Specialty Structure
So far, we have discussed specialties in turn and not the overall specialty structure of the discipline. When it comes to this structure, we have to be much careful in our interpretation of the brute results. As we noted at the end of our data section (section 4), many things are changing through time: number of documents per window, average number of references per document, skewness of the distribution of citations, reliability of the identification of the references. When some aggregate property of the specialty structure shows a clear trend through time, it is often not possible to reliably discard the hypothesis – given the current state of dynamic community detection – that this trend is simply an artifact of some of the changing characteristics of the data just mentioned. Withholding belief seems especially warranted regarding the two aggregate properties that might at first catch the eye: the number and stability of clusters.
Number of clusters. The drop in the number of clusters is immediately evident
from the comparison of the two networks in Figure 5a and 5b. Figure 5a depicts a network of 19 clusters in window 1956-1960 while this number has dropped to 8 in the last time window (figure 5b). Figure 6a presents the number of detected clusters per window over the whole period. For our main specification (black line), the number of clusters slowly declines from the late 1950s to the early 1980s to then stabilize to 8 or 9 clusters.17 What should we make of this result? One could conclude
16 The historical study of climate-change economics is in its infancy. The pattern described in Huet 2015 concords with the one found here.
17 This result excludes communities that account for less than 1% of the discipline. The grey line in Figure 6a depicts the number of clusters if the only constraint on size is that a community must count at least 10 documents to be registered as a cluster. With this constraint, a similar downward trend in the number of clusters is visible, but more pronounced short-term variations occur since the 1980s. The burst in the number of clusters below 1 % since window 2005-2010 is noteworthy. Are we thus missing something important by restricting ourselves to clusters above 1 % of the discipline? We think not. The majority of these small clusters since 2005-2010 do not even include 50 documents. The largest, with an average of 455 documents per window and surviving 6 windows, is fully concentrated in one journal – Actual Problems of Economics – and its article with the most impact has only 5 citations. The second largest cluster, with an average of 186 documents over its 2 window-long life, has more than 80 % of its documents in two journals – Custos e Agronegocio and Journal of Home Economics
Research – and its highest impact article receives 10 citations. In contrast, the smallest cluster above
the 1 % threshold lives 16 windows, has an average of 1660 documents per window from window 2005-2010 to the end of the period, and contains 50 documents that receive more than 100 citations (it is the cluster at the bottom right of Figure 4 in row 1, having keywords “Production, Frontier, Efficiency, Technical”). The contrast is stark enough to justify using the 1 % threshold to discriminate
that economics research is structured around fewer divisions today. Unfortunately, this conclusion is premature. The main reason is that the technical literature on modularity optimization – a method to which our detection algorithm belongs – finds that, as networks get larger, the method “may favor network partitions with groups of modules combined into larger communities” (Fortunato and Barthélemy 2007, p 41). In other words, economics might have as many or perhaps more ‘divisions’ than before, but the method could tend to more frequently lump together smaller groups into bigger specialties as the period unfolds (and the size of the network grows). There are two things to note here. First, it is unclear that this process is actually happening in our network. To ascertain it, we would need an independent and reliable access to the actual specialty structure – an access we do not have. Second, even if it is happening, it does not invalidate the story we have been telling about the successions of specialties. It simply highlights that there is probably an internal specialty structure to the large specialties that we identify toward the end of the period. In fact, we are quite confident that the two largest specialties since the late 1990s – the first historically linked to industrial economics and the other to labor economics (see Figure 4, rows 3 and 6) – have an internal structure that would be worth exploring in future research. As we noted previously in our discussion, these two specialties seem, in recent times, to include diverse bundles of articles that have nevertheless some methods in common. We could test the existence of internal structures by running our community detection algorithm on networks constituted by the documents in only one specialty.
Stability of clusters. The second aggregate property that strikes the eye is the
increasing stability of the specialty structure: the left side of Figure 4 mostly presents short-lived clusters while the right side mostly exhibits long-lived ones. Figure 6b presents a measure of instability, the number of clusters disappearing after each time window. The smoothed line for our main specification (black line) drops below 2 as early as window 1967-1971 to never return. In fact, the structure is so unstable in the earliest time windows that few of the detected clusters should be counted as authentic specialties. We urge the reader not to interpret this result as implying that there were barely no specialties in economics in the late 1950s. That our method fails to detect relatively stable clusters at some point does not imply that there is no specialty. Early in the period, articles had on average fewer references (see Figure 3) and these references were poorly indexed in comparison to later. Grappling with this limited information, it is plausible that our algorithm fails to find stable patterns although economics was already cognitively specialized. On this background of limited information, the fact that the method finds some specialties seems more significant than the possibility that it misses some others. Specialties focused on
between clearly relevant and little relevant clusters in our macro history of specialties in economics. We thank an anonymous referee for inciting us to be clearer on the justification for our 1 % threshold.
econometrics (Figure 6, row 1), on economic development (row 2) and growth (row 8) have a stable identity as early as the first time window (1956-1960). This early stability indicates the extent to which these specialties were cognitively distinct. As the information contained in the references become better, our method is able to detect as soon as the mid 1960s all the successions of specialties that will remain until the end of the period – except the one focused on climate change, which clearly did not exist then.
Cluster disconnection. Another aggregate property of the specialty structure that
can be tracked through time is the strength of the connections between clusters, as depicted in Figure 6c. Since this property has no clear trend, we submit that, unlike the two previous properties, it can be interpreted at face value. There have been episodes when clusters where more connected to each other (i.e., lower values of disconnection in Figure 6c), which means that the boundaries between specialties were thinner. Such episodes occurred at the beginning of the period and then in the mid 1980s. In the mid 1980s, the two specialties having by far the most intense connections between them and to the rest of the network18 are the econometrics-centered specialty (Figure 4, bottom of row 1) and the macro/money specialty (Figure 4, row 5). This situation might be interpreted as the first signs of the deep changes of the specialty structure based on distinctions among econometric methods. In the econometrics-centered specialty, the mid 1980s corresponds to the rise of White's (1980) article on heteroskedasticity, which will reach the top 3 in the citation ranking of all time in economics. In the other central specialty, the mid 1980s corresponds to the shift away from Keynes (1936) as a core reference and toward Engle and Granger's CVAR approach – Engle and Granger (1987) also being in the all-time top 3 of the discipline. As can be seen from Figure 6c, the last episode of low disconnection between clusters – in fact, the episode when cluster disconnection reaches its lowest value – coincides with the end of our period, in window 2010-2014. At that point, the specialty that came to focus on CVAR is alone in the category of most central community. Unfortunately, our method is not meant for forecasts. We cannot tell whether this episode is an indication that fundamental restructuring is underway.
Cognitive specialties and individual researchers. The nodes of our dynamic
network are documents. The specialties that we detect are cognitive clusters of documents changing with time. In Section 1, we have distinguished this understanding of specialty from a more organizational understanding where individual researchers would be the nodes. Because a researcher can contribute to more than one cognitive specialty, the structure of the two types of network will not
18 The strength of the connection between two clusters is simply their weighted edge. The overall centrality of a cluster is given by eigenvector centrality (Bonacich, 1987; Newman 2010, pp. 169-172).
be identical. But how much different is the cognitive structure of economics from its organizational structure? Since our data include all authors, we can assess how much authors straddle cognitive specialties.19
Perhaps surprisingly, if we take at random from a time window two documents with at least one shared author, the probability that these two documents are in the same cluster surpasses 0.5 in only a few time windows (from 2001-2005 to 2004-2008). Figure 6d depicts the evolution of this probability. An interesting point of comparison is to take the discipline of physics. We did the same exercise with physics in window 1966-1970: the probability that two documents sharing at least one author are in the same cluster is .63, a probability much higher than anything found for economics. The comparison is especially relevant because physics in window 1966-1970 has a number of authors (89,000) similar to economics toward the end of the period (e.g., 90,500 authors in window 2009-2013), but physics is divided into many more clusters (14 versus 8 or 9 in economics). With many more clusters, one would expect that authors would be more likely to straddle clusters. Since our results suggest the opposite, we can confidently conclude that economists are less cognitively specialized in their discipline than physicists of the late 1960s – i.e., they tend to contribute to more cognitive specialties in their discipline.
The probability that two documents are in the same cluster given that they share at least one author provides only a partial understanding of the relationship between authorship and cognitive specialties. Another question is: how much more likely is it that two documents are in the same cluster given that they share at least one author instead of sharing none? The curve in figure 6e tracks this ratio through time. It is at its highest values in the earliest windows; having at least one shared author back then makes it roughly 4.5 times more likely for two documents to be in the same cluster. Since the number of clusters is extremely high (around 18) in these early windows, it is a lot less likely for two documents to be in the same cluster by chance. This component of luck explains the discrepancy between the tendency of this odds to drop with time and the growing probability of being in the same cluster given an author overlap (the numerator in the odds, which is shown in Figure 6d). At the end of our period, having an overlap in authors makes it roughly 3 times more likely for two documents to be in the same cluster. The comparison with physics in time window 1966-1970 is again instructive: author overlap makes the sharing of a cluster 6.1 times more likely in this discipline.
19 The results used in the following discussion have not been checked for homonyms – two authors having the same name. Our results might thus be slightly biased, but this bias is most probably not big enough to confound our qualitative results.
Finally, instead of looking at how much authors straddle clusters, we can focus on the direct measure of the cognitive similarity between two documents used by our detection algorithm. This is the cosine measure of bibliographic coupling. Figure 6f tracks the ratio of the mean cosine measure between documents sharing at least one author to the mean cosine measure between documents sharing no author at all. A value of 100 would mean that the mean cosine measure for documents with overlapping authors is a hundred times the mean cosine measure for documents with no shared author. For economics over our period, this value has been steadily growing from 105 to 1200. This increase through time is mostly attributable to a sharply dropping denominator since the numerator (the mean cosine measure of documents with overlapping authors) followed a bell-shaped curve. Again as a point of comparison, in physics the mean cosine measure of documents sharing at least one author is 5675 times higher than the mean cosine measure of documents sharing no author at all, a tall order higher than in economics.
In sum, this analysis of the distinction between the structure of cognitive specialties and an organizational structure of researchers shows that a simple connection between the two structures does not exist. As one would expect, common authorship is one determinant of the similarity of references (figure 6f) and, correlatively, of joint membership in a cluster (Figure 6e). Yet, common authorship in economics could be a stronger predictor of these two properties, as is exemplified by the contrast with physics.
6. Conclusion
This study has provided a map of the macrodynamics of specialties in economics since the late 1950s. After defining a corpus of roughly 415,000 economics documents in the Web of Science, our procedure carved out specialties in an automated fashion by using bibliographic coupling, algorithmic community detection and text mining. In attempting to understand the global cognitive structure of a discipline as large as economics, this procedure has clear advantages over a method relying mainly on insider knowledge of a discipline.
Our procedure delineates recognizable specialties that exhibit non-trivial dynamics. Grouping specialties together when they are connected by mergers or splits, we arrive at 10 successions of specialties(see Table 1). Seven of them live for most of the period. The identities of those specialties change quite significantly over time but they originate in well-known fields of economics: econometric methods, financial economics, economic development and international trade, industrial organization, public finance, macro and monetary economics, labor economics. Among the three successions of specialties that exist for less than half of the period since the late 1950s, two live in the early time windows – one focuses on what might be called ‘general, post-war economic theory’ and the other focuses on growth (in the