UNIVERSITÉ DU QUÉBEC À MONTRÉAL
TWO STYLES OF STRUCTURAL HYDROTHERMALISM IN ARCHEAN SHEAR ZONES, THE CASE OF THE PORCUPINE-DESTOR SHEAR ZONE, ABITIBI,
CANADA
MÉMOIRE PRÉSENTÉ
COMME EXIGENCE PARTIELLE DE LA MAÎTRISE EN SCIENCES DE LA TERRE
PAR
RAPHAËL DOUTRE
Service des bibliothèques .
Avertissement
La diffusion de ce mémoire se fait dans le' respect des droits de son auteur, qui a signé le formulaire Autorisation de reproduire et de diffuser un travail de recherche de cycles
supérieurs (SDU-522 - Rév.01-2006). Cette autorisation stipule que «conformément
à
l'article 11 du Règlement no 8 des études de cycles supérieurs, [l'auteur] concède
à
l'Université du Québecà
Montréal une licence non exclusive d'utilisation et de publication qe la totalité ou d'une partie importante de [son] travail de recherche pour des fins pédagogiques et non commerciales. Plus précisément, [l'auteur] autorise l'Université du Québecà
Montréalà
reproduire, diffuser, prêter, distribuer ou vendre des copies de [son] travail de rechercheà
des fins non commerciales sur quelque support que ce soit, y compris l'Internet. Cette licence et cette autorisation n'entraînent pas une renonciation de [la] part [de l'auteur]à
[ses] droits moraux nià
[ses] droits de propriété intellectuelle. Sauf entente contraire, [l'auteur] conserve la liberté de diffuser et de commercialiser ou non ce travail dont [il] possède un exemplaire.»UNIVERSITÉ DU QUÉBEC À MONTRÉAL
DEUX STYLES D'HYDROTHERMALISME STRUCTURAL DANS LES ZONES DE CISAILLEMENT ARCHÉENNES, LE CAS DE LA FAILLE PORCUPINE-DESTOR,
ABITIBI, CANADA
MÉMOIRE PRÉSENTÉ
COMME EXIGENCE PARTIELLE DE LA MAÎTRISE EN SCIENCES DE LA TERRE
PAR
RAPHAËL DOUTRE
Ce mémoire est rédigé sous la forme d'un article qui sera soumis à la revue Journal of Structural Geology (Elsevier). Sa présentation est donc différente de celle des mémoires habituellement présentés à l'UQAM. Notamment, la langue de rédaction est l'anglais et les figures et tableaux sont situés à la fin de l'article. Moi-même et Michel Jébrak sommes auteurs de cet article. Ce format de mémoire a été choisi car il donne l'opportunité de transmettre de nouvelles connaissances à la communauté scientifique à l'échelle internationale.
REMERCIEMENTS
Mes premiers remerciements vont à Michel Jébrak, mon directeur de maîtrise. Son support, ses capacités d'innovation, et son enthousiasme permanent ont permis la création et l'aboutissement du projet.
La compagnie Ressources Cartier Inc., ainsi que le CRSNG sont remerciés pour avoir financé ce projet. Les membres de Ressources Cartier lnc., plus particulièrement Philippe Berthelot, Philippe Cloutier, Ronan Deroff, Guillaume Estrade et Christelle Marrot, sont grandement remerciés pour leur appui sur le terrain et leurs discussions. Alain Tremblay est remercié pour son aide fournie lors de sa visite sur le terrain. Merci à Silvain Rafini, dont les conseils sur l'utilisation du logiciel UDEC ont été très utiles. Stéphane Faure et Pierre Pilote sont remerciés pour leurs discussions sur la géologie le long de la faille Porcupine-Destor.
Merci à la famille, à Amélie, et ainsi qu'aux amis de Montréal, Erwann, Ludo, Andrea, Christian, Jérémie, Yona, Baptiste, et Guillaume.
TABLE DES MATIÈRES
AVANT-PROPOS .. 111
LISTE DES FIGURES ._ .. ... v
LISTE DES TABLEAUX . VI
RÉSUMÉ
....
.
..
VIIINTRODUCTION GÉNÉRALE .. _
TWO STYLES OF STRUCTURAL HYDROTHERMALISM IN ARCHEAN SHEAR ZONES, THE CASE OF THE PORCUPINE-DESTOR SHEAR ZONE, ABITIBI,
CANADA .. 4
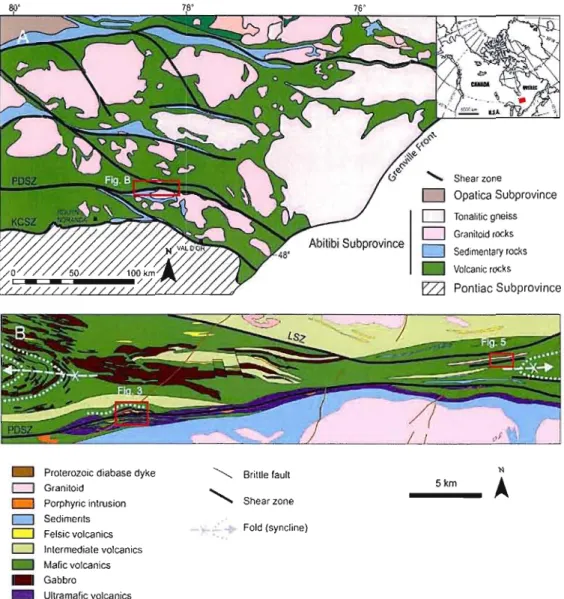
Figure 1. Simplified geology of the Southeastem Abitibi greenstone belt 38 Figure 2. Methods to measure the geometric features ofveins 39
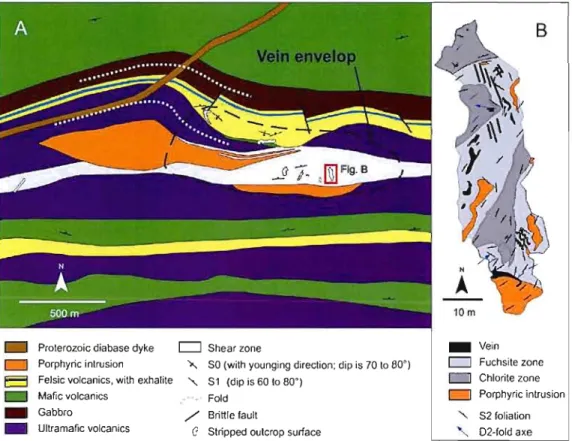
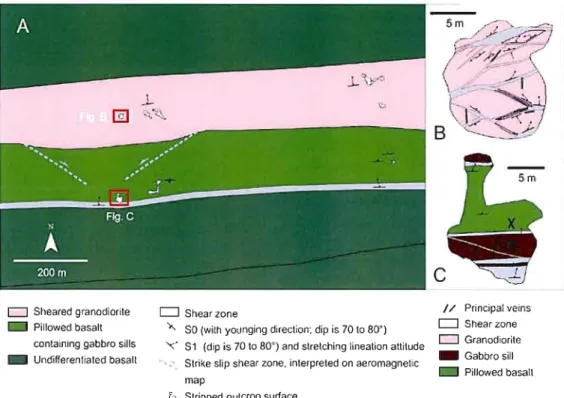
Figure 3. Geology of the MacCormack area 40
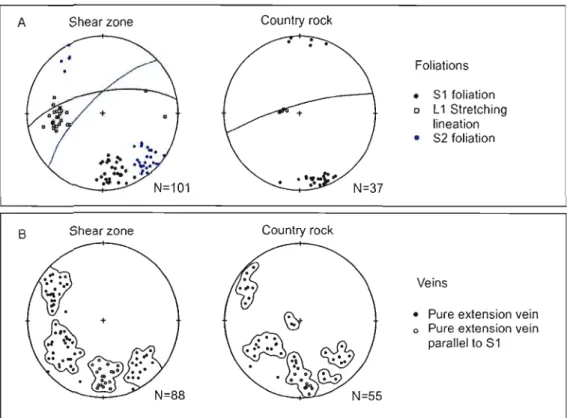
Figure 4. Orientation of foliations and veins in the MacCormack area 41
Figure 5. Geology of the Rambull area 42
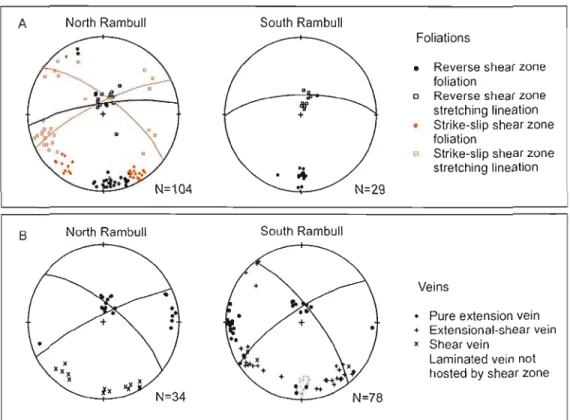
Figure 6. Orientation of foliations and veins in the Rambull area 43
Figure 7. Photographs of structures 44
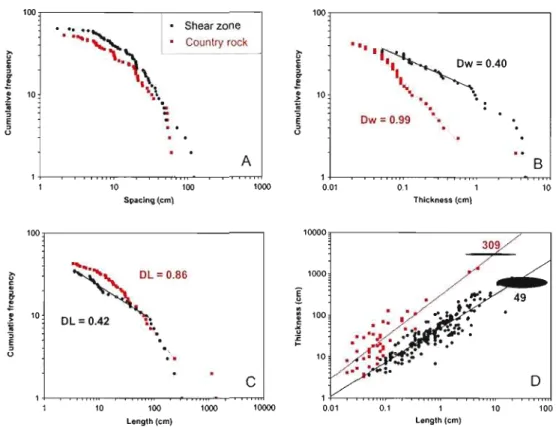
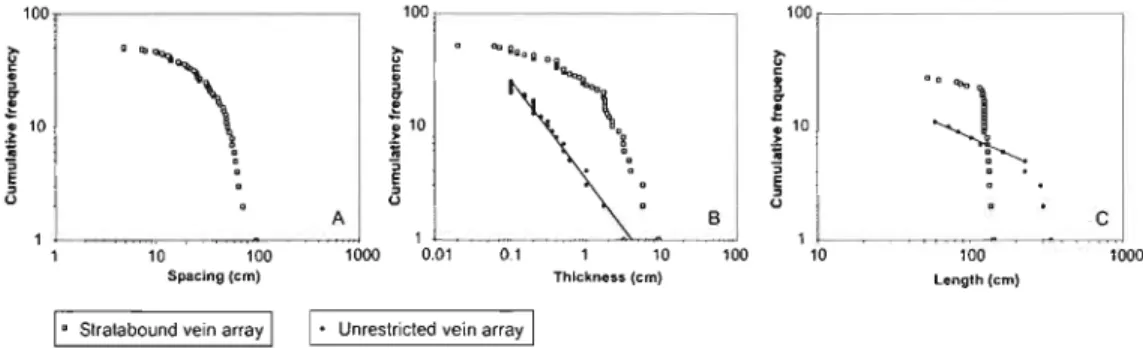
Figure 8. Statistic distributions of vein geometric parameters at MacCormack .46 Figure 9. Statistic distributions ofvein geometric parameters at South Rambull 47
Figure 10. Vein textures 48
Figure Il. Udec modeling in the MacCormack rock sequence 49
Figure 12. Two veining mechanisms along the Archean Porcupine-Destor shear zone 50 Figure 13. Schematic illustration ofevolution offluid pressure and minimum compressive
LISTE DES TABLEAUX
Table 1. Statistics ofvein geometric features 52
Les veines sont parmi les structures les plus communes et les mieux développées le long des zones de cisaillement. Dans la ceinture de roches vertes de l'Abitibi (Canada), des systèmes de veines bien exposés le long de la zone de cisaillement Porcupine-Destor permettent d'étudier les conditions de contraintes dans lesquelles les veines se sont mises en place. Les systèmes de veines ont pu être caractérisés en examinant la texture, la géométrie, la distribution, l'espacement, l'épaisseur, et la longueur des veines, ce qui a permis de déterminer la surpression de fluide. La surpression de fluide moyenne pour l'un des systèmes de veines est estimée à 42 MPa, ce qui correspond à une profondeur de mise en place de 2.7 km. Ces estimations ont permis de modéliser l'état des contraintes lors de la phase de compression régionale. Les contrastes de compétence génèrent de fortes perturbations des contraintes le long de la zone de cisaillement. Dans la séquence de roches, la zone de cisaillement Porcupine-Destor agit comme une unité lithologique de faible compétence et génère une zone de faibles contraintes très favorable à la formation de veines. Vingt-cinq kilomètres plus à l'est, les veines se sont mises en place dans un contexte de faille-valve à fonctionnement cyclique; ceci indique que les veines résultent de la perturbation temporaire de l'état de contraintes lors de ruptures sismiques. Ces deux mécanismes de perturbation de la contrainte sont favorables à la formation de veines le long des zones de cisaillement.
INTRODUCTION GÉNÉRALE
Les systèmes de veines aurifères, formant les gisements d'or filoniens orogéniques, sont très bien développées le long des zones de cisaillement majeures (Robert and Poulsen, 2001; Groves et al., 2003). Cependant, des systèmes de veines stériles sont souvent observés. Pourquoi un système de veines est-il aurifère ou stérile? À l'intérieur de la croûte, proche de la transition fragile-ductile, là où la plupart des gisements d'or filoniens orogéniques se forment, la perméabilité structurale est essentielle pour concentrer les fluides aurifères (Sibson, 1996, 2004; Cox, 2005; Phillips and Powell, 2009). Ces fluides sont susceptibles d'avoir migré sur de longues distances à travers d'importants volumes de roches, ce qui a pu permettre l'enrichissement en métaux (Cox, 2005). Lorsque des zones de cisaillement actives sont connectées au réservoir de fluides, le comportement de faille-valve permet le pompage des fluides (Oliver, 2001; Sibson et al., 1988). Ce mécanisme de concentration des fluides est essentiel pour la formation des gisements d'or filonien (Sibson, 2004). Les zones où les structures sont fortement connectées et densément développées sont des sites de perméabilité maximale où les fluides vont se concentrer pour former des gisements d'or (Cox, 2005; Cox et al., 2001; Kenworthy and Hagemann, 2007).
La formation des veines dépend essentiellement de l'interaction entre la pression de fluide et la contrainte tectonique dans un régime cassant (Cox, 2005). Dans une séquence de roches subissant une déformation, les veines sont susceptibles de se former dans les zones où la contrainte est hétérogène. Ces zones se développent le long de zones de failles ou de cisaillements actives, dans les plis, et dans les secteurs à forts contrastes de compétence. D'une part, les zones de failles ou cisaillements actives permettent une modification de la contrainte par l'intermédiaire du comportement de faille-valve. D'autre part, les roches très déformées des zones de failles et cisaillements représentent de forts contrastes de compétence qui vont modifier l'état de contrainte local dans la séquence de roches (Gudmundsson et al., 2009). Ces deux pôles de mécanismes de perturbation de la contrainte sont favorables pour former des veines le long d'une zone de cisaillement.
Cet article traite de l'analyse structurale de deux systèmes de veines développés le long d'une zone de cisaillement majeure archéenne. Une étude structurale détaillée a été
menée sur des surfaces de décapages. Les données de forages et la carte aéromagnétique ont permis de réaliser des cartes géologiques. Les systèmes de veines sont exposés dans deux secteurs distants de 25 km. Tout d'abord, la géologie du secteur MacCormack est présentée. Dans ce secteur, les veines sont stériles et sont développées dans une enveloppe d'environ 500x 1000 m qui recoupe la zone de cisaillement majeure. Ensuite, la géologie du secteur Rambull est dévoilée. Ce secteur est caractérisé par des veines aurifères qui sont contemporaines à des cisaillements subsidiaires. Puis, ces deux contextes sont comparés et les implications sur l'état des contraintes sont examinées. Dans le secteur MacCormack, une modélisation numérique de l'état des contraintes suggère que les contrastes de compétences sont susceptibles de générer des systèmes de veines stériles le long des zones de cisaillement majeures. Ceci suggère que le comportement de faille-valve est critique pour la formation de filons aurifères orogéniques. Ce modèle a des implications sur la genèse des gisements d'or filoniens et a donc un intérêt pour l'exploration minérale.
Référence
Cox, S.F., 2005. Coupling between deformation, fluid pressures and fluid flow in oreproducing hydrothermal systems at depth in the crust. In: Economie Geology 100th Anniversary Volume, pp. 1-35.
Cox, S.F., Knackstedt, M.A., Braun, J., 2001. Principles of structural control on permeability and fluid flow in hydrothennal systems. Society of Economie Geologists Reviews 14, pp.
1-24.
Groves, D.L, Goldfarb, RJ., Robert, F., CJ.R Hart, 2003. Gold deposits in metamorphic belts: overview of current understanding, outstanding problems, future research, and exploration significance. Economie Geology 98, 1-29.
Gudmundsson, A., Simmenes, T.H., Larsen, B., Philipp, S.L., 2010. Effects of internai structure and local stresses on fracture propagation, deflection, and arrest in fault zones. Journal of Structural Geology 32,1643-1655.
Kenworthy, S., Hagemann, S.G., 2007. Fault and vein relationships in a reverse fault system at the Centenary orebody (Darlot gold deposit), Western Australia: Implications for gold mineralisation. Journal of Structural Geology 29,712-735.
Oliver, N.H.S., 2001. Linking of regional and hydrothennal systems in the mid-crust by shearing and faulting. Tectonophysics 335, 147-161.
3
Phillips, G.N., Powell, R., 2009. Formation ofgold deposits: Review and evaluation of the continuum mode!. Earth-Science Reviews 94, 1-21.
Robert, F., Poulsen, K.H., 2001. Vein fonnation and deformation in greenstone gold deposits. Society ofEconomic Geologists Reviews 14, pp. 111-155.
Sibson, R.H., 1996. Structural penneability of fluid-driven fault-fracture meshes. Journal of Structural Geology 18, 1031-1042.
Sibson, R.H., 2004. Controls on maximum fluid overpressure defining conditions for mesozonal mineralisation. Journal of Structural Geology 26, 1127-1136.
Sibson, R.H., Robert, F.K., Poulsen, K.H., 1988. High-angle reverse faults, fluid pressure cycling, and mesothennal gold-quartz deposits. Geology 16,551-555.
ZONES, THE CASE OF THE PORCUPINE-DESTOR SHEAR ZONE, ABITIBI, CANADA
Raphaël Doutre " Michel Jébrak
Département des Sciences de la Terre et de l'Atmosphère - Université du Québec à Montréal (uQAM), c.P. 8888 Succursale Centre-ville, Montréal, Québec, Canada H3C 3P8
*
Corresponding author. Tel.: +1 (514) 602-7944.5
Abstract
Veins are one of the most common structural features along shear zones. ln the Abitibi greenstone belt (Canada), well-exposed vein systems along the Porcupine-Destor shear zone provide insight into the role of stress state at the time of vein formation. The vein systems were characterised by analysing the texture, geometry, distribution, spacing, thickness and length of veins and the magnitude of the driving stress was determined. The average driving stress for one of the vein systems is 42 MPa, and the corresponding depth of vein formation is estimated at 2.7 km. These values allowed performing numerical modeling of the stress during regional shortening. Competency contrasts generate strong stress perturbations along the major shear zone. The Porcupine-Destor shear zone acts as an incompetent rock unit within the intact rock sequence, which Ieads to strong stress lowering in the shear zone. This 10w stress was highly favourable for vein formation. At 25 km away along the shear zone, veins formed during the fault-valve cycle indicating transient stress perturbation during earthquake rupturing along the shear zones. The model suggests that these two end-member mechanisms of stress perturbation may lead to vein formation along a shear zone.
1. Introduction
Gold-bearing veins forming orogenie Iode gold deposits are extensively deveIoped along major Archean shear zones (Robert and PouIsen, 2001; Groves et aL, 2003). However barren vein systems are widespread and it remains unclear why a vein system is mineralised or not. At depth in the crust, near the brittIe-ductile transition where most of the orogenie Iode goId deposits form, structural permeability plays a critical role in focusing gold-bearing fluids (Sibson, 1996, 2004; Cox, 2005; Phillips and Powell, 2009). Such fluids are Iikely to have circulated on long distances through large volume of rocks, allowing metal enrichment (Cox, 2005). Networks of active shear zones, where connected to a fluid reservoir, promote fluid drainage through fault-valving behaviour (Oliver, 2001; Sibson et aL, 1988). Such mechanism is essential for fluid concentration and formation of gold-bearing vein systems (Sibson, 2004). Areas where structures have high connectivity and density represent sites of greatest permeability where fluids migrate to form gold deposits (Cox, 2005; Cox et aL, 2001; Kenworthy and Hagemann, 2007).
Vein formation largely results from interplay between fluid pressure and tectonic stress in brittle deformation conditions (Cox, 2005). In a deforming rock sequence, veins are expected to form in zones of heterogeneous stress which largely develop along active faults, shear zones, and folds, and in areas of competency contrasts. On one hand, active faults and shear zones promote modification of the stress state through fault-valving behaviour. On the other hand, strained rocks in fault and shear zones may represent high competency contrasts that modify the local stress state in the rock sequence (Gudmundsson et aL, 2010). These two end-member mechanisms for stress perturbation may both lead to vein formation along a shear zone.
This paper reports on structural analysis of two distinct vein systems present along a major Archean shear zone. Stripped outcrop surfaces allowed detailed study on the field and boreholes and aeromagnetic map were used to trace solid geological maps. Vein systems occur in two areas separated by 25 km. First, we describe the MacCormack area, where veins are barren and occur within a ~SOOx 1000 m envelope which cuts the major shear zone. Second, we analyse the Rambull area where gold-bearing veins emplacement is synchronous with shearing and faulting along low order shear zones. These two case studies are compared
7
and stress conditions for vein formation are examined. Numerical modeling of the stress in the MacCormack area suggests that competency contrast is important for formation of barren vein systems along major shear zones. This suggests fault-valve behaviour is critical for the formation of orogenic Iode gold deposits. This model has direct implications for distinguishing barren from mineralised vein systems, and is therefore of interest to genesis of orogenie Iode gold deposits and minerai exploration.2. Regional geology
The Abitibi belt is the largest greenstone belt in the world, extending 400 km E-W by 250 km N-S. This region is one of the most prolifie gold and base metal producer in the world and hosts several major mining camps. It is located in the southeastern portion of the Superior Province, Canada. This belt is similar to many other greenstone belts from the Superior Province and the Yilgarn craton of Western Australia (Robert et al., 2005).
The Abitibi belt is bordered by Archean rocks from the Pontiac Subprovince to the south and from the Opatica belt to the north. The belt is truncated by two major Proterozoic structures on its western and eastern limits, the former being the Kapuskasing structure, a major thrust, and the later the Grenville orogenic front (Figure la).
2.1. Abitibi beU stratigraphy and deformation
Two major models exist for the formation of the Abitibi green stone belt. The first model suggests the belt is composed of allochtonous terranes that accreted during collisional tectonics, comparably to modern orogenic belts (Dimroth et al., 1983; Kerrich and Feng, 1992; Mueller et al., 1996). The second mode! proposes that the belt developed as a large autochthonous terrane. It suggests the stratigraphy throughout the belt is upward-facing, upward younging, and is folded on a regional scale (Peschler et al., 2006; Thurston et al., 2008).
The belt is composed of metavolcanic, granitic, and metasedimentary rocks (Figure la). The stratigraphy is largely represented by volcanic rocks, which deposited continuously over a period of ca. 55 Ma, between 2750 and 2695 Ma (MueHer et al., 1996; Ayer et al., 2002; Goutier and Melançon, 2007; Thurston et al., 2008). The period of volcanism was followed by siliclastic sedimentation during about 20 Ma, which emplaced in successor basins uncomformably overlying the volcanic rocks. Plutonism in the belt spans the same age range as volcanism and sedimentation, but continued until about 2640 Ma.
Regional metamorphic grade affecting the rocks is subgreenschist to greenschist, and took place at ca. 2660 Ma (Powell et al., 1995). Amphibolite metamorphic grade is also locally present as contact aureoles around plutons. Maximum burial during peak metamorphism corresponded to about 10 km depth (~200 MPa; Powell et aL, 1995).
The Abitibi belt has undergone a regionaJ N-S shortening that began at ca. 2700 Ma and lasted at ca. 2660-2650 Ma (Peschler et aL, 2006). The principal resulting structures are regional-scale E-W trending folds and shear zones. Folds have half-wavelenght of 10-40 km and affect the upper and middle crust (Benn and Peschler, 2005; Peschler et al., 2006). Folding is largely responsible for the actual geometry of the belt. Batholith diapirism, associated tilting of strata, and synclinal keels suggest that vertical tectonism played a major role in the regional deforrnation (Becker and Benn, 2003; Peschler et aL, 2006). The deformation of the whole belt could also have been the result of synchronous vertical and horizontal tectonism (Lin and Beakhouse, 2008).
Although the Abitibi greenstone belt contains numerous major shear zones (Figure 1a), two of them have particularly large dimensions with more than 350 km in length; they are the Porcupine-Destor and Kirkland-Cadillac shear zones. These two shear zones are by far the most studied in the Abitibi greenstone belt, because they have been the loci of major gold deposits (Robert et aL, 2005).
2.2. Shear zones
Interpretations of seismic and gravity data show that the Kirkland-Cadillac shear zone is a crustal-scale feature (Benn, 2006). Analyses on other major shear zones are
9
divergent and either suggest these structures are limited to the upper crust or they extend into the deep crust (Jackson and Sutcliffe, 1990; Benn, 2006; Bateman and Bierlein, 2007). There is no marker indicating offset on major shear zones; however numerous studies suggest offsets are not noticeable on a regional scale (Powell et al., 1995; Benn and Peschler, 2005; Peschler et al., 2006; Snyder et al., 2008; Thurston et al., 2008).
The Porcupine-Destor and Kirkland-Cadillac shear zones display numerous second and third-order shear zones. These lower order structures are hundreds to thousands ofmeters long and are the loci for orogenie gold deposits, whereas deposits rarely occur within the main structures (Robert et al., 1995; Bateman and Bierlein, 2007). The shear zones record ductile to brittle-ductile deformation. A few of these major structures, such as the Main Break at Kirkland Lake, which hosts major gold deposits, represent brittle faults that formed at shallower depth (Dubé and Gosselin, 2005).
Major shear zones movement depends on their orientation. East-west trending shear zones record vertical movement, whereas northwest- and northeast-trending shear zones indicate dextral and sinistral movements, respectively (Daigneault et aL, 2004, Fig. 2). Such various movements can occur along a single shear zone (Wilkinson et al., 1999). The regional structures and associated movements are very similar to those described in the Yilgarn craton of Western Australia (Chen et aL, 2004). Final stage of movement is marked by a progressive transition from reverse to dextral transcurrent regime on sorne east-west trending shear zones (Robert, 1989; Robert et al., 2005). The few available studies dealing with movements along the Porcupine-Destor shear zone indicate it experienced vertical movement in sorne areas and strike-slip movement in others (Mue11er et al., 1996; Daigneault et al., 2002; Benn et al., 2001; Benn and Peschler, 2005).
Regional shear zones represent zones where deformation and commonly metamorphism are more intense than within the background. In the most strongly foliated rocks, the primary mineralogy is entirely replaced by alteration minerais indicating voluminous fluid fluxes during regional metamorphism (Wilkinson et aL, 1999; Benn and Peschler, 2005).
Previous mode1s have interpreted the Porcupine-Destor and Kirkland-Cadillac shear zones to be basin-bounding fault zones that where reactivated during regional shortening or
major terrane sutures formed during orogenie collision (Dirnroth et al., 1983; Kerrich and Feng, 1992; Mueller et al., 1996). In accordance with an autochthonous development of the belt, more recent models suggest the shear zones formed on regional fold limbs during shortening of the belt (Peschler et al., 2006; Benn and Peschler, 2005).
3. Methodology
3.1. Vein measurements
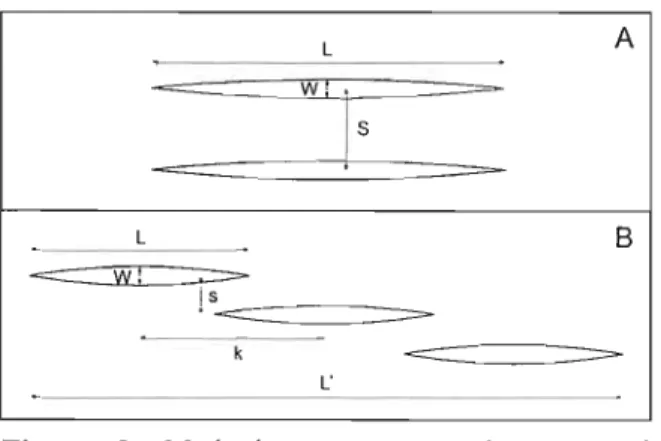
Veins were systematically measured along lines parallel to the vem opening direction, when obvious and marked by quartz fibres, or perpendicular to the veins in other cases. This sampling technique is used to typify the geometry of a vein array (Gillespie et al., 1999). The thickness (W), length (L) and spacing (S) of veins were measured (Figure 2a). Where veins were only partly exposed, the largest veins were likely to be undersampled, which causes a censoring effect in the analysis (Bonnet et al., 2001). Smaller veins which were not measurable with conventional field methods were also undersampled, which causes a truncation effect.
The coefficient of variation of vein spacing,
Cv,
is a measure of the clustering of veins along a line and is defined as:Cv = SD(S)/m (1)
where SD(S) is the standard deviation of vein spacing and m is the mean vein spacing. When
Cv = l, veins are randomly spaced; Cv> 1 indicates clustering or irregular spacing of veins and
Cv
< 1 indicates anti-clustering or regular spacing of veins (Gillespie et al., 1999).If veins are anti-clustered, the vein density is approximated homogeneous along a single line sample. Thus, the vein density in a line sample is:
d=N/i (2)
Il
As extension veins represent infill of open space due to extension during deforrnation, the total vein thickness (w) measured perpendicularly to veins along a line provides an estimate of the bulk extensional strain in a parallel vein array such as:
e = (w/l) 100 (3)
where e is the percentage of bulk extensional strain in the rock along the sampling line. Vein geometric features (thickness, length, spacing) can be analysed in terms of their cumulative frequency distribution. Vein thicknesses (W) are plotted versus their cumulative frequencies (N(?W» on diagrams with log-log axes. On such diagrams, a straight line indicates a power law distribution of the form (Loriga, 1999):
(4) where c is a constant and Dw is the scaling factor or fractal dimension. The power law
exponent -Dw is the slope of the line. This value varies according to the thickness
distribution of the veins in the population and is not affected by the number of measures. Higher values of D w, i.e. a steeper slope on the plot, mean that there are relatively more th in veins than thick veins (Loriga, 1999; GiIlespie et aL, 1999). Such analysis can be done for vein length or spacing. Censoring and truncation effects are likely to perturb the power law distribution on the plot for higher and Jower values, respectively, but do not modify the slope of the Jine.
The vein aspect ratio (L/W) is defined as the ratio between vein length and vein maximum thickness. It may be plotted on a diagram with 10g(L) vs. log(W) axis. On such plots, data Iying on a straight line may be described by a power law relationship of the form:
L =pW' (5)
where p is a constant and a is the power law exponent. The value ofp represents the average vein aspect ratio for the dataset; the value of a determines the change in aspect ratio with scale (Johnston and McCaffrey, 1996). For a = 1, vein aspect ratio is self-similar, i.e. it does
not change with scale. For a
f.
l, aspect ratio is self-affine, it varies with scale. Ideally, measured veins must meet the foIlowing criteria (Gudmundsson, 1999): (1) veins are mode 1 fractures with no shear displacement; (2) veins are non-restricted, i.e. they do not end byintersecting other veins or rock discontinuities; (3) vein length is defined as the linear distance from the ends of a continuous mineral-fi lied fracture.
Measuring the aspect ratio of veins (Figure 2) allows estimating the driving stress for isolated and echelon veins.
3.2. Driving stress calculation
For a pure extension vein, the driving stress (L1P) is the difference between the fluid pressure (Pr) within the fracture and the remote normal stress (<J)). Any positive driving stress
(Pr> <J)) produces sorne dilation. For an isolated vein (Figure 2a), the driving stress is given by:
L1P = (WIl) / (L(1- v)) (6)
where Il is the shear modulus of the rock and v is its Poisson's ratio (Pollard and Segall, 1987). Note that for a specifie rock L1P increases linearly with vein aspect ratio.
On the other hand, the driving stress for echelon veins (Figure 2b) is given by:
L1P = (WIl) / (kND (1-v)) (7)
where k is the center spacing measured parallel between two veins and ND is the normalized dilation (Nicholson and Pollard, 1985). The spacing between two veins is
s
and the total length of the echelon vein array is L' (Figure 2b). The ratios Llk and s/k are used to determine graphically the value of ND on Fig. 6 from Nicholson and Pollard (1985). The ratio Llk reflects the overlap ratio between two veins and for L/k > 1.0 veins overlap.Veins behave as isolated veins if Llk < 0.5 or s/k> La, and in this case Eq. (6) is applicable. Veins with s/k < 0.1 and Llk > 1.5 have a thickness approaching the thickness of an isolated vein of length L'.
In
other words, the aspect ratio W/L' is smaller but close to the aspect ratio of an isolated vein, and L1P value calculated using W/L' will approach the L1Pvalue for an isolated vein.
Gudmundsson (1983) calculates the depth of formation of dykes by utilizing the driving stress determined with dyke aspect ratio. The depth is given by:
13
z
= L1P/«(P, - Pm)g) (8)where P, is the fractured rock density, Pm is the magma density and
g
is the acceleration due to gravity. This equation has been used to estimate the depth of formation for hydrothermal veins (Vermilye and Scholz, 1995).3.3. Paleostress modeling
The UDEC (Universal Distinct Element Code) software is useful for modelling the stress state in a rock sequence where rocks show predominantly brittle behaviour (Holyland and Ojala, 1997; Oliver et al., 2001). The model is in two dimensions and is based on a solid geological map. It is divided into blocks of different rheologies which represent the 1ithological units. Limits between blocks represent contacts. Parameters are assigned both to blocks and contacts. Stress is applied to the boundaries of the model to simulate a regional compression, which results in modification of the stress state into the rock sequence. The aim is to test if rock competency contrasts and/or contacts have an influence on the distribution of the stress in the deforming rock sequence. The reader is referred to Oliver et al. (2001 and references therein) for further explanation on the principles ofUDEC and its application.
4. MacCormack area
4.1. Geology
The stratigraphie sequence is an E-W trending overturned volcanic pile, steeply dipping to the north (Figure 3a). The rocks are dated at 2718 to 2716 Ma and are equivalent to rocks from the Kidd-Munro group in Ontario (Pilote et al., 2008). The Porcupine-Destor shear zone developed in ultramafic and mafic volcanics paralle1 to the bedding. The shear zone thickness is up to 200 m.
It
is composed of a locally anastomosing core zone and do not exhibit subsidiary structures. Foliation fabrics and veins are widespread. Oblique lineation and kinematic indicators suggest dextral-reverse movement (Figure 4a and 7b).Syntectonic calc-alkaline to alkaline porphyric granitoid intrusions are present along the shear zone (Figure 1band 3). This type of intrusion is common along the Porcupine Destor shear zone which controlled there emplacement on a regional scale between 2682 and 2672 Ma (Robert, 2001; Legault et al., 2006). At MacCormack, the main intrusion occurs in a fold hinge (Figure 3a).
The country rocks (this term designates the rocks in the immediate vicinity of the shear zone on Figure 3a) display preserved primary mineralogy and are not to weakly foliated (Figure 7c). Previous studies proposed a greenschist grade metamorphism for the area, although sub-greenschist metamorphism occurs a few km further north (Daigneault et al., 2004, Fig. 2d). Rocks from the shear zone are strongly foliated and the primary mineralogy is entirely replaced by chlorite-iron carbonate and fuchsite-iron carbonate assemblages (Figure 7a, b). Rock geochemistry suggests the former assemblage protolith was a basait and the later was an uitramafic rock. Hydrothermal aiterations also include gold-enriched more local albite, sericite and pyrite replacement zones which mainly emplaced during ductile deformation (Renou, 2009).
The regional foliation (S 1) is E-W trending and steeply dipping to the north (Figure 4a). 11 is subparallel to the stratigraphie sequence, except to the north-west where it is at high angle (Figure 3a).
Within the shear zone, stratigraphie contacts are obliterated and transposed parallel to the SI foliation (Figure 3b). Stretching lineation (LI) systematically plunges 30-40° W along the shear zone and ~70° W in the country rock (Figure 4a). A S2 foliation is developed only locally within the shear zone. This foliation is weakly penetrative. It is NE-trending, steeply dipping to the north and axial planar to F2 folds (Figure 3b and 4a). These folds are mostly Z shaped. Where present, the S2 foliation systematically folds, and thus postdates the intrusions emplacement. A few km away along the shear zone, the S2 foliation is rare.
The NE trending S2 foliation, associated Z-shaped folds of SI and the shallow plunge of the LI stretching lineation within the shear zone suggest the Porcupine-Destor shear zone is an oblique dextral transpression zone in the MacCormack area, such as described 30 km further west by Mueller et al. (1996). The shear zone developed during
15 regional subhorizontal N-S shortening and the D2 deformation phase is confined to this zone and its vicinity.
4.2. Vein system
For comparison, the veins emplaced within the shear zone are treated separately from those emplaced into the country rocks. Veins have three main orientations: E-W, NE-SW and NW-SE (Figure 4b). Dips are moderate to vertical, but subhorizontal veins locally occur in the country rock. Veins have very similar orientations in the shear zone and in the country rock, which suggests they emplaced during the same deformation event. The veins are pure extension veins, with the opening vector normal to the vein walls (Figure 7c). Veins are filled with quartz within the country rock (Figure 10a). A few veins also display iron carbonate and calcite. Within the shear zone, veins are filled with quartz and iron carbonate. Iron carbonate crystals are frequently idiomorphic and are a few mm to several tens of cm large within the largest veins. These crystals are attached to the vein walls or isolated within the xenomorphic quartz, showing they crystallized first. Veins hosted by the intrusions are filled with quartz, and locally with iron carbonate.
Within the shear zone, veins eut and postdate the rock alteration and the SI foliation (Figure 3b). They 10cally contain fragments of their altered hostrock. Veins have mutual crosscutting relationships and 10cally form meshes. Sorne veins are boudinaged. Folded veins are frequent within the shear zone and absent outside (Figure 3b and 7c, d). E-W trending veins are subparallel to the SI foliation and NE-SW trending veins are subparallel to the S2 foliation (compare Figure 4a and 4b). Locally, NE-SW trending veins fill the S2 foliation plane and branch to veins folded by S2.
The above description suggests all veins formed through the D2 deformation phase during NW-SE shortening. As veins are pure extension veins, their formation implies a switching in the orientation of the minimum compressive stress.
Most veins are arranged in parallel arrays where veins have a single orientation and are unconnected (Figure 7d). Vein arrays are a few to -25 m large. The largest arrays trend E-W and are subparallel to the SI foliation. Veins systematically show echelon or segmented
geometries and isolated veins are almost absent. Except for veins that exploit the foliation planes, ail the veins are newly fonned. Rocks locally display hydraulic breccia textures with jigsaw puzzle patterns. The two later observations suggest vein fonnation and propagation was the result of high fluid pressure relative to stress, as also indicated by the occurrence of broken bridges and euhedral crystals in the veins.
Veins show a strong lithological control within the shear zone: they are developed in strong fuchsite zones and intrusions and are absent in softer chlorite zones. The same relations occur further west along the shear zone (Legault et al, 2006). Veins are unrestricted, i.e. non stopped by a discontinuity, except in sorne cases where they are restricted by the boundaries of chlorite zones (Figure 3b). Within the less deformed country rock, veins are developed in massive rhyolite and basait and crosscut stratigraphic contacts mostly without showing perturbations. In ail the area, vein arrays may have emplaced and freely develop mostly without interacting with rock unit boundaries.
Several observations within the shear zone are relevant to estimate the origin of vein filling material. As previously described, veins postdate the rock alteration. Veins never show alteration halos in their hostrock. Sorne veins locally contain much more carbonate where their immediate hostrock shows greater carbonatation. Moreover, veins emplaced in the core of small intrusions embedded within the altered sheared rock contain only quartz, whereas a few m away veins hosted by fuchsite zones contain quartz and iron carbonate. Ali these observations, associated with the fact that veins are rarely interconnected, strongly suggest that vein forming fluid came from local in-situ remobilization postdating the rock alteration.
4.2.1. Vein statistics
The thickness, length and spacing of veins were systematically measured in the shear zone and in the country rock. The statistics are listed in Table 1. Within the shear zone, vein maximum thickness is 350 cm for veins parallel to the SI foliation and 19.9 cm for the other veins. Within the country rocks, vein maximum thickness is 4.7 cm within the rhyolite and 1.2 cm within the basait. Average bulk extensional strain is about five times higher within the shear zone than outside. Veins are much thicker within the shear zone, especially veins
17
parallel to SI. The SI foliation plane represents a strong anisotropy which may have favoured greater dilation during vein aperture.Veins are anti-clustered or regularly spaced in the MacCormack area, with average Cv values of 0.76 (±0.15) in the shear zone and 0.83 (±0.21) in the country rock. Average spacing, density and clustering of veins are about the same in the shear zone and in the country rock, showing spacing does not vary according to rock type (Table 1).
Cumulative frequency of vein spacing is plotted in Figure 8a. Data from the shear zone represent the spacing for two combined line sampies measured on a single vein array; data from outside the shear zone represent the spacing for four combined line samples measured on one outcrop on parallel vein arrays. Combining of the line samples did not modifY the general shape of the curves. Spacing shows approximately log-normal distributions which are identical within and outside the shear zone, as represented by parallel curves on Figure Sa which are not superposed because the number of measures is different for the two datasets. The only difference is the greater steepening of the curve at greater spacing for veins outside the shear zone; this may be caused by the presence of the same large spacing values in several proximal line samples or higher censoring effect (Gillespie et al., 1999; Bonnet et aL, 2001).
Cumulative frequency of vein thickness is plotted in Figure 8b for veins from the shear zone and the country rock rhyolite. Vein thicknesses show power law distributions with Dw
=
0.40 within the shear zone and Dw=
0,99 in the country rock. This high difference inDw means that veins are much thicker within the shear zone than outside, which is consistent
with field measurements (Table 1).
Cumulative frequency of vein Jength for the same veins is plotted in Figure Sc. Vein lengths show power law distributions with DL = 0.42 within the shear zone and DL = 0.86 in the country rock. This suggests that veins are longer within the shear zone than outside. For L
> 85 cm veins within the shear zone show a steepening with DL = 1.59; this is probably due to undersampling of longer veins (censoring effect; Bonnet et al., 2001).
The length and maximum thickness of veins were measured for 237 veins in the MacCormack area. Measures include 194 veins from the fuchsite zones within the shear zone and 43 veins from the country rock rhyolite. Veins from the shear zone give the relationship
L = 49W0 82
and veins from the rhyolite give L = 309W 101 (Figure 8d). Vein average aspect ratio (L/W) is 49 within the shear zone and 309 in the rhyolite. Veins are six times more dilated within the shear zone than in the country rock rhyolite. This result is consistent with the calculated bulk extensional strain and the cumulative frequency plot of vein thickness (Table 1; Figure 8b). The power law exponent value a = 1.01 for the rhyolite suggests that veins grew by thickening as much as by lengthening. On the other hand, the value of a = 0.82 suggests that veins grew more by thickening than lengthening within the shear zone (Johnston and McCaffrey, 1996).
Statistics of veins clearly indicate that vein arrangement is approximately identical within and outside the shear zone, but vein shape is different with thicker veins within the shear zone.
5. Rambull area 5.1. General geology
The rock sequence is an E-W trending overturned volcanic pile, steeply dipping to the north, such as at MacCormack. However, rock types and deformation are very different at Rambull (Figure Sa). This study area is located 3 km north from the Porcupine-Destor shear zone (Figure lb). The rocks are dated at 2719-2718 Ma and belong to the Deguisier Formation (Pilote, pers. comm., 2009). Rocks include metamorphosed pillowed and massive basait, gabbro and granodiorite. The granodiorite is Jocally cut by synvolcanic gabbro intrusions which have the same composition than basalts, indicating this pluton is synvolcanic and predate deformation. Systematic chlorite replacement in ail rocks indicates they undergone greenschlst grade metamorphism. Ali the rocks are affected by the regional foliation (S 1) which is largely defined by micaceous mineraIs. The foliation trends E-W and dip steeply to the north; it is subparallel to the stratigraphy (Figure Sa). The stretching lineation is down-dip. Pillowed basalts [rom the background show an aspect ratio of 1:2 to
I:S in plan view. A major throughgoing shear zone, the South Rambull shear zone, developed along the lithological contact separating two distinct basait units. The observed shear zone
19
thickness is 30 m and the total thickness is unknown. The systematic occurrence of steps on the foliation surface in ail shear zones indicates their ductile-brittle nature.
The basaIt and the granodiorite exhibit two very different deformation styles. As a consequence, the area has been subdivided in two distinct parts which are (1) the South Rambull area, represented by the basalts to the south of the granodiorite, and (2) the North Rambull area, represented by the granodiorite (Figure 5a).
5.2. Shear zones and veins at South Rambull
At South Rambull, basalts host synvolcanic gabbro sills (Figure 5c and 7h). Foliation is more penetrative within the basait than in the gabbro, suggesting the later was more competent. Shear zones are subparallel to the stratigraphy and are developed within the basait at gabbro layers boundaries. Basait pillows have an aspect ratio of about 1:40 at shear zone margins and are obliterated within the shear zones. No shear zones occur at more than ~30 m away from the South Rambull shear zone. The shear zones are composed of sericite and chlorite on their margins. Stretching lineations indicate vertical movement (Figure 6a). Shear sense is unknown. The shear zones do not exhibit subsidiary structures, but only rare anastomosing through the gabbro layers.
Most veins are hosted by gabbro sills (Figure 5c and 7h). Veins have vanous orientations and steep dips. Some veins are also subhorizontal; they trend E-W and gently dip to the south (Figure 6b). Veins are pure extension and extensional-shear veins, with the opening vector normal and oblique to the vein wall s, respectively (Figure 7g, h and lOb). Some shear veins 10cally occur. With the occasional exception, N-S trending and subhorizontal veins are pure extension veins and other veins are extensional-shear veins (Figure 6b). The later veins display a conjugate set where NE-SW and NW-SE trending veins have sinistral and dextral opening, respectively; they also show crack-seal textures (Figure 7g and lOb). Veins are filled with quartz, chlorite, ankerite and 10cally sericite. A few veins contain gold. Sorne veins are surrounded by an alteration halo, indicating the filling fluid reacted with host rock (Figure 7g).
Competent gabbro sills had a strong control on vein formation. Veins are confined to the sills and stop when approaching their boundaries (Figure 7h). In sorne cases, veins crosscut the contacts and propagate in the basait on a short distance. In thick gabbro sills most veins are short relative to the size of the layer and are unrestricted. The large majority of veins are restricted by gabbro layers boundaries, and stratabound vein arrays are frequent. Commonly, veins are sinuous, deviated and show branching geometries. Subvertical veins locally show horizontal diversion. Veins are thicker when oriented toward the nOlth and are frequently folded.
A significant observation is that the shear zones do not contain any vein, indicating they did not play a role in vein formation mechanism. They show mutual crosscutting relationships with rare extension veins extending out of the gabbro, indicating shear zones and veins are contemporaneous. Moreover veins are also developed in areas where shear zones are absent. Thus, at South Rambull vein emplacement was largely controlled by rock competency and not by shearing or faulting.
Veins are anti-c1ustered in the South Rambull area, with an average Cv of 0.66 (±0.1), which is a typical behaviour in stratabound arrays (Gillespie et al., 1999).
Cumulative frequency of vein spacing, thickness and length are plotted in Figure 9. Spacing shows approximately log-normal distributions for stratabound vein arrays (Figure 9a); unrestricted vein arrays gave similar plots. Unrestricted vein arrays show power law thickness distributions whereas stratabound arrays display approximately log-normal distributions (Figure 9b). Vein length suggests a power law distribution for unrestricted vein arrays. For stratabound arrays, length distributions show that most veins have a characteristic length, which is controlled by gabbro units thickness (Figure 9c).
As vein arrays are stratabound, thickness, length and spacing of veins may be highly influenced by the thickness of the hostrock layer (Wu and Pollard, 1995; Ji et al., 1998). The development of such vein systems may be largely controlled by rock competency and geometry. Stratabound vein arrays are known to be unfavourable for mineralisation (Gillespie etaI., 1999).
21 5.3. Shear zones and veins at North Rambull
At North Rambull, granodiorite is the only rock type present (gabbros are rare and only occur on the meter scale, so they are omitted in the analysis). The rock display strong sericite, chlorite and iron carbonate replacement. Quartz grains are a few mm large and are weil preserved in the least foliated rock. Shear zones are characterized by a very penetrative foliation, lamination of quartz grains and locally by strong chlorite replacement. Shear sense indicators such as lineations, steps and drag folds are abundant; they constantly indicate dextral and sinistral strike-slip movements on NW-SE and NE-SW trending shears, respectively, and reverse movement on E-W trending shears (Figure 6a and 7e). The strike slip shear zones define a conjugate set. The shear zones are developed in all the granodiorite body. They are a few meters to several tens of meters long; outcrops are too small to see the extent of longer structures, however Interpretation on aeromagnetic map suggests they can be more than 200 m long. In the eastem area, shear zones are isolated and not branched. On the other hand, to the west, shear zones of various orientations branch to form a mesh (Figure Sb). Horsetail structures are also present. A relevant observation is that no throughgoing shear zones accur at North Rambull. All movements are coherent with a N-S compression direction.
Frequent shear veins are hosted by the shear zones, to which they are subparallel (Figure 6 and 7f). Pure extension veins are hosted by the country rock outside the shear zones; they are N-S trending steeply dipping and E- W trending gently dipping to the south. Shear zones systematically cut these veins. The largest shear veins trend NW-SE. They display great thickening at dilational jogs. Veins are filled with quartz, chlorite, ankerite and seri cite; tourmaline locally occurs. Most veins contain gold. Shear veins contain foliated wall rock slivers and laminated chlorite planes, both subparallel to the vein walls (Figure 7f and 1Oc). Gold concentrations in veins are much more elevated (> 10 glt) to the west where shear zones form a mesh than to the east «1 glt) where shear zones are unconnected.
At the scale of observation, veins are very irregularly outcropping and are too widely spaced to define coherent arrays (Figure Sb). Observed vein maximum thickness is 53 cm for shear veins and 3.5 cm for pure extension veins, and maximum length is respectively 1430 cm and ~250 cm. Shear veins are much larger than pure extension veins. Shear zones are
anti-clustered, with a Cv of 0.66 (±0.21). Bad exposure and irregular vein geometries in the Rambull area did not allow measuring vein aspect ratio.
Ali the structures from the Rambull area are consistent with a regional N-S compression (Figure 6). The veins have very similar orientations and parageneses in the southern and northern areas. This strongly suggests that ail veins emplaced at the same time in ail the Rambull area.
6. Formation setting of veins
Both at MacCormack and Rambull, synchronous development of veins, subvertical foliations and shear zones, and vein folding indicate that veins emplaced in a compressional setting at the brittle-ductile transition.
Specifie failure modes occurring at MacCormack and Rambull imply different valving behaviours. On one hand, at North Rambull, shear zone hosted veins and laminated chlorite planes indicate fault-valving behaviour (Cox, 1995; Sibson et aL, 1988; Robert et aL, 1995). On the other hand, at MacCormack, pure extension veins are a sign of hydraulic valving behaviour (Foxford et aL, 2000). Here, hydraulic-valving behaviour is somewhat different from the definition of Foxford et al. (2000) in that veins have multiple orientations.
Fault-valving behaviour indicates shear reactivation was the dominant mechanism for vein formation at North Rambull (Sibson et aL, 1988). On the opposite, hydraulic-valving behaviour at MacCormack shows that shearing or faulting did not play a raie in vein formation within the Porcupine-Destor shear zone. This style of veining differs from the one present 30 km further west along the same shear zone, where shear veins indicate a fault valving behaviour (Legault et aL, 2006). However in this area, the veins are hosted by subsidiary shear zones and not by the main shear zone, the setting is thus different from MacCormack.
The tectonic setting and the modes of failure give constraints on the magnitude of the stresses (Sibson, 2004 and references therein). The mode of failure in rock is greatly influenced by the effective principal stresses which are defined as:
23 (9) where (Ji (i = 1,2,3) are the principal stresses.
The pore fluid factor (,1v) is the ratio of fluid pressure to lithostatic pressure and is given by
( 10) Hydrostatic fluid pressure conditions occur at Àv ~ 0.4 and supra-hydrostatic conditions at 0.4 < Àv < 1.0. Supra-lithostatic fluid pressure conditions are defined by Àv > 1.0. In a
compressional regime, veins form where Àv > 1.0 (Sibson, 2004).
The presence of subhorizontal veins in both MacCormack and Rambull areas show that the fluid pressure locally exceeded the lithostatic pressure and that the effective vertical stress was negative «(J') < 0) which results in Àv > 1.0. This is consistent with the fact that
veins emplaced in a compressional regime.
Pure extension failure indicates that the differential stress «(JJ-(J)) was low in both
areas. At MacCormack, common hydraulic breccia textures suggest a nearly homogeneous stress tensor (Jébrak, 1997).
Orientations of the structures at MacCormack and Rambull allow estimating the orientations of the principal stresses at the time of vein formation. Ali structures from the Rambull area indicate (JI was oriented N-S (Figure 6). Dip-slip lineations on the foliation
plane, reverse shear zones and subhorizontal veins indicate a subverti cal (J). However, sets of
conjugate strike-slip shear zones and subvertical extensional-shear veins, and N-S trending steeply dipping extension veins indicate (J) was transiently oriented E-W at Rambull. This
suggests (J) and (J2 permuted.
At MacCormack, the regional (JI orientation may be N-S. Within the country rock,
dip-slip stretching lineations and subhorizontal veins suggest the regional (J) orientation was
subverti cal (Figure 4). The local orientation of (JI in the vicinity of the transpressional shear
zone is NW-SE, as indicated by the S2 foliation. Steeply to moderately dipping NE-SW and NW-SE trending extension veins indicate NW-SE and NE-SW orientations of (J),
the local D2 defonnation, suggest (J3 permuted with (JI and (J2' Both MacCormack and Rambull vein systems may have formed during regional N-S shortening.
7. Stress in the MacCormack area 7.1. Regional stress magnitude
The vein aspect ratio was used to calculate the driving stress at MacCormack. As nearly ail veins are arranged in echelon in this area, the veins were measured following the method of Nicholson and Pollard (1985) such as shown in Figure 2b, and il? was calculated using Eq. (7). Ail measured veins overlap. Systematic ratios of Llk > 1 and s/k < 1 show that no vein behaves as an isolated vein. Normalized dilation (ND) gives values of 5-6 for veins from the rhyolite and mostly 4-6 for veins from fuchsite zones. These results suggest that veins have abnormally high thickness compared to an isolated vein, a fact that is common in overlapping vein arrays (Nicholson and Pollard, 1985; Vermilye and Scholz, 1995).
Elastic properties measured in rhyolites from the Superior province give average values of 29 Gpa for Il and 0.24 for v (Coates et al., 1968; Herget and Arjang, 1990). Using these parameters with measured W, k and ND for each vein give il? values ranging from 19 MPa to 71 MPa, and an average il? of 42 MPa. This average driving stress is very close to values from the literature determined for isolated veins (Vermilye and Scholz, 1995; Mazzarini and Isola, 2007). Average il? is consistent with the high end of the range of tensile strengths for crystalline volcanic rocks of a few to several tens ofMPa (Lockner, 1995).
To test the validity of the result, the driving stress was also calculated for veins which have a thickness approaching the thickness of an isolated vein of length L'. Using Eq. (6) give il? values ranging from 15 MPa to 49 MPa and an average il? of 34 MPa. This average value approaches the calculated driving stress of 42 MPa and thus suggests it is reliable.
The driving stress is more difficult to estimate for veins emplaced in the anisotropie foliated fuchsite-carbonate zones, because elastic properties of this rock type are unkoown. However, using a Il of 6 GPa and a v of 0.25 (Hoek, 2000) give an average il? of 48 MPa. For the following ana!ysis, the driving stress for veins emplaced in the rhyolite is used.
25
Using a density of 2600 kg m-3 for rhyolite, 1000 kg m-3 for fluid and the average driving stress of 42 MPa in Eq. (8) give a depth formation of 2.7 km for the veins. This result is consistent with the fact that the veins cut porphyric intrusions which may have emplaced at shallow depths (Robert, 2001); it is also consistent with the low metamorphic grade of the background rocks. This depth is relatively shallow when compared to depth estimation of the ductile-brittle transition in the crust which is broadly situated at 10 km. However, the ductile brittle transition could reachdepths of a few km within phyllosilicate-rich sheared rocks, especially at slightly elevated geothermal gradients (Imber et al., 2001).
The inferred depth allows estimating the lithostatic pressure or vertical stress (o"v) in
the MacCormack area at the time of vein formation. The vertical stress, 0"3, is 68 MPa.
Measurement from boreholes up to 9 km deep show that pore fluid factors in the upper crust are very close to hydrostatic values (}'v ~ 0.4; Townend and Zoback, 2000). As we assume the veins in the MacCormack area emplaced at 2.7 km depth, it is inferred that the regional pore pressure in the area was hydrostatic during vein emplacement. For hydrostatic pore pressure, the regional stress parallel to the direction of compression (0"1) during crustal shortening is assumed to be 1.6 o"v (Mancktelow, 2008). The maximum horizontal stress (0"1) is 109 MPa. Assuming the regional pore fluid factor of 0.4 in the MacCormack area, the regional fluid pressure would be 27 MPa.
7.2. Numerical modeling
Stress numerical modeling has been performed using UDEC (see 3.3) to test if rock rheological contrasts and geometries have an impact on the stress distribution in the rock sequence during regional compression. The approach was to determine if there is a correspondence between (1) the vein system location and the stress field and (2) the type of failure and the relative magnitude of the stresses.
The model comprises three rock types (Figure lIa): (1) crystalline rocks, which are the most competent, (2) sedimentary rocks, and (3) strongly deformed and altered rocks of the shear zone, which are the least competent. As no faulting occurred at the time of vein formation, ail contacts are lithological contacts. The rock and contact properties are listed in
Table 1 and are from Oliver et al. (1990, 2001), except for rocks of the shear zone. Bulk and shear modulus for the shear zone rocks have been calculated from Hoek (2000) who estimates the Young modulus of quartz mica schist to be 10 Gpa. For a wide range of Poisson's ratio (0.1 to 0.4), the highest values of the bulk and shear modulus are -15 MPa and -7.5 MPa, respectively.
The average regional foliation is oriented at 75-255° and subvertical, so the maximum compressive stress (0"1) orientation is 165-345°; its magnitude is 109 MPa (see previous section). The minimum horizontal compressive stress (0"2) is oriented 75-255° and its magnitude is taken equal to the lithostatic stress at 68 MPa. Using higher or lower values for 0"2 give similar results. The differential stress is 41 MPa and mean stress (O"m) is 89 MPa. As the model represents a horizontal section, the differential stress is (0"1-0"2) and the mean stress is (0"1-0"2)12.
During model mn and stress propagation a large negative anomal y is generated and maintained within the shear zone. Edge effects are minor and mainly focussed on the boundaries ofthe model. The model shows a good correlation between 10w O"h 0"2, O"m and the vein envelope location (Figure Il). This suggests the perturbed stress field was important for vein formation in the MacCormack area.
The low stress anomaly around the shear zone is the result of contrasting rock rheologies. These contrasts create a large gradient in maximum, mean and differential stress, and a smaller gradient in minimum stress. A cross-section through the low stress anomal y shows that the differential stress is 5-10 MPa in the centre of the anomaly (Figure 11 b). This zone corresponds to the location of the vein envelope. Such low differential stress is highly favourable for pure extension failure (Sibson, 2004). Mean stress shows that the zone of low stress is about the size of the rheological heterogeneity, i.e. the shear zone. In this zone, mean and differential stress are about five times lower than the regional input stresses. These results are in agreement with stress drops occurring in rock sequences containing heterogeneous lithologies (Ridley, 1993; Oliver et al., 2001).
The lithostatic stress (0"3) is not part of the mode} because it represents a 2D horizontal section. However, synchronous developments of subhorizonta! and subvertical
27
veins on the field indicate that (J3 was close to (JI and (J2 in the area. This suggests that (J3 washighly lowered around the shear zone, probably in the same manner than (JI and (J2.
The stress distribution in the rock sequence shows that stress conditions are suitable for the formation of pure extension fractures within the shear zone and its immediate host rocks.
8. Discussion
This section presents two models for vein formation along the Porcupine-Destor shear zone. The first model is for the Rambull area and the second one is for the MacCormack area. The models are then generalised to two end-member mechanisms for vein formation along a shear zone.
Shear zones and veins in the Rambull area form a mesh developing within the granodiorite layer (Figure 12a). During regional shortening, the throughgoing South Rambull shear zone, oriented at 80-90° to (JI, was strongly misoriented for frictional reactivation. This
may have allowed the fluid pressure to build up to supralithostatic values (Àv > 1.0), and the
fault-fracture mesh to form (Sibson, 2004). Strike-slip shear zones, oriented at 50-60° to (JI,
were the most suitable for frictional reactivation in the Rambull area (Figure 6a). Reactivation controlled shear vein formation through fault-valving behaviour. The veins indicate that the effective vertical stress was very low in the Rambull area. ln such conditions, rock failure is very sensitive to rock competency, and the most competent rocks are likely to fail under a greater range of differential stress than other rocks (Sibson, 2004). Veins and shear zones are largely developed within the granodiorite, showing this rock unit was the most suitable for failure in this area. Competent gabbro layers embedded within the basaIt were also the loci for failure. On one hand, the 200 m thick granodiorite layer favoured failure on a regional scale. On the other hand, the gabbro layers of a few meters thick constrained failure on the meter scale. The granodiorite largely controlled the development of the fault-fracture mesh in the Rambull area.
Fault-valving behaviour at Rambull indicates that veins emplaced in the seismogenic regime (Figure 13; Cox, 1995; Sibson et al., 1988; Robert et al., 1995). The fault-fracture
mesh geometry displays distributed valving which developed in the absence of throughgoing shear zone (Figure 12a). This implicates that the mesh self-generated and was not the product of rupture propagation along a major shear zone (Sibson, 2001). Sibson (2001) suggests this distributed type of fault-valving behaviour may correspond to earthquake swarm activity, where numerous small earthquakes occur without a distinct principal shock. However, as the fault-fracture mesh is located only at ~3 km from the Porcupine-Destor shear zone core, a major rupture event along this shear zone could account for the mesh formation. In such a scenario, aftershock triggering within the granodiorite could have favoured failure and formation of the fault-fracture mesh (Micklethwaite et al., 2010). In both scenarios, the fault fracture mesh may have formed as a result of static stress drop within the granodiorite.
Stress numerical modeling at MacCormack suggests the vein system formation was largely controlled by a major stress drop in the shear zone area, which is the result of contrasting rock rheologies (Figure 12b). In this model, it is assumed that regional fluid pressure is hydrostatic ().v ~ 0.4), whereas local fluid pressure (i.e. where veins formed) is supralithostatic. The following section is subdivided in two parts: (1) stress conditions before vein formation; (2) stress conditions at the time ofvein formation.
This part deals with the stress conditions before vein formation. ln a deviatoric stress field, the lithostatic stress (lTv) can be considered to be the mean stress (lTm; Ridley, 1993). The
stress profile through the rock sequence in the MacCormack area suggests that mean stress, and th us lithostatic stress, were locally lowered close to regional hydrostatic fluid pressure values (i.e. 27 MPa; Figure Ilb). When such a stress drop occurs, drop in mean stress is likely to be buffered by a drop in fluid pressure (Figure 13; Ridley, 1993). Thus, the local fluid pressure may be lower than the regional fluid pressure at the time of stress drop apparition. Ridley (1993) shows this difference in fluid pressure induces fluid flow in the zone of low pressure to equilibrate the regional fluid pressure level. At MacCormack, vein fillings indicate elements did not migrate on a large scale but rather suggest a migration on the meter scale. This strongly suggests that on a regional scale fluid pressure did not equilibrate through migration of elements, but probably through migration of an aqueous fluid. This would explain why veins are barren at MacCormack.