Science Arts & Métiers (SAM)
is an open access repository that collects the work of Arts et Métiers Institute of Technology researchers and makes it freely available over the web where possible.
This is an author-deposited version published in: https://sam.ensam.eu
Handle ID: .http://hdl.handle.net/10985/19516
To cite this version :
Jocelyn REBUFA, Gladys JAUSSAUD, Marc FOURNIER, M. LOGEAIS, N. BENCHEIKH, F. CLAEYSSEN, Marc RÉBILLAT, Mikhail GUSKOV - IMPROVING EFFICIENCY AND
ROBUSTNESS OF STRUCTURAL HEALTH MONITORING TECHNIQUES BASED ON LAMB WAVE DETECTION - In: IX ECCOMAS Thematic Conference on Smart Structures and Materials, France, 2019-07 - IX ECCOMAS Thematic Conference on Smart Structures and Materials - 2019
Any correspondence concerning this service should be sent to the repository Administrator : archiveouverte@ensam.eu
IMPROVING EFFICIENCY AND ROBUSTNESS OF STRUCTURAL
HEALTH MONITORING TECHNIQUES BASED ON LAMB WAVE
DETECTION
J. REBUFA*, G. JAUSSAUD*, M. FOURNIER*, M. LOGEAIS*, N. BENCHEIKH*, F. CLAEYSSEN*, M. RÉBILLAT** AND M. GUSKOV**
*
Cedrat Technologies S.A.
59 Chemin du Vieux Chêne - Inovallée - 38246 Meylan cedex – France Email: jocelyn.rebufa@cedrat-tec.com, https://www.cedrat-technologies.com
** PIMM Laboratory, ENSAM-CNAM-CNRS-HESAM 151 Bd de l'Hôpital 75013 Paris - France Email: marc.rebillat@ensam.eu - https://artsetmetiers.fr/
Key words: Structural health monitoring, Lamb waves, Pulse-echo, Piezo-electric arrays, High Frequency Power Amplifier
Abstract. Required improvements of piezoelectric elements actuation and measurement system efficiency and robustness are introduced as a critical feature for structural health monitoring (SHM) applications. An electronic module (Lamb wave detection system: LWDS) allowing to use each piezoelectric element in an array either in emission or reception mode is presented. The high commutation rate between these two states, for each transducer separately, is a key enhancement for SHM methods. The robustness of the sensor integration is also studied considering the patches size and bonding method. Coupled dispersion curve are introduced Comparison of FEM simulation and experiments of the piezo-electric coupling are presented. This work takes part of the H2020 REMAP project about adaptive aircraft maintenance planning.
1 INTRODUCTION
Ultrasonic waves generated by piezo-electric patches offer a very promising way to perform Structural Health Monitoring (SHM) of composite aeronautic structures. Permanently bonded sensor arrays are interesting for on-demand interrogation of the structure in order to detect and localize damages (pits, disbonds), or to follow damage progression (cracks, delaminations). At the opposite of NDT techniques, SHM is independent from the operators.
Many applications have been reported for space applications [1], aircrafts [2] or civil engineering [3]. One can divide the piezoelectric elements applications between passive and active methods [4]. In passive methods piezoelectric elements array can be used to monitor acoustic emissions [5]. Active methods use signal generation on piezoelectric transducer to interact with the structure. Usual piezoelectric elements array are generally used to generate Lamb waves in plates [6]. The transmitted Lamb waves are received by another piezoelectric element in a pitch-catch mode, or by the same piezoelectric element in pulse-echo mode. The
wave generation can be controlled by phased array of various forms and distribution [4], [7]– [10]. Diverse signal processing methods can be used for damage monitoring with the signal measured with piezoelectric elements, such as transfer functions, time of flight analysis with cross correlation envelope [4], instantaneous baseline [11], time reversal [12], [13]. This can lead to an efficient damage localization mapping of the structure. However the positioning of the emitting and receiving piezoelectric elements, or the management of the commutation between these two states are of prior importance to ensure the covering of the whole structure as well as optimal signal quality.
Recently, Lamb waves detection techniques have been enhanced by developing a dedicated electronic system called Lamb Wave Detection System (LWDS) [8]. This module allows to use each piezoelectric element in an array either in emission or reception mode. Each sensor can not only be used in the usual pitch-catch method, (i.e. one sensor is emitting and the other sensors are receiving the propagated wave information), but also in pulse-echo (i.e. emitting a lamb wave and listening to the echo simultaneously on the same patch). This feature can drastically improve PZT network efficiency for SHM purposes as one additional information source (the signal received back by the exciter) is made available. All transducers can be used simultaneously to scan the structure, and directly listen to the structure response. It facilitates the use of advanced methods such as instantaneous baseline, beamforming in emission and reception, time reversal or other advanced algorithms.
Moreover the quality of signals is also highly impacted by the robustness of the sensor integration [14], [15]. Complex contributions such as the effects of temperature [16], or also adhesive nonlinearities [17] have been highlighted. The durability of sensor is also crucial for the proper application of SHM algorithms [18].
In order to overcome these difficulties and to improve SHM detection techniques, this paper presents a combination of an advanced electronic system with a robust piezo wafer integration within the host structure.
First, the electronics detection system is presented in detail. Commutation rates against capacitive loads of piezo patches is discussed, as well as Signal to Noise Ratio (SNR) improvement. Second, a focus is made on a fine study of coupling efficiency between the piezoelectric patches and Lamb wave propagation through so-called tuning curves. This feature helps in selecting the correct frequency range for ultrasonic SHM interrogation. These results are compared to FEM simulation on ATILA/GiD software. In the last part an experimental study is performed and the correlation with theory and simulation is discussed.
2 LAMB WAVE DETECTION SYSTEM & ELECTRONICS
The LWDS electronics is made for multi-channel Lamb wave excitation and measurement of thin structures.
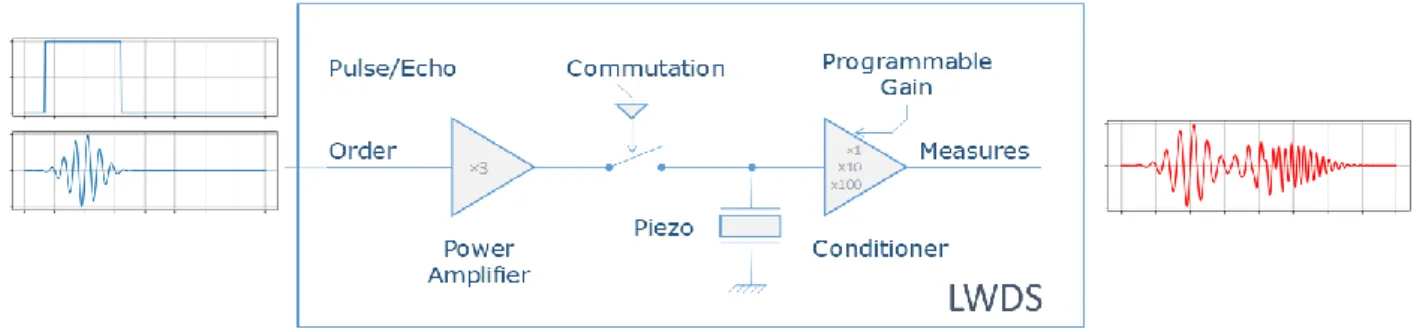
From the hardware point of view, a channel suited for piezoelectric patches is described on Figure 1. This channel is typically composed of three analog functions:
A power amplifier to drive the piezoelectric patches in order to emit the acoustic waves on the structure.
patches.
A commutation function to be able to switch each piezoelectric patch between emission and reception modes.
The power amplifiers offer an unloaded wide bandwidth of 2.5 MHz with a current limit of 0.5 A peak, in order to reach the ultrasonic range and feature a high SNR (more than 70 dB). They are specifically designed to drive capacitive loads, since the piezo elements have a capacitive behavior.
Figure 1 : High frequency commutation with LWDS
The conditioners offer a wide bandwidth to match the amplifier bandwidth and a very high SNR to be able to receive acoustic waves of low amplitude. If required, the conditioners can feature a variable amplifier gain up to 100, which is particularly interesting for laboratory setups. A picture of the LWDS module is presented on Figure 2 with 36 channels.
The switching function, allowing pulse-echo technique, offers the possibility to switch the patch between the two modes (emission or reception). This enables to emit a signal with a patch and to monitor the echo of the signal on the same patch, maximizing the detection ability for a given quantity of patches, cables and boards. It is thus a cost effective solution that reduces the complexity of the system. In order to take advantage of this function, the commutation time has to be short enough to be able to catch the echo. As an example a burst of 5 cycles at 1 MHz lead to a commutation time of 5 µs. The LWDS allows commuting between emission and detection within 1 µs. The echo can be caught even if the damage is very close from the patch.
Figure 2 : Up to 36 PZT channels simultaneously emitting or receiving signals with 1 µs selective commutation
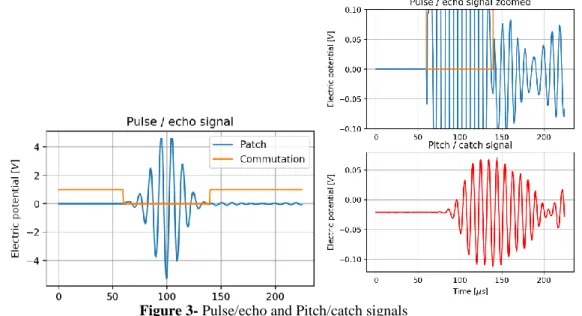
part of the figure shows the pulse signal applied by the emitting patch. The commutation signals enables the recording of the same patch for the reflected wave analysis. The center graph is a zoom on y-axis to observe reflected waves with around 20% of the emitted wave amplitude. The lower graph shows the signals measured by a second patch at the same order of magnitude as the echo signal.
Figure 3- Pulse/echo and Pitch/catch signals
In addition to the previous functions, some generation and sampling functions are required to send the orders, and to record the received signals for analysis. This could be done with regular generators and with oscilloscopes or acquisition platforms. However, SHM applications often require specific equipment since multiple channels are required, as well as very high refresh rates. In order to reduce the time for acquisition and the complexity of the setup, dedicated generation and acquisition platforms are recommended. These platforms feature:
Several synchronized input or output channels with refresh rates up to 10 MSps. High resolution to comply with the high SNR requirements of the SHM applications. Arbitrary generator channels so that the user can generate any waveform, to fit with
his application.
Interface with computers and dedicated GUI for loading the signals to be generated and recovering the recorded data
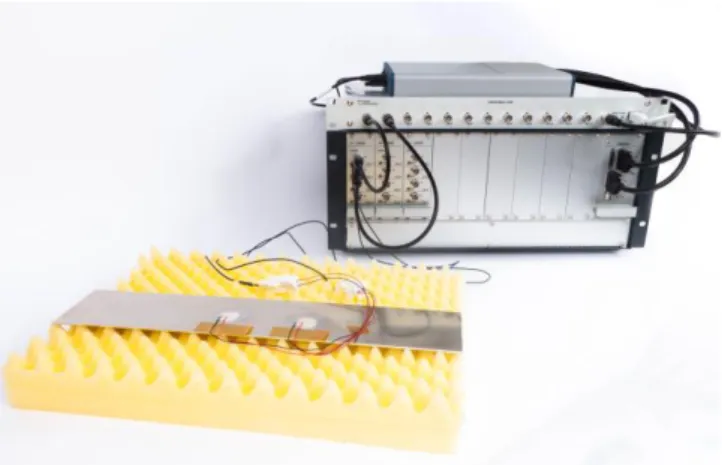
A picture of a full setup is presented on Figure 4.
The simultaneous excitation of all the piezo array with appropriate phase shifts allows beamforming for excitation [10] in excitation mode, as well as retro-propagation beamforming for acoustic wave field reconstruction [12] in listening mode.
The high frequency of commutation allows as correct patch selection to get closer to a defect and rapidly converge toward the spatial position of a damage.
Figure 4 : Test bench of Lamb wave emission and acquisition with LWDS
3 PIEZO ELECTRIC PATCHES COUPLING MODELLING
In this part a focus is made on the definition of the piezo patches array, based on coupling efficiency, patch size, & material in order to get an efficient, reliable and robust SHM solution.
3.1 Dispersion curves
The detection of structural damages using Lamb Waves detection methods require some particular attention about the choice and the positioning of the piezo patches, and the frequency range to study. The dispersion curves are a useful tool to predict and understand the behavior of the sensorized structure and the patches signal output. These curves are based on analytical equations of waves propagation in frequency-wave number domain. They are function of the material and thickness of the structure. The material is considered as homogeneous and edge effects are not taken into account.
a) Dispersion curve b) Diameter coupling efficiency
Figure 5 : Coupled dispersion curves of Lamb waves for a patch diameter 20 mm. Good coupling shown in
green, low coupling in red S0
In ReMAP application the structure of the plate is defined: material is a multi-layer composite made of graphite-epoxy Hexcel IM7/8552 with 1.7mm thick. The computation of the equivalent homogeneous properties allows to plot the dispersion curves. Figure 5 shows the first symmetric and antisymmetric modes S0 and A0. A first criteria in SHM is to work in a frequency range where there is only the firsts mode to simplify the signal output analysis.
One cleverness of ReMAP approach is to add the information about the coupling between the piezo patches and the structure, in order to help in defining an efficient SHM solution.
Considering the diameter DPZT of the piezo patch and the wave length of the considered
mode, the coupled dispersion curve takes into account the facts that:
If DPZT = n. , the patch cannot couple (excite or detect) the considered mode.
If DPZT = (2n+1). /2, the patch maximally couples (excites or detects) the considered mode. Because the wave lengths of A0 and S0 modes are different for a given frequency, both modes are not equally coupled in general. So the coupled dispersion curve is a tool for choosing how to couple S0 or A0 modes by selecting the frequency and exhibits one role of the coupling. The coupling aspect also manages the choice of the patch diameter with respect to the damage. The last point to study is to compare the size of the damage DDamage with the wavelength. A damage will be better detected if its diameter is half of the wavelength, giving another design criteria
If DDamage = /2, the damage is optimally detected.
But this criteria is a more qualitative one than very predictive because of the different kinds and shapes of damages that the wave can encounter.
Besides, the material of the patches is selected to have a high value of 𝑑31 coefficient. This means that the voltage difference applied on the patch electrodes, implies a high in-plane deformation to the board, the polarization of the patch being orthogonal. Additionally, a low Q factor, a low aging and a thermally stable behavior are requested.
3.2 Finite element modelling
3.2.1 Wave propagation on a plate
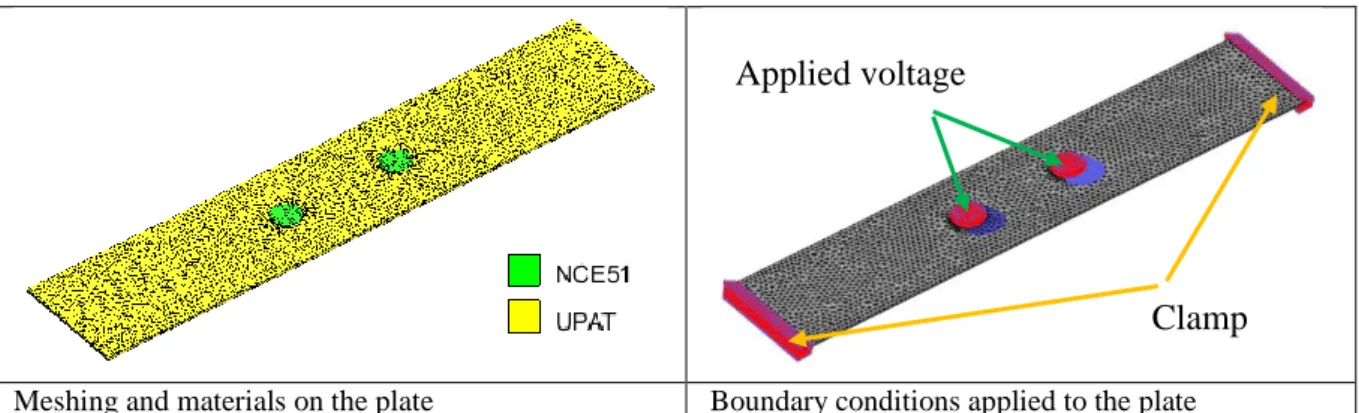
A sample of composite plate 200x40mm² is modelled using finite element method. The modelling is performed on ATILA/GiD which enables to run transient analysis with piezoelectric coupling.
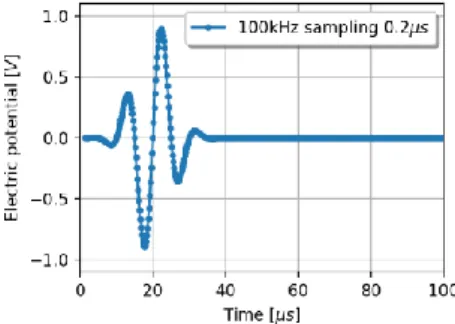
Figure 6 - Burst excitation at 100 kHz used in simulation
piezo-patches. A voltage is applied between the two faces of one patch. The voltage signal applied to the patch is a burst of a given frequency. The temporal signal is shown on Figure 6. The other patch has one electrode at 0V and the other free and is used in order to measure the voltage generated by the plate deformation. The plate is clamped at its two edges.
Meshing and materials on the plate Boundary conditions applied to the plate
Figure 7 – FEM Simulation conditions in ATILA/GiD
A first modelling is performed with a coarse meshing (element size=4mm). For each frequency of the burst signal input, the convergence as a function of the mesh have to be carefully studied, particularly at high frequencies (>200 kHz). The meshing, materials and boundary conditions can be seen on Figure 7.
The transient displacement calculated for a burst at 100 kHz is given on Figure 8. The wave length is clearly visible and the displacement shape follow a cross repartition. That cross is representative of the fact that the material is orthotropic: the wave velocity is not the same in all directions.
Figure 8 - Wave propagation in composite plate, 100 kHz
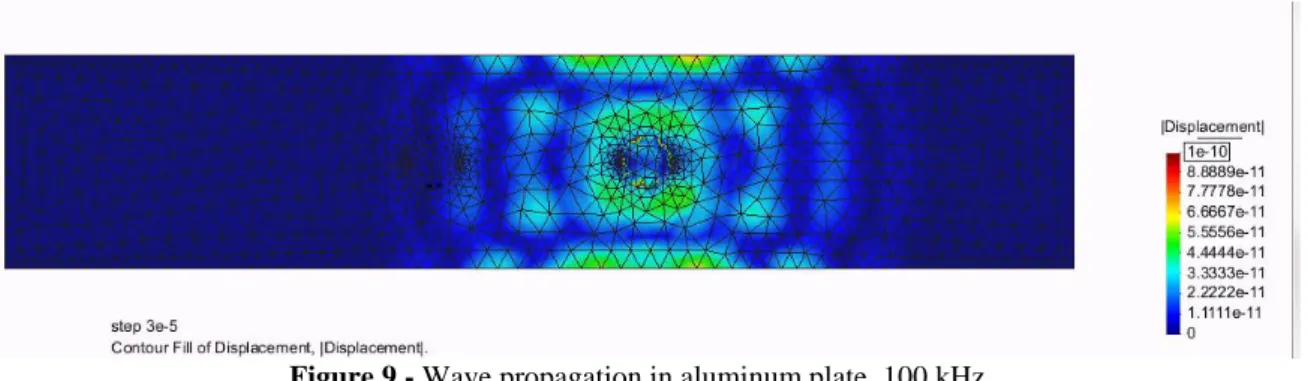
The same simulation is then performed considering an aluminum plate. In this case the distribution of the displacement is square. Close to the piezo patch the distribution is more circular like the patch shape. Then the square aspect can be explained by the edge effect.
Clamp Applied voltage
Figure 9 - Wave propagation in aluminum plate, 100 kHz
Using the plate made of composite material, the frequency of the burst is changed from 100 kHz to 200 kHz. For each signal the maximum displacement in the plate under the piezo patch is measured. The amplitude is plot in function of the frequency in Figure 10.
Figure 10 - Amplitude under the patch used in detection mode
We can see that the maximum of amplitude varies with the frequency of the signal. The amplitude is higher at 200 kHz than at 100 kHz which can be related to the coupling effect.
3.2.2 Damage detection
The finite element modelling is then performed using an aluminum plate with a local damage. The choice is made to represent the damage as a forced zero displacement in the damage zone. The goal of this computation is to study the wave propagation in the case which the wave encountered a damage. The material and boundary conditions are the same as previously described, we just changed the damage condition.
Figure 11 – Displacement clamping to simulate a damage Damage
A MATLAB program is written to enable the comparison between two result distributions. Particularly, it’s used to plot the displacement distribution difference between a perfect structure with homogeneous material and the structure with the damage. The displacement distribution into the two healthy and damaged structures, and the distribution difference, are shown on Figure 12.
Figure 12 - Localization of the damage using Lamb Waves
The difference on displacement distribution clearly allows to establish the position of the damage. By varying the frequency on the signal we could study the quality of the detection, and compare these results with the dispersion curves and study the coupling. The transducer array could compute the difference in time with the emitting sensor synchronization. The fast commutation of the LWDS in this configuration is relevant for scanning the full structure quickly while keeping one additional measurement for virtual back-propagation.
4 EXPERIMENTAL VERIFICATIONS
In this part the LWDS electronics is used to compare coupling efficiency between pitch-catch mode and pulse-echo mode. Two samples are tested, equipped with two patches.
4.1 Gluing process
In the modelling we consider a perfect interface between the patches and the plate. In reality, the piezo patches are fixed on the plate by gluing. To ensure a good coupling between the patches and the plate another important point is the glue choice. In the frame of needs about reliability, the glue have to respect several criteria:
- Low thickness - High shear modulus - High thermal range - High chemical resistance
Easy gluing process (cure at ambient temperature in aim at equipping large structures)According to these criteria, an epoxy glue have been chosen for the application. Then an accurate gluing process have been written to control the glue thickness and make the gluing as reproducible as possible. An overview of the gluing is available on Figure 13.
Figure 13- Overview of the patches gluing 4.2 Frequency tuning curve
In this section the comparison of the pulse echo and pitch catch modes are presented while varying the frequency of the burst excitation.
The Figure 14 shows two examples at 150 kHz and 250 kHz. One can notice a qualitative significate decrease in received signal amplitude.
Good coupling at 150 kHz Low coupling at 250 kHz
Figure 14- Comparison of different frequency for time signals
The amplitude ratio between excitation burst and reflected wave (coupling efficiency, in %) is compared between echo mode and catch mode in Figure 15. This picture shows relevant correlation between both transducers. It can be also correlated with coupled dispersion curves. The frequency 150 kHz shows a high coupling coefficient for the tested aluminum plate.
4.3 Toward robustness of SHM
In this section, four configuration are compared using two board samples and switching the emitting patch, and accordingly the pulse-echo mode and pitch catch mode. Figure 16 shows the results for the 2x2 configurations.
One can notice that the permutation of emitting and receiving patch in pitch catch mode shows very close results. For the pulse-echo mode, each transducer has its own coupling, but the trends are comparable for the 4 sensors. The variations between two different plates may be due to various factors such as gluing or piezo ceramics. These variations should be managed by software processing, for example by calibrations. The most important will be the time stability in order to clearly see any damage birth and growth.
So the future works should consider aging versus temperature cycles and time.
Figure 16- Reproducibility testing on patch coupling with two plates with two patches. Pulse/echo is
represented by continuous lines, Pitch/catch by dotted lines 5 CONCLUSION
The baseline for the study of the robustness of SHM system has been detailed. The concept of coupled dispersion curves is introduced; Analytical, FEM simulation and experiments have been presented through examples to recall the notion of tuning and coupling in SHM systems. Different structural material have been tested including composites in the simulation campaign, illustrating the analytical results with spatial propagation analysis.
Experimental results showed good correlation with the well-known tuning curves. Apparent coupling coefficient is exposed for pulse-echo mode and pitch catch mode. The pulse echo mode shows an interesting behavior compared to pitch catch, showing that the commutation of sensor is relevant as an additional information to enhance the performance of SHM algorithm. The configuration discrepancy is analyzed on the coupling coefficient.
The synchronous difference of signals between a plain plate and a damaged plate has been illustrated through a 3D example and displacement mapping. Pulse-echo method can be relevant for increasing the efficiency of instantaneous baseline algorithm, or to decrease the number of patches to cover a whole structure.
As presented in the literature review there are many other algorithms such as time reversal and beamforming that are being develop to map structures and identify damages. The use of pulse echo method and the proper handling of transducer integration is likely to be key in future improvements.
ACKNOWLEDGEMENT
Most of the results have been achieved in the framework of H2020 ReMAP Project Grant n° 769288 : Real-time Condition-based Maintenance for Adaptive Aircraft Maintenance Planning, https://h2020-remap.eu/
REFERENCES
[1] V. Giurgiutiu, B. Lin, G. Santoni-Bottai, et A. Cuc, « Space Application of Piezoelectric Wafer Active Sensors for
Structural Health Monitoring », J. Intell. Mater. Syst. Struct., vol. 22, no 12, p. 1359‑1370, août 2011.
[2] K. Diamanti et C. Soutis, « Structural health monitoring techniques for aircraft composite structures », Prog. Aerosp.
Sci., vol. 46, no 8, p. 342‑352, nov. 2010.
[3] D. Feng et M. Q. Feng, « Computer vision for SHM of civil infrastructure: From dynamic response measurement to
damage detection – A review », Eng. Struct., vol. 156, p. 105‑117, févr. 2018.
[4] L. Yu et V. Giurgiutiu, « Advanced signal processing for enhanced damage detection with piezoelectric wafer active
sensors », Smart Struct. Syst., vol. 1, no 2, p. 185‑215, avr. 2005.
[5] Nihon-Hihakai-Kensa-Kyōkai, Éd., Practical acoustic emission testing. Tokyo: Springer, 2016.
[6] Z. Sun, B. Rocha, K.-T. Wu, et N. Mrad, « A Methodological Review of Piezoelectric Based Acoustic Wave Generation
and Detection Techniques for Structural Health Monitoring », Int. J. Aerosp. Eng., vol. 2013, p. 1‑22, 2013.
[7] L. Yu et V. Giurgiutiu, « In situ 2-D piezoelectric wafer active sensors arrays for guided wave damage detection »,
Ultrasonics, vol. 48, no 2, p. 117‑134, avr. 2008.
[8] T. Porchez, N. Bencheikh, et F. Claeyssen, « Piezo-composite patches applied to the detection of defects using Lamb
wave focusing », in ResearchGate, 2011.
[9] W. Wang, H. Zhang, J. P. Lynch, C. E. S. Cesnik, et H. Li, « Experimental and numerical validation of guided wave
phased arrays integrated within standard data acquisition systems for structural health monitoring », Struct. Control
Health Monit., vol. 25, no 6, p. e2171, juin 2018.
[10] P. Kudela, M. Radzienski, W. Ostachowicz, et Z. Yang, « Structural Health Monitoring system based on a concept of Lamb wave focusing by the piezoelectric array », Mech. Syst. Signal Process., vol. 108, p. 21‑32, août 2018.
[11] S. Park, S. R. Anton, J.-K. Kim, D. J. Inman, et D. S. Ha, « Instantaneous baseline structural damage detection using a
miniaturized piezoelectric guided waves system », KSCE J. Civ. Eng., vol. 14, no 6, p. 889‑895, nov. 2010.
[12] R. Zhu, G. L. Huang, et F. G. Yuan, « Fast damage imaging using the time-reversal technique in the frequency–
wavenumber domain », Smart Mater. Struct., vol. 22, no 7, p. 075028, juill. 2013.
[13] J. He, C. A. C. Leckey, P. E. Leser, et W. P. Leser, « Multi-mode reverse time migration damage imaging using ultrasonic guided waves », Ultrasonics, vol. 94, p. 319‑331, avr. 2019.
[14] J. Agrahari et S. Kapuria, « Effect of Piezoelectric Transducer Bonding on Time Reversibility of Lamb Waves in Plates », in Structural Health Monitoring 2015, 2015.
[15] S. Mustapha et L. Ye, « Bonding Piezoelectric Wafers for Application in Structural Health Monitoring–Adhesive
Selection », Res. Nondestruct. Eval., vol. 26, no 1, p. 23‑42, janv. 2015.
[16] E. Balmès, M. GUSKOV, M. REBILLAT, et N. MECHBAL, « Effects of temperature on the impedance of
piezoelectric actuators used for SHM », in 14th Symposium on Vibration, Shock and Noise (VISHNO), France, 2014, p. 1–6.
[17] S. Shan, L. Cheng, et P. Li, « Adhesive nonlinearity in Lamb-wave-based structural health monitoring systems », Smart
Mater. Struct., vol. 26, no 2, p. 025019, févr. 2017.
[18] H. Pfeiffer, F. Fransens, et M. Wevers, « Durability and Self-Testing of Sensor Bondings used in Structural Health Monitoring », présenté à EU Project Meeting on Aircraft Integrated Structural Health Assessment (AISHA), 2007.