HAL Id: hal-01085400
https://hal.inria.fr/hal-01085400
Submitted on 25 Nov 2014
HAL is a multi-disciplinary open access
archive for the deposit and dissemination of
sci-entific research documents, whether they are
pub-lished or not. The documents may come from
teaching and research institutions in France or
abroad, or from public or private research centers.
L’archive ouverte pluridisciplinaire HAL, est
destinée au dépôt et à la diffusion de documents
scientifiques de niveau recherche, publiés ou non,
émanant des établissements d’enseignement et de
recherche français ou étrangers, des laboratoires
publics ou privés.
”May the fork be with you”: novel metrics to analyze
collaboration on GitHub
Marco Biazzini, Benoit Baudry
To cite this version:
Marco Biazzini, Benoit Baudry. ”May the fork be with you”: novel metrics to analyze collaboration
on GitHub. Proceedings of the 5th International Workshop on Emerging Trends in Software Metrics
(WETSoM 2014), Jun 2014, Hyderabad, India. pp.37 - 43, �10.1145/2593868.2593875�. �hal-01085400�
“May the Fork Be with You”:
Novel Metrics to Analyze Collaboration on GitHub
Marco Biazzini, Benoit Baudry
INRIA – Bretagne Atlantique, France<name>.<surname>@inria.fr
ABSTRACT
Multi–repository software projects are becoming more and more popular, thanks to web–based facilities such as GitHub. Code and process metrics generally assume a single reposi-tory must be analyzed, in order to measure the characteris-tics of a codebase. Thus they are not apt to measure how much relevant information is hosted in multiple repositories contributing to the same codebase. Nor can they feature the characteristics of such a distributed development pro-cess. We present a set of novel metrics, based on an original classification of commits, conceived to capture some interest-ing aspects of a multi–repository development process. We also describe an efficient way to build a data structure that allows to compute these metrics on a set of Git reposito-ries. Interesting outcomes, obtained by applying our metrics on a large sample of projects hosted on GitHub, show the usefulness of our contribution.
Categories and Subject Descriptors
D.2.8 [Software Engineering]: Metrics—Process Metrics; K.6.3 [Management of Computing and Information Systems]: Software Management—Software Process
General Terms
Measurement, Management
Keywords
Software process metrics, Distributed Version Control, Git, Github
1.
INTRODUCTION
We witness an impressive growth in the adoption of De-centralized Version Control Systems (from now on DVCS), which are in many cases preferred to centralized ones (CVCS) because of their flexibility for handling concurrent develop-ment and distribution of “mergeable” codebases.
The purpose of CVCSs has always been to maintain a sin-gle authoritative codebase, while letting each developer have only a single revision of each of its files at a time. DVCSs are primarily meant to let the developers access, maintain and compare various versions of the same codebase, along with their commit histories, in a decentralized fashion. In such a scenario, authoritative repositories (if any) are just conventionally designated as such by the community of de-velopers.
Current software metrics focus either on the analysis of the code (code metrics) [2,6,9] or of design documents [1,7], or on characterizing the development process (process met-rics) [4, 10–12]. They have merits and pitfalls, well stud-ied in the literature. Recent studies focus on the impact of branching and merging on the quality of the product [13]. They all implicitly assume a single repository to be analyzed to measure the characteristics of a single software product. Nowadays, this is no longer a safe assumption.
The recent boost in the adoption of DVCSs has been driven by public web–based aggregators that greatly facili-tate the access to DVCS–based repositories and the interac-tion among different copies of their codebases. Let us take the case of GitHub. Thanks to the “fork–and–contribute” policy of GitHub, the highly non–linear history of Git repositories becomes publicly exposed and easily duplicable in independent but inter–communicating copies at will.
GitHubmakes it public what is normally disclosed only among developers sharing branches of their Git repositories. An explicit (and possibly cumbersome) peer-wise synchro-nization of local repositories is no longer needed. Anyone can contribute to any repository by creating a personal public fork and pushing changes to this fork. Any change may even-tually be pulled from any other fork of the same repository, including of course the original one.
The facilities provided by web hubs like GitHub have been shown to have an impact on the characteristics of the development process, both by easing the parallelization of the tasks within a team [5] and by increasing the number of relevant contributions coming from outsiders [14]. This fact poses at least two open issues: (i) how to analyze commit histories scattered in multiple repositories and (ii) how to characterize such a distributed development process.
For the purpose of having a consistent chronological his-tory of a project, it may be enough to only consider its mainline. This repository is progressively updated and thus reliably and consistently shows the evolution of the code.
But, since the other forks of a project are independent and publicly available as well, such a choice seems of a too
limited scope. It may easily discard the complexity of the state of the software: the complete codebase of a project (or, from a slightly different perspective, the set of all versions of a software) on GitHub is more than what is committed in the mainline.
A legitimate question arises: is the only analysis of the mainline enough to fully grasp how the software is developed by the community of all contributors? To meaningfully an-swer this question, we need a way to quantify the amount of contributions dispersed in the various forks, in order to understand how much information would one discard by not considering, beyond the mainline repository, the rest of the project–related cosmos out there on GitHub.
In this paper we bring the following contributions: • A methodology to efficiently aggregate and analyze
commit histories of GitHub forks related to the same project.
• A classification of commits, explicitly conceived for the analysis of DVCSs, which characterizes their dis-tributed development process.
• A set of novel metrics to quantify the degree of disper-sion of the contributions in a codebase which is dis-tributed on multiple repositories.
We then illustrate the usefulness of our metrics, by re-porting outcomes obtained by mining 342 GitHub projects, composed by a total of 3673 forks.
The paper is organized as follows. Section 2 explains the motivations and the challenges of our work; Section 3 presents our contributions; Section 4 describes interesting experimental outcomes obtained by computing our metrics on a large sample of GitHub projects; Section 5 shows how our commit classification and metrics can be used in vi-sual data analysis to enlighten interesting features of multi– repository projects. Finally, Section 6 lists the threats to the validity of our outcomes and Section 7 presents our con-clusion.
2.
THE IDENTITY OF A CODEBASE ON
GITHUB
Using GitHub as a centralized facility produces a previ-ously unseen way of distributing the development process. The mainline repository of a software is no longer the only publicly available codebase.
The status of the various forked repositories of a project is an interesting novelty: these forks are complete codebases, but they do not represent the “official version of the code” — which is in the mainline repository. Thus, hierarchical structures of interconnected public forks, which ultimately ends in an official mainline, are possible.
Public open–access forks, which variably differ from their mainline, greatly increase the chances of software diversi-fication to occur: different variants of the same software are publicly available as distinct codebases, which can be independently modified. Such a phenomenon, that is identi-fiable as diversification only from the standpoint of a global look at the whole ensemble of project forks, is mostly unin-tentionally produced in each fork. It starts from pure code redundancy and then evolves towards an emergent diversity. Evolutionary speaking, it is possible for a forked repository to become the mainline of a new “breed”. A developer may
freely choose which one of many forks is mainline to her, notwithstanding what is currently designated as mainline by the core team of developers in a project.
The challenges to be faced in analyzing a multi–repository project have been well explained, taking the prominent case of Git repositories [3]. One of the most serious and un-resolved difficulties lies in the fact that, being the commits dispersed in distinct repositories, it is unclear if and to which extent all relevant contributions are expected to be found in the mainline repository. Are the possibly many other forks otherwise worth mining? Even once one had set up his mind for this second option, the way to efficiently aggregate, com-pare and mine information from a set of forks belonging to the same “family” is still to be investigated.
Whenever a fork is created from an existing repository on GitHub, its commit history is an exact duplicate of that of the original repository. Then, the histories of the reposito-ries may repeatedly diverge and re-converge, following possi-bly very different evolutions. The divergence of two commit histories may be measured by tracking those commits that are made after the creation of a fork and whose occurrence in the other forks, which derive from the same mainline, presents non-trivial traits (e.g., they are not present in all the forks of a given mainline, but only in some of them). Let us call these interesting commits iCommits, for brevity. By tracking iCommits we can actually measure to which ex-tent the family of forks of a given project contains relevant contents which are not in the mainline of its codebase, or which are shared only among subgroups of its community of developer.
Thanks to our novel commit classification, upon which our original metrics are defined, we are able to answer the following research questions:
R.Q. 1 — Are there commits related to a given project that are dispersed in forks other than the project mainline?
R.Q. 2 — Are there differences in the collaboration pat-terns of multi–repository projects which we can track by analyzing their distributed commit history?
3.
METHODOLOGY AND METRICS
We propose in the following a methodology to effectively extract from a set of forks some useful information about their similarity in terms of commit history. We first pro-pose a viable way to create an all–encompassing repository, which gathers the history of all the forks pertaining to the same project. Then we define a classification of commits that allows to quantify the amount of difference among the commit histories of the various forks. Finally, we define a set of metrics based on our commit classification.
3.1
One umbrella to rule them all
To get to know which commits belong to each category, we need a practical way to analyze the ensemble of all forks of a given project. We need to know what do they have in common and how each fork differs from the mainline. Since a software repository may have hundreds of forks, each of which may comprise thousands of commits, a clever way of handling the data complexity is needed.
We propose an original approach, consisting of building a single Git repository that includes all GitHub forks of the same project. We call it the umbrella repository. From the
operational standpoint, the procedure to build the umbrella repository of a project P is quite straightforward:
1. Create and empty Git repository R;
2. For each fork f in the fork family of P , add f as a git remoteto R, naming it with a unique identifier; 3. For each branch b of each fork f added to R, fetch the
content of b into R.
By adding all branches of each fork as remotes in the same Git repository, we can let Git work for us in building the common commit history among all forks and optimize the memory needed to store all data coming from different repositories. The umbrella repository contains the official mainline of the project and any other commit published in one of its forks. Identical commits are automatically de-tected and their presence (or absence) in the various forks is easily traceable. Same considerations hold for information related to branches, authors etc.
By melting together all the forks of the same project we obtain very complex development histories organized in di-rected acyclic graphs, in which all structural information are preserved and can be matched, compared and mined in a seamless way. In order to ease the task of data or-ganization and metric extraction from Git repositories, we implemented our own toolset, called GitWorks, available on GitHubas well1
. It is a pure Java application, which works on top of JGit2
. Thanks to GitWorks, the whole procedure, from the creation of umbrella repositories to the computa-tion of our metrics on all projects, is completely automa-tized.
Our approach can be useful for different purposes. It can be used to characterize the “official” history of the develop-ment of a software with respect to the rest of the contribu-tions, for instance by reporting the differences between the mainline and the various forks. In the following, we use it to “extensionally” characterize the state of the art of a given codebase, across all publicly available forks at a given point in time.
3.2
Commit classification
In order to understand if and how much the various forks composing an umbrella repository contain iCommits, we propose to first detect, in each fork, all commits made af-ter the creation of the fork itself. By considering these ones only, we discard all commits that are part of a fork since the very moment of its creation, thus not meaningful to assess developers’ activity.
Once we have the set of iCommits, we partition them into the following categories:
– unique: iCommits existing in one fork only.
– vip: iCommits existing in several (but not all) forks and in the mainline.
– u–vip: iCommits existing in the mainline and in one other fork only.
– scattered: iCommits existing in several forks, but not in the mainline.
1
See https://github.com/marbiaz/GitWorks.
2
See http://eclipse.org/jgit.
– pervasive: iCommits existing in all repositories.
These categories are useful to get a glimpse of the activity in the various forks of a project codebase. unique and scat-teredcommits are interesting in that they are proof of de-velopment activity which is independent from the mainline repository. vip and u–vip commits, on the other hand, are evidences of mainline–related activity, which is distributed in subsets of forks. pervasive commits indicate to which extent new contributions are shared among the whole com-munity of contributors.
With the help of some notation, we can formally define our categories as sets of commits related to a given umbrella repository R.
Let C be the set of all commits cibelonging to R.
Let F be the set of all forks fi composing R. In the next,
we assume |F | > 1.
Let M be the set of all commits belonging to the history of the mainline in R.
Finally, let f Count : C −→ N be a function which, given a commit c ∈ C returns the number of forks in F created before c and whose commit history includes c.
We give the following formal definitions, for a given um-brella repository R.
Def.1. The set U of unique commits is defined as U = {ci∈ C : f Count(ci) = 1}.
Def.2. The set V of vip commits is defined as V = {ci∈ C : ci∈ M ∧ |F | > f Count(ci) > 2}.
Def.3. The set W of u–vip commits is defined as W = {ci∈ C : ci∈ M∧|F | > f Count(ci)∧f Count(ci) = 2}.
Def.4. The set S of scattered commits is defined as S = {ci∈ C : ci∈ M ∧ f Count(c/ i) > 1}.
Def.5. The set P of pervasive commits is defined as P = {ci∈ C : f Count(ci) = |F |}.
We are also able to give a more precise definition of iCom-mits of R:
Def.6. We call iCommits the commits belonging to the union set
I = U ∪ V ∪ W ∪ S ∪ P.
In Section 4, we present some evidence of the occurrence of iCommits on a sample of GitHub projects.
3.3
Dispersion metrics
We now define some simple metrics, based on the above given definitions, for a given umbrella repository R.
M. 1: unique-count is defined as uc = |U |. M. 2: unique-ratio is defined as ur = |U |/|I|. M. 3: vip-count is defined as vc = |V|. M. 4: vip-ratio is defined as vr = |V|/|I|. M. 5: u–vip-count is defined as uvc = |W|.
M. 6: u–vip-ratio is defined as uvr = |W|/|I|. M. 7: scattered-count is defined as sc = |S|. M. 8: scattered-ratio is defined as sr = |S|/|I|. M. 9: pervasive-count is defined as pc = |P|. M. 10: pervasive-ratio is defined as pr = |P|/|I|. While the ∗-count metrics are the cardinality of the sets we defined, the ∗-ratio metrics are the same cardinalities normalized over the total amount of iCommits.
These metrics allow to quantify to which extent the com-mits of an umbrella repository are scattered among its forks. By computing these metrics, we obtain a set of values that synthetically describe the commit dispersion in a multi– repository project.
4.
PRYING UNDER THE UMBRELLAS
According to FLOSSmole [8] (Free Libre OpenSource Soft-ware) statistics, GitHub had 191765 repositories publicly available at May 2012. In order to obtain a statistically representative sample of GitHub hosted projects, we sort project first repositories (those that are not forks of other repositories) according to the number of watchers. To dis-card outliers and less significant entries, we decide to cut off the extremals of the range, i.e. projects whose number of watchers is less than 2 or more than 1000. Then we select 1% of the projects in each of three subsets:
• Projects that had from 2 to 9 watchers (total: 30236 ; sampled: 303)
• Projects that had from 10 to 99 watchers (total: 3554 ; sampled: 36)
• Projects that had from 100 to 999 watchers (total: 286 ; sampled: 3)
For each sampled project, we clone the selected mainline repository and all the publicly available forks descending from it (direct forks, forks of the forks, etc.). The resulting set of 342 umbrella repositories, each of which has a main-line and all “generations” of its forks, sums up to a total of 3673 Git repositories. This is our GitHub sample. In-formation about the fork family of each project, the owner and the creation time of each fork, as well as many other metadata, can be retrieved from GitHub via its publicly available rest API3
. The complete list of repositories in our sample is available online4
.
We create a single umbrella repository per project, com-prising the mainline and all its descendants. Once we have computed our metrics on the umbrella repositories of all projects in our GitHub sample, we are able to see if and how much our initial intuition is backed up by real data.
To get an overall bird–eye glimpse, we measure the dis-tribution of values for each of our ∗-ratio metrics, aggre-gating the data coming from all the various repositories in our GitHub sample. The 342 projects in the sample dif-fer from each other in any quantitative aspect (number of forks, branches, commits, authors, etc.) and the ratios pro-vide values already normalized in the interval [0..1].
3
See http://developer.github.com/.
4
See http://people.rennes.inria.fr/Benoit.Baudry/ sampe-github-projects/.
By aggregating values this way, we can have a general idea about the relative importance of each category of commits in the umbrella repositories of our GitHub sample.
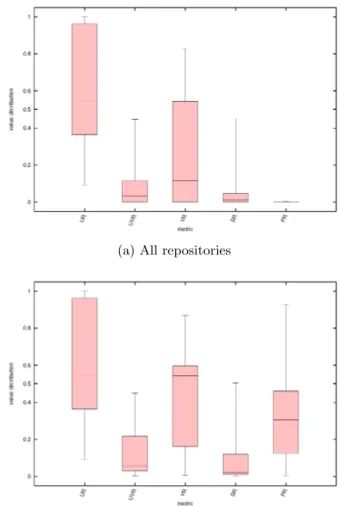
(a) All repositories
(b) Omitting repositories with no contribution
Figure 1: Distributions of commits per categories: aggregates on the whole GitHub sample.
Figure 1 shows boxplots for each metric. The boxes extend for the standard interquartile range, while the whiskers cover up to the 95% of the data points. We suppress the outliers, because they are so many, most of all in the upper range of the interval, that they would hinder the legibility of the plots.
Figure 1a shows the aggregates of the metrics over the whole sample. We see that commits shared among mainlines and some of their forks (vip and u–vip) may often represent a remarkable share of the iCommits. Another quite interest-ing fact: pervasive commits are globally much less present. Their ratio with respect to the total number of iCommits in their umbrella repositories is often close to 0. This fact may be due to two different facts: (i) forks are created but not kept up–to–date with respect to the mainline and the other forks; (ii) forks are created and then no new commit is added to their upstream repository (the one from which they have been forked). Clearly, to find out which case is the occurring one, one must analyze every umbrella repository in detail.
sample is that of unique commits. This fact, whose entail-ments would of course require a deeper investigation, shows that the amount of “original” development which stays out-side the mainline of a project is often quite large and thus not to be neglected. A similar consideration holds for scat-tered commits, which, although much less common, may in some case be fairly important (notice the long whisker of the sr boxplot). Intuitively, the uc and sc metrics may be useful to detect emergent diversity in a multi–repository project, since they can point out those forks which are con-tributing the most to the phenomenon.
As said, we have for all the distributions a large number of outliers. In order to see the variability of the values among the repositories which do have iCommits, we plot in Figure 1b the same dataset excluding the entries equals to 0.
Here we can see the fairly large variety of situations that exist “in the wild”. Most of all, it becomes evident that uniquecommits are extremely common in our sample. Their urboxplots in the two figures are actually identical, because less than 3% of the umbrella repositories in our sample have no unique commit (thus only outliers, not shown, would differ). Finally, we see that pervasive commits, although generally being a rare specimen, may represent, whenever they occur, a relevant portion of the iCommits of an um-brella repository.
While this is not a rigorous quantitative analysis of the “composition” of the various projects in our sample, it is
enough to positively answer our first research question:
R.Q. 1 — Are there commits related to a given project that are dispersed in forks other than the project mainline? Answer— As measured by our dispersion metrics, there are relevant amount of information disseminated among various forks of the same project, which cannot be captured by an-alyzing the mainline repository only.
In Section 5 we see how our classification proves to be useful in getting insights about the characteristics of the families of forks belonging to the same project.
5.
PEACOCK TAILS
The kind of analysis we propose deals with the fact that a software codebase may be scattered among different reposi-tories, which may be only partially synchronized with each others. All existing code and process metrics can be used in order to measure interesting properties of the single forks.
But our dispersion metrics can be used to give some pre-liminary insights about the composition of a family of forks, which can be useful to guide further analysis towards the more interesting ones. In order to ease the presentation and facilitate the legibility of the aggregates computed on each family of forks, some visualization tool can be used to pic-torially represent our outcomes and highlight some features. In the following we present selected pictographs, which represent the information obtained on our GitHub sam-ple, for some umbrella repositories. The pictures have been drawn with Circos5
. Given their shape and look, we nick-name them “peacock tails”. We underline that the graphic representation in itself is not a major concern of ours, but a simple yet very helpful way of presenting the data and spot-ting out some interesspot-ting features of diversely distributed
5
See http://circos.ca
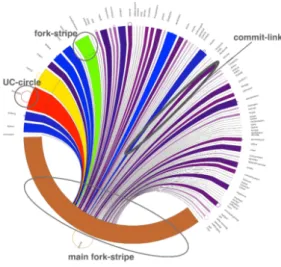
Figure 2: Peacock tail example with legend.
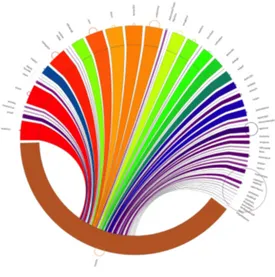
Figure 3: Peacock tail of the MailCore project.
software projects.
Each pictograph represents the mainline of a project with the subset of its forks having one or more iCommits. The largest stripe at the bottom is the mainline repository. Then the forks are sorted, clockwise from the left, according to their creation timestamp. They are shown as stripes, con-nected to the mainline by elongated commit–links. On the outskirt, centered at each fork stripe, the identifiers of the forks are reported.
The length of a fork stripe (but the mainline) is propor-tional to the amount of its iCommits, excluding unique com-mits. The color of each fork stripe and its commit–link is also correlated to its length: from grey and violet for smaller stripes, through blue and green for medium stripes, to or-ange and then red for larger ones. Thus, while the length of the stripes tells immediately which forks share more iCom-mits with the mainline, the color of the stripes is useful to quickly see which forks have a similar amount of iCommits. For each fork (including the mainline) unique commits are plotted as circles centered at their fork stripe. The
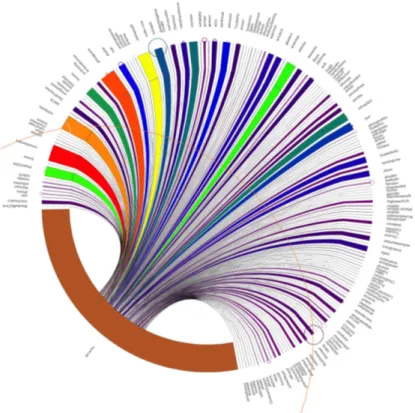
di-Figure 4: Peacock tail of the zamboni project.
ameter of these circles is thus proportional to the uc value of the fork, though not in the same scale of the length of the fork stripes. Figure 2 graphically explains the peacock tails’ characteristics.
Visualizing umbrella repositories as peacock tails allows us to observe different collaboration models. We give few examples in the following.
“Seabirds” collaboration model — In the seabird model, the amount of iCommits which link forks and mainline is bal-anced: several forks are equally involved in the distributed development. The MailCore project in Figure 3 is an exam-ple of that model.
The peacock visualization highlights the balance via the col-ors of the stripes and the commit–links: several of them have similar colors, indicating an equivalent amount of iCommits shared with the main fork.
“Goose” collaboration model— In the goose model, forks differ more from each other in their activity: some forks are heavily involved, while others very little. The zamboni project in Figure 4 is an example of that model.
The peacock visualization highlights the lack of balance: we can recognize four groups of commit–links, by grouping them according to their color, and a fairly large amount of forks with very few iCommits.
“Galapagos” Effect — The Galapagos model emphasizes the presence of some forks that have many unique commits. Our intuition is that this fact indicates a “speciation” inside a fork, probably one or several branches that are used to develop alternative solutions that are not shared with the other forks.
The pyromcs project in Figure 5 is an example in which the mainline has a very high uc value (the thin orange circle traversing the plot is actually the uc circle centered at the mainline).
An interesting feature highlighted by these pictographs is the relation between the amount of iCommits and the age of the fork. It is a common finding that older forks are the most contributing, but it is not always the case. The uc values, instead, do not show correlations with the age of the forks or their amount of iCommits.
This quick and intuitive look at multi–repository projects can be very helpful to study the composition of the various forks and for a preliminary screening, in order to identify interesting forks that are worth investigating.
We can thus positively answer to our second research ques-tion:
R.Q. 2 — Are there differences in the collaboration pat-terns of multi–repository projects which we can track by analyzing their distributed commit history?
Answer— The characterization of multi–repository projects based on our dispersion metrics reveals that collaboration patterns may differ significantly among projects. The visual analysis we briefly discuss here can help deciding the initial directions for a deeper investigation.
6.
THREATS TO VALIDITY
The toolset we use to compute our experimental outcomes has been developed by us and manually tested. It may con-tain unknown bugs which could affect the computation.
Our outcomes are obtained on a sample of GitHub projects which is small, with respect to the amount of existing repos-itories on GitHub. Thus, reported results may not general-ize. To mitigate as much as possible this threat, we selected projects according to a criterion which is, to the best of our knowledge, unrelated to any characterization of collabora-tion activities in multi–repository projects, as described in Section 4.
7.
CONCLUSION
The widespread adoption of decentralized versioning sys-tems and the advent of web–based aggregators have caused a substantial increment of multi–repository projects. These projects are characterized by the fact that their complete codebase is scattered among distinct and possibly unsyn-chronized repositories. Existing metrics are not able to fea-ture such a distributed development scenario.
This paper presents novel tools to tackle the analysis of projects, whose codebase is distributed among several forks on GitHub.
We describe a methodology to efficiently aggregate and analyze commit histories of GitHub forks related to the same project. We propose a classification of commits, which characterizes a distributed development process that is typ-ical of DVCSs. We define a set of novel metrics to quan-tify the degree of dispersion of the overall contributions in a multi–repository project. We finally report aggregate statis-tics, measured on a sample of thousands of GitHub reposi-tories, which show that our metrics shed some light on novel interesting aspects of the software development process in multi–repository projects.
Analogously to what has been found for branching strate-gies, the long term goal is to identify distributed develop-ment patterns which affect software quality. On a different track, we plan to exploit our metrics in order to devise a measure of emergent software diversity.
8.
ACKNOWLEDGMENTS
We want to thank Martin Monperrus for his nice advices and useful discussions.
This work is partially supported by the EU FP7-ICT-2011-9 No. 600654 DIVERSIFY project.
Figure 5: Peacock tail of the pyrocms project.
9.
REFERENCES
[1] J. Al Dallal and L. C. Briand. An object-oriented high-level design-based class cohesion metric. Inf. Softw. Technol., 52(12):1346–1361, Dec. 2010. [2] V. R. Basili, L. C. Briand, and W. L. Melo. A
validation of object-oriented design metrics as quality indicators. Software Engineering, IEEE Transactions on, 22(10):751–761, 1996.
[3] C. Bird, P. C. Rigby, E. T. Barr, D. J. Hamilton, D. M. German, and P. Devanbu. The promises and perils of mining git. In Mining Software Repositories, 2009. MSR’09. 6th IEEE International Working Conference on, pages 1–10. IEEE, 2009.
[4] G. Canfora, F. Garc´ıa, M. Piattini, F. Ruiz, and C. A. Visaggio. A family of experiments to validate metrics for software process models. J. Syst. Softw.,
77(2):113–129, Aug. 2005.
[5] L. Dabbish, C. Stuart, J. Tsay, and J. Herbsleb. Social coding in github: transparency and collaboration in an open software repository. In Proceedings of the ACM 2012 conference on Computer Supported Cooperative Work, pages 1277–1286. ACM, 2012.
[6] S. Demeyer, S. Ducasse, and O. Nierstrasz. Finding refactorings via change metrics. In ACM SIGPLAN Notices, volume 35/10, pages 166–177. ACM, 2000. [7] M. Genero, M. Piattini, E. Manso, and G. Cantone.
Building uml class diagram maintainability prediction models based on early metrics. In Software Metrics Symposium, 2003. Proceedings. Ninth International, pages 263–275, Sept 2003.
[8] J. Howison, M. Conklin, and K. Crowston. Flossmole: A collaborative repository for floss research data and
analyses. International Journal of Information Technology and Web Engineering, 1:17–26, 07/2006 2006.
[9] R. Moser, W. Pedrycz, and G. Succi. A comparative analysis of the efficiency of change metrics and static code attributes for defect prediction. In Software Engineering, 2008. ICSE’08. ACM/IEEE 30th International Conference on, pages 181–190. IEEE, 2008.
[10] D. Posnett, R. D’Souza, P. Devanbu, and V. Filkov. Dual ecological measures of focus in software
development. In Proceedings of the 2013 International Conference on Software Engineering, pages 452–461. IEEE Press, 2013.
[11] F. Rahman and P. Devanbu. Ownership, experience and defects: a fine-grained study of authorship. In Proceedings of the 33rd International Conference on Software Engineering, pages 491–500. ACM, 2011. [12] C. Rodriguez-Bustos and J. Aponte. How distributed
version control systems impact open source software projects. In Mining Software Repositories (MSR), 2012 9th IEEE Working Conference on, pages 36–39. IEEE, 2012.
[13] E. Shihab, C. Bird, and T. Zimmermann. The effect of branching strategies on software quality. In
Proceedings of the ACM-IEEE international symposium on Empirical software engineering and measurement, pages 301–310. ACM, 2012.
[14] F. Thung, T. Bissyande, D. Lo, and L. Jiang. Network structure of social coding in github. In Software Maintenance and Reengineering (CSMR), 2013 17th European Conference on, pages 323–326, March 2013.