T
HE EFFECTS OF
H
URRICANE
S
ANDY MEASURED IN THE
L
AURENTIAN
FOOTHILLS OF
Q
UEBEC
(C
ANADA
)
WITH A MOBILE WEATHER STATION
By
1*Dennis W. Hallema, Ph.D. 1Alain N. Rousseau, Ph.D. ing.
2Alain Paquette, Ph.D. 3Silvio-José Gumiere, Ph.D.
1Centre Eau Terre et Environnement
Institut national de la recherche scientifique (INRS-ETE) 490, rue de la Couronne
Québec (QC) G1K 9A9
2Center for Forest Research, Université du Québec à
Montréal (UQAM), PO Box 8888, Centre-Ville Station, Montreal, QC H3C 3P8, Canada
3Université Laval, Département des Sols et de
Génie Agroalimentaire, 2480 boulevard Hochelaga, Quebec City, QC G1V 0A6, Canada
© 2013, INRS-Eau, Terre et Environnement
CORRECT CITATION FOR THIS REFERENCE :
Hallema, D.W., A.N. Rousseau, A. Paquette and S.-J. Gumiere (2013). The effects of Hurricane Sandy measured in the Laurentian foothills of Quebec (Canada) with a mobile weather station. Rapport interne No 1349, INRS-ETE, Québec (Qc) : x, 13 p.
T
ABLE OF CONTENT
1. Introduction ... 1
2. The weather station ... 3
2.1 Temperature and solar irradiance ... 3
2.2 Precipitations and atmospheric pressure ... 5
2.3 Wind ... 6
L
IST OF FIGURES
Figure 1 : Location of the St.Paulin weather station (Quebec, Canada) and the storm path of Hurricane Sandy from October 26 to October 30, 2012. ... 2 Figure 2 : The mobile weather station. ... 3 Figure 3 : Evolution of 15-minute averaged wind speed at St.Paulin during Hurricane
Sandy (a) and during the same period a year before (b). ... 4 Figure 4 : Temperatures at St.Paulin were relatively high during the Hurricane Sandy, but
declined rapidly during the following days (dashed lines mark the post-tropical phase of Sandy between landfall and dissipation). ... 5 Figure 5 : Photosynthetically active radiation (PAR) observed at St.Paulin was low during
Hurricane Sandy due to a thick cloud cover (dashed lines mark the post-tropical phase of Sandy). ... 5 Figure 6 : Precipitation at St.Paulin during Hurricane Sandy was very sparse (dashed lines
mark the post-tropical phase of Sandy). ... 5 Figure 7 : Atmospheric pressure at St.Paulin during Hurricane Sandy (dashed lines mark
the posttropical phase of Sandy is marked). ... 6 Figure 8 : Evolution of 15-minute averaged wind speed (a) and maximum wind gust speed
(b) at St.Paulin. ... 7 Figure 9 : Wind rose with the 15-minute averaged wind speed and wind direction at
St.Paulin during Hurricane Sandy (a) and the same period a year earlier (b). ... 9 Figure 10 : Wind rose with a more detailed time record of wind speed and direction at
St.Paulin during Hurricane Sandy (the plotted period is October 29 to October 31, 2012). ... 10
1. Introduction
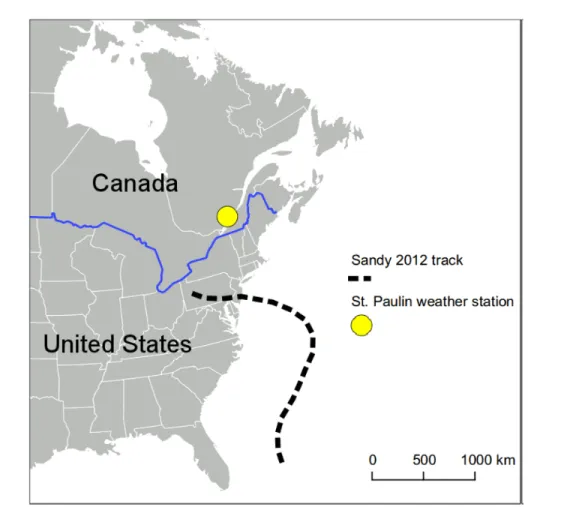
Quebec City, November 9, 2012 — Hurricane Sandy is known as the largest Atlantic hurricane on record. Having developed into a category 2 hurricane before hitting Cuba on October 25, Sandy moved through the Bahamas and made landfall near Atlantic City, NJ as a post-tropical cyclone on October 29, two days before Halloween. Due to the expected combination of the tropical system and storm front, Sandy was referred to by some media as “Frankenstorm.” The effects were devastating. Leaving behind it a trace of unimaginable destruction, damage estimates range between $20- 50 billion depending on whether losses from business interruption are included in the estimate. Now that the storm has cleared we also hear stories of miraculous survival, the most remarkable of which is perhaps the story of the New York Aquarium on Coney Island (Brooklyn) reported by the New York Times (November 7, 2012). The floodwaters knocked out the electrical system that filters the water in the basins and regulates the temperature, as well as the emergency generators that were supposed to serve as power backup. Despite 3-5 m water in the basement, the collection of 12,000 fish and marine mammals managed to make it through the days that followed suffering apart from the material damage only the loss of 150 koi carp, which are freshwater fish. As for the province of Quebec, some 49,000 homes and businesses lost power overnight on October 29 (CTV Montreal, October 30, 2012). The pending arrival of superstorm Sandy in Quebec raised the question whether our mobile weather station in the hills north of Trois-Rivières (see Figure 1) would be able to detect any of the meteorological anomalies on our side of the border.
The effects of Hurricane Sandy measured in the Laurentian foothills of Quebec (Canada) with a mobile weather station
2
Figure 1 : Location of the St.Paulin weather station (Quebec, Canada) and the storm path of Hurricane Sandy from October 26 to October 30, 2012.
2. The weather station
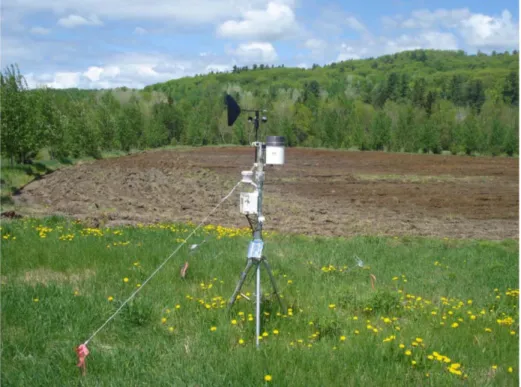
A mobile weather station (Figure 2) was operational in the Mauricie region of the Quebec province from April-November of the years 2011 and 2012, and the data it collected are used within the framework of PACC-26 (Climate Change Action Plan) funded by Ouranos and ICAR. The weather station was mounted at 142 m altitude in the Laurentian foothills north of St.Paulin, at the transition of the St. Lawrence Lowlands to the Canadian Shield (coordinates 46°27’10"N, 72°59’34"W). It carried sensors for wind speed and direction, precipitation, relative humidity, air temperature, atmospheric pressure and photosynthetically active radiation (PAR).
Figure 2 : The mobile weather station.
2.1 Temperature and solar irradiance
Daily high temperatures were around 18 °C on October 26, 2012, which is still warm for the time of the year (cf. 9 °C for the same date in 2011). Under the influence of a persisting North-northeastern wind that continued to bring in clouds, temperatures dropped rapidly after the storm had weakened during November 1. The cloudiness of the event can be inferred from Figure 5,
The effects of Hurricane Sandy measured in the Laurentian foothills of Quebec (Canada) with a mobile weather station
4
week preceding the storm of October 29, diurnal sequence). Temperatures seem to follow a different pattern in 2012: the first night frost after the summer was measured on September 20, whereas a year earlier there was no night frost until October 5.
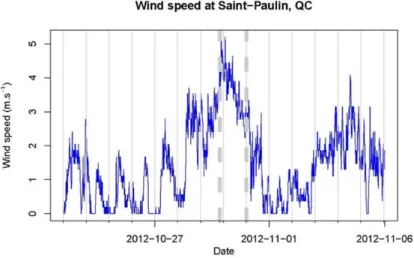
Figure 3 : Evolution of 15-minute averaged wind speed at St.Paulin during Hurricane Sandy (a) and during the same period a year before (b).
Chapitre 2 –The weather station
Figure 4 : Temperatures at St.Paulin were relatively high during the Hurricane Sandy, but declined rapidly during the following days (dashed lines mark
the post-tropical phase of Sandy between landfall and dissipation).
Figure 5 : Photosynthetically active radiation (PAR) observed at St.Paulin was low during Hurricane Sandy due to a thick cloud cover (dashed lines mark
the post-tropical phase of Sandy).
2.2 Precipitations and atmospheric pressure
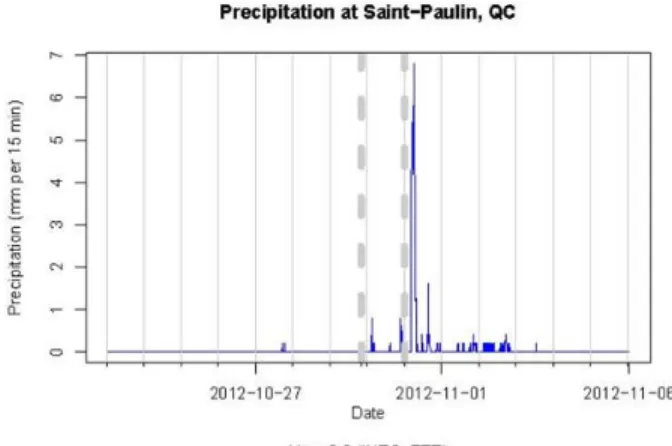
Throughout the event of Hurricane Sandy, precipitation was very sparse with only a few drops of rain on October 30 and a 68 mm shower on the next day between 4:30AM to 7:30 AM, starting 29 hours after landfall (Figure 6). A nearby weather station in Charette (coordinates 46°26’29"N, 72°53’32"W) detected a different pattern: 14.6 mm of rain on October 30 and less than 4 mm on October 31 (MDDEP, 2012). The difference in rainfall observations can be explained by the hills north of St.Paulin that push the air up, given that the Charette weather station was closer than 8 km from the St.Paulin weather station and at approximately the same altitude (26 m lower).
post-The effects of Hurricane Sandy measured in the Laurentian foothills of Quebec (Canada) with a mobile weather station
6
Starting out with a high pressure system over Eastern Canada before the arrival of Sandy, the pressure drops below 1000 mbar on October 29 around 1:00AM and continues to decrease until it reaches 979.6 mbar on October 31 at 2:45PM (Figure 7). The atmospheric pressure subsequently hovers between 980-983 mbar until 5PM the following day. Normal atmospheric pressure was reached again on November 6, one week after Hurricane Sandy made landfall. The trend in atmospheric pressure observed at St.Paulin can be associated with Sandy’s low pressure system. Aircraft data showed that on October 29 around 11AM the central pressure of Hurricane Sandy, 800 km south of St.Paulin, had fallen to a mere 943 mbar (National Hurricane Center, 2012a), which is the lowest ever recorded for an Atlantic storm at these latitudes.
Figure 7 : Atmospheric pressure at St.Paulin during Hurricane Sandy (dashed lines mark the posttropical phase of Sandy is marked).
2.3 Wind
Figure 3 shows the evolution of the 15-minute average wind speed for the two-week period between October 23 and November 6, 2012 (a) and for the same period in 2011 (b). The former period includes the passage of Hurricane Sandy as it entered the New Jersey shoreline as a post-tropical storm in the late evening of October 29, 2012, around 8 PM local time. At this point the wind field developed an unprecedented diameter of 1,800 km (National Hurricane Center, 2012a) before it dissipated over Pennsylvania on October 31, and pursued its course as a remnant trough in the direction of the St. Lawrence Lowlands of Ontario.
Average wind speeds in this area were rather low for both the 2011 and 2012 periods between October 23 and November 6 (less than 1.5 m.s−1), but for the late evening of October 29, 2012
Chapitre 2 –The weather station
we observed a gradual increase in wind speed to a 15-minute average of 5.2 m.s−1 (or 19
km.h−1) at 9:30 PM, followed by a slight decline in wind speed and a second peak of 5.2 m.s−1
around 1:45AM (Figure 8a and b).
Figure 8 : Evolution of 15-minute averaged wind speed (a) and maximum wind gust speed (b) at St.Paulin.
The fastest wind was 13.2 m.s−1 (or 47 km.h−1), measured around 10:30PM on October 29,
which is very modest compared to the 150 km.h−1 winds measured in New Jersey when Sandy
moved ashore (National Hurricane Center, 2012c), and a mild breeze compared to the 175 km.h−1 gusts recorded off Cuba four days earlier on October 25 (National Hurricane Center,
2012b). The strongest wind recorded in St.Paulin during springtime was already 17 m.s−1
The effects of Hurricane Sandy measured in the Laurentian foothills of Quebec (Canada) with a mobile weather station
8
year before between October 23 and November 6, 2011 was 11.9 m.s−1 (60 km.h−1), which
corresponds with autumn normals.
Although wind speed was not higher than usual for this time of the year, we can note that the increase in wind speed at St.Paulin coincides with the development of Hurricane Sandy in the northeastern United States. Unlike most hurricanes that revolve around a central area of warm air, the high pressure system above Eastern Canada was pumping colder, drier air into Sandy, resulting in very strong winds locally and affecting the storm path over land. The strongest gusts were recorded about one hour before Sandy moved ashore, after which the wind speed decreased to normal values some 12 hours later. The two distinct peaks in 15-minute averaged wind speed (around 9:30PM and at 1:45AM) also confirm that our storm hit a maximum intensity shortly before Sandy moved ashore and reintensified four hours later, and from this we can deduce that what we have measured at St.Paulin is in fact the storm front moving in from the Atlantic.
In order to identify a link with the wind direction of the storm we plotted wind rose charts for the same periods that we analyzed above, namely October 23 to November 6, 2012 and October 23 to November 6, 2011 (Figures 9a and b, respectively).
Chapitre 2 –The weather station
Figure 9 : Wind rose with the 15-minute averaged wind speed and wind direction at St.Paulin during Hurricane Sandy (a) and the same period a year earlier (b).
In the week preceding the arrival of Hurricane Sandy, wind direction was mostly Northwest to East-northeast. This wind direction is quite similar to what was observed for the entire month of October, but still different from the same period in 2011, when wind alternately came from the North (cold winds coming from the Canadian Shield) and South-southwest (relatively warm air from the Great Lakes and St. Lawrence Valley). During Hurricane Sandy the wind comes from
The effects of Hurricane Sandy measured in the Laurentian foothills of Quebec (Canada) with a mobile weather station
10
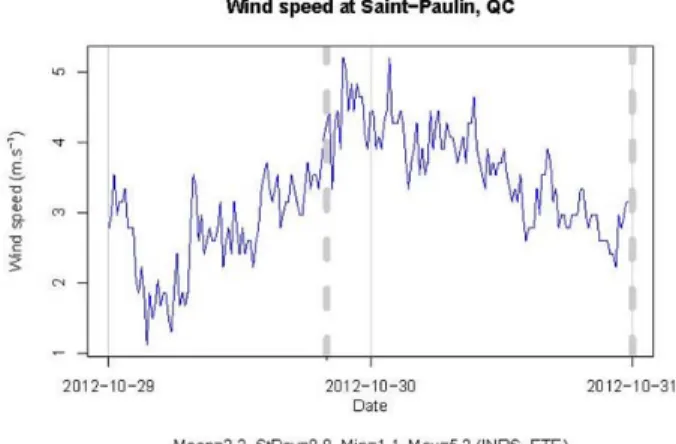
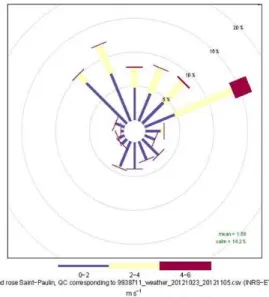
Figure 10 : Wind rose with a more detailed time record of wind speed and direction at St.Paulin during Hurricane Sandy (the plotted period is October 29 to October 31, 2012).
Variations in wind speed are very small compared to other days, with gusts stronger than 6
m.s−1 for nearly 75% of the time (Figure 10b). The wind direction measured at St.Paulin agrees
with the anti-clockwise rotation of the superstorm of which the center of rotation lies south of Quebec throughout the entire storm event.
Chapitre 2 –The weather station
Although the station was located 800 km north of the coastal area in which Hurricane Sandy caused most damage, the size of its wind field was large enough to produce trends in our meteorological data.
3. References
CTV Montreal, 2012. Power being restored in Quebec in Sandy’s wake. CTV Montreal, October 30, 2012, available: http://montreal.ctvnews.ca/ power-being-restored-in-quebec-in-sandy-s-wake-1. 1016479 (accessed November 9, 2012).
Foderaro, L. W., 2012. Hurricane filled New York Aquarium with dangerous substance: Water. The New York Times, November 7, 2012, available: http: //www.nytimes.com/2012/11/08/nyregion/ hurricane-filled-new-york-aquarium-with-dangerous-substance-html?ref=nyregion (accessed November 9, 2012).
National Hurricane Center, 2012a. Hurricane Sandy Discussion Number 29. S. Stewart, October 29, 2012, available: http://www.nhc.noaa.gov/ archive/2012/al18/al182012.discus.029. shtml? (accessed November 9, 2012).
National Hurricane Center, 2012b. Hurricane Sandy Tropical Cyclone Update. S. Stewart, October 25, 2012, available: http://www.nhc.noaa. gov/archive/2012/al18/al182012.update. 10250441.shtml (accessed November 9, 2012).
National Hurricane Center, 2012c. Post-tropical Cyclone Sandy Forecast/advisory Number 31. Brown, October 30, 2012, available: http://www.nhc.noaa.gov/archive/2012/ al18/al182012.fstadv.031.shtml (accessed November 9, 2012).