Linking Sediments Dredged from the Saint
John Harbour, New Brunswick, and
Hydrometeorological Variables
Linking Sediments Dredged from the Saint John Harbour, New
Brunswick, and Hydrometeorological Variables
Hélène Higgins
1André St-Hilaire
1Katy A. Haralampides
2Simon C. Courtenay
31
INRS Eau, Terre et Environnement, Québec, QC
2
Department of Civil Engineering, University of New Brunswick, Fredericton, NB
3
Fisheries and Oceans Canada at the Canadian Rivers Institute
Biology Department, University of New Brunswick, Fredericton, NB
Research report No R-1274
© INRS-ETE, 2011
Correct citation for this publication:
Higgins, H., St-Hilaire, A., Haralampides, K.A. et Courtenay, S.C. Linking sediments
dredged from the Saint John Harbour, New Brunswick, and hydrometeorological variables, (INRS - Centre Eau Terre Environnement, rapport de recherche; 1274) Québec: INRS - Centre Eau Terre Environnement., xii, 8 pages.
v
TABLE OF CONTENTS
List of figures vii
List of tables ix
Résumé en français xi
1. INTRODUCTION 1
2. DATA & METHODS 2
2.1 Estimation of sediment volumes and loads 2
2.2 Analysis 2
2.3 Data 3
3. RESULTS 4
4. DISCUSSION 6
vii
LIST OF FIGURES
Figure 1 Comparison of dredging volumes values provided by SJPA and obtained by the regression. Error bars are ± RMSE... 5
ix
LIST OF TABLES
Table 1 Sediment and hydro-meteorological data used in the analysis ... 3 Table 2 Coefficients of determination (r2)among all dredging volumes and hydro-meteorological variables ... 4 Table 3 Coefficients and statistics of the regression ... 4
xi
Résumé en français
Les volumes de sédiments dragués dans l’estuaire du fleuve Saint-Jean, où se trouve le port de Saint John, sont très variables d’une année à l’autre. Puisqu’il n’a pas été possible jusqu’à présent d’en prédire la variation à l’aide de modèles de transport de sédiments provenant de la Baie de Fundy ou du fleuve Saint Jean, l’utilisation de variables hydrométéorologiques locales pour expliquer cette variation a été tentée. Des corrélations de Pearson ont d’abord été développées entre les volumes de sédiments dragués et d’autres variables annuelles pour les années hydrologiques 2003-2004 à 2008-2009: le niveau d’eau moyen, le niveau d’eau maximum, le débit moyen, le débit maximum, le volume d’eau total annuel, la pluie, la neige et la précipitation totale. La période de récurrence du volume d’eau total annuel (débits cumulés), calculée à l’aide d’une analyse fréquentielle, a également été utilisée, ainsi qu’une estimation des charges sédimentaires provenant de la rivière Kennebecasis. Ces dernières ont été obtenues à l’aide d’un réseau de neurones artificiels (RNA) développé pour ce tributaire du fleuve. Pour pallier au petit nombre de données (6), la méthode jackknife a été utilisée pour estimer l’erreur du modèle. Bien qu’il soit prématuré d’utiliser cette régression comme telle pour le moment, les résultats sont prometteurs (r2 = 0,83) et suggèrent que cette analyse devrait être approfondie en allongeant la série de données disponibles.
1
1. Introduction
Dredging is required annually in the Saint John Harbour, NB. However, the amounts dredged are variable from one year to the next, without the Saint John Port Authorities (SJPA) being able to detect why and predict dredging needs accordingly. Preliminary studies of suspended sediments on the main SJR branch, using turbidity as a surrogate, were undertaken during the fall 2008 and from May 22nd to November 27th 2009. It was not possible to obtain winter or freshet measurements during these years of monitoring. The lack of long-term sediment data on the SJR complicates the study of inter-annual suspended sediments variation. Fortunately, such long-term sediment data exist on the Kennebecasis River (KR), a major tributary located near the mouth of the SJR. Results from investigations on that river could give an insight as to processes also occurring at the whole SJR watershed scale.
In the 1990’s, Bray and Xie (1993) defined regressions to estimate long-term and inter-annual yields in ungauged Atlantic watersheds, based on physical characteristics of the regions. However, inter-annual variation was solely dependent on mean annual discharge. Long-term sediment record from the KR was also used to estimate sediment loads and identify hydro-meteorological variables that can explain SSC variability with rating curves (Hansen and Bray 1993) and an artificial neural network (ANN; Higgins et al, 2011). Results of the latter showed that while the developed ANN is not able to adequately represent SSC peaks, annual loads are satisfactorily estimated. In addition, it was suggested that modelling sediment yields might be feasible in the SJR using hydro-meteorological variables, though the task would be complicated by anthropogenic and ice effects.
The above-mentioned results have not been used yet to try understanding the inter-annual variability of the sediment loads, or extrapolating the results to the whole lower SJR. These steps would be necessary in order to investigate the relationship between SJR sediment loads and dredging volumes from the port.
The present study aims at investigating relationships between dredging in the harbour, hydro-meteorological variables, and sediment loads from the Kennebecasis River.
Linking Sediments Dredged from the Saint John Harbour, New Brunswick, and Hydrometeorological Variables
2
2. Data & Methods
2.1 Estimation of sediment volumes and loads
Estimates of sediment volumes dredged from the harbour every year were obtained from the Saint John Port Authorities for the summers 2004 to 2009. Estimates of sediment loads for the main branch of the Saint John River were not available; however, the artificial neural network (ANN) developed for the Kennebecasis River was used to verify whether loads coming from that tributary are related to dredging in the harbour. A value for the year 2008-2009 was not available for lack of associated Q data on the Kennebecasis.
Hydro-meteorological data
Water levels were obtained from station 01AP005 in Saint John. Water discharge (Q) is not measured at this station by the Water Survey of Canada (WSC) hence the ratio area method was used with station 01AF002 in Grand Falls with the following equation:
Q01AP005 = 2.51Q01AF002 (1)
Where 2.51 is the ration of the SJR watershed drained at Saint John over the area drained at station 01AF002. A visual inspection of both Q and water level data sets confirms peaks and lows coincide, and are correlated with a r2 of 0.74 (p<0.0001). Due to technical problems with WSC monitoring stations, no flow data was available at the Grand Falls station for the first 4 months of 2009. The Q values were estimated for that period using an exponential fit with 80 years of daily levels from the station at Fredericton (01AK003; r2=0.83, p<0.01). Since the month of April, typically part of the snowmelt, was included in this period, and because extreme values tend to have the greatest errors associated to them, the Q values from 2009 will be used with caution.
Precipitation data were obtained from Environment Canada Weather Office for Saint John (station 8104900).
2.2
Analysis
Correlation analysis was used to detect relationships among variables. A multiple linear regression was subsequently built, using the variables with the strongest correlation coefficients. Due to the small number of years in the data set, a jackknife procedure was used to estimate the error of the model. With this technique, the regression model is repeatedly built leaving one different data point out every time. The value of the left out point is then estimated each time, and the error and bias are estimated from these estimated values. It allows a better estimation of the error when only very few data points are available in a regression.
To help assessing whether years with extreme annual water yields could be linked with higher dredged volumes, a frequency analysis was performed on that hydrological variable. In summary, a frequency analysis allows characterizing data in a probabilistic context by estimating their return periods (average number of years between two extremes of same
Chapter 2, Data & Methods
3
amplitude). This is a widely-used method described in many textbooks (e.g. Rao and Hamed 2001). It allows relating the magnitude of events to their frequency of occurrence through the use of probability distributions.
The HYFRAN software1 was used along with 78 years of annual water yields (in million cubic meters per year) from the monitoring station at Grand Falls (01AF002) to verify whether wet years caused high dredged volumes. A more detailed application of the HYFRAN software can be found in Tramblay et al. (2008).
2.3
Data
It can be hypothesized that sediments dredged from the harbour in any one year accumulated due to transport occurring since the last dredging. Because dredging typically occurs from the month of July to November, using hydro-meteorological data from the hydrological year (Oct-Sept) seemed more appropriate than the calendar year. This implies that sediments flowing from the river to the harbour during the dredging season, which coincides approximately with the end of the hydrological year, is taken into account in that same season. This seems realistic, since dredging operations are carried out in different phases over one summer. A first survey of the bathymetry is made approximately in June to estimate the dredging needs; then dredging operations are undertaken, followed by another bathymetry survey, then more dredging as needed, and finally a post-dredging survey. Sediments can thus accumulate between the first and second dredging. Hence the data used in the analysis is presented in that format (for example, from October 2003 to September 2004), and the expression “annual” used in this report refers to a hydrological year.
Table 1 Sediment and hydro-meteorological data used in the analysis
Sediment Hydro-meteo Data
year ANN Dredged volumes Mean Level Max Level
Qmean Qmax Qtot Rain Snow Precip. TQ
(T) (m3) (m) (m) (m3s-1) (m3s-1) (m3 x106) (mm) (cm) (mm) (years) 2003-04 53298 146065 1.654 2.919 1398 7007 41399 941.5 204.7 1121.7 1.43 2004-05 72393 165660 1.481 4.738 1024 11377 37805 989.6 206.5 1157.5 5 2005-06 59544 375880 1.966 3.280 1667 7183 47133 1263.8 100.7 1359.7 50 2006-07 39999 116225 1.582 3.298 1226 8062 35576 1086.2 165.2 1249.6 1.3 2007-08 54633 271958 1.641 5.076 1350 16199 48500 1136.5 295.6 1432.1 75 2008-09 N/A 207384 1.776 4.080 1001* 9694* 42578* 1447 296 1748 10 *Contains an estimation of the values for Jan-April 2009, as described in section 2.1
4
3. Results
The correlation matrix (Pearson r2) between all variables is presented in Table 2. The best relationships occurred when using data belonging to the same hydrological year, with no lag; for example, the total annual water yield and sediment volumes both from 2004-2005. The volumes of sediments dredged from the port are correlated with mean water level (r2=0.63) and total water yield (r2=0.73). No relationship was detected between dredged volumes in the harbour and annual sediment load from the KR estimated with the ANN, either from the same year or the year before. A multiple linear regression was created using mean level and total water yield. The resulting parameters and statistics are found in Table 3.
Table 2 Coefficients of determination (r2)among all dredging volumes and hydro-meteorological variables Dredge volumes ANN Mean Level Max
Level Qmean Qmax Qtot Rain Snow Precipitation TQ
Dredge vol. 1.00 ANN 0.08 1.00 Mean Level 0.63 0.00 1.00 Max Level 0.02 0.24 0.15 1.00 Qmean 0.42 0.05 0.40 0.21 1.00 Qmax 0.02 0.06 0.13 0.87 0.07 1.00 Qtot 0.73 0.03 0.41 0.06 0.33 0.15 1.00 Rain 0.24 0.01 0.45 0.01 0.01 0.00 0.16 1.00 Snow 0.05 0.00 0.11 0.41 0.37 0.47 0.03 0.05 1.00 Precipitation 0.12 0.03 0.23 0.08 0.07 0.06 0.17 0.89 0.29 1.00 TQ 0.64 0.01 0.17 0.20 0.29 0.37 0.78 0.06 0.02 0.08 1.00
Note: Bold values are significant with p<0.1
Table 3 Coefficients and statistics of the regression
Parameter
Value
Intercept
-654674
Mean level
237279
Qtot
11.12
Statistic
RMSE
77309 T
RRMSE
0.34
Bias
18620 T
R square
0.83
F statistic
7.43
P value
0.07
Chapter 3, Results
5
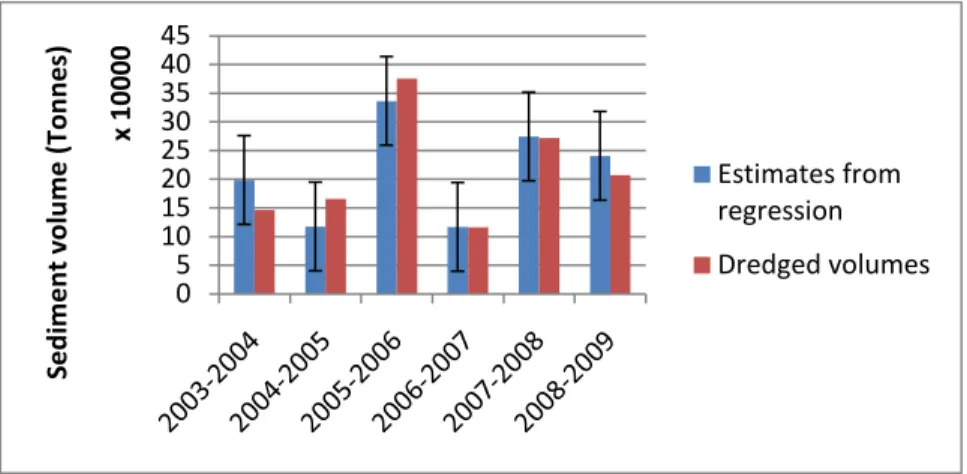
Due to the small data set, the regression could not be tested with values not used to create the model, but the jackknife technique used allows a better estimate of the error (RMSE) and bias. Annual estimates of dredging volumes obtained from the jackknife procedure are compared to the values provided by the SJPA in Figure 1. The model successfully predict an appropriate range of values encompassing the observed one, although the error (RMSE=77309 T) can be large compared to some of the values estimated (i.e. 2006-2007). Overall, the error is acceptable with a relative root-mean-squared error (RRMSE) of 34%. The regression, using all years, yield estimates deviating on average 15.4% from the real value.
Figure 1 Comparison of dredging volumes values provided by SJPA and obtained by the regression. Error bars are ± RMSE
0 5 10 15 20 25 30 35 40 45 Se d im e n t vo lu m e ( To n n e s) x 1000 0 Estimates from regression Dredged volumes
6
4. Discussion
The regression presented here was built from very few data points and should hence be applied to other years with caution. Longer-term dredging data in the harbour would be necessary to verify its accuracy. However, the strong relationships detected between the dredging in the harbour and hydro-meteorological variables from the Saint John River (SJR) watershed, especially total water yield and mean water level, are encouraging. In addition, a strong correlation was also detected between the dredged volumes and rain for the years 2004-2008. For some reason, this relationship significantly decreased in 2009, but should definitely be kept in mind for future analysis.
It is likely that a simple model could be built, with additional data, to allow an approximate prediction of dredging requirements. However, long-term prediction will not be possible as long as the model requires hydro-meteorological data from the year of interest. In addition, results will always be dependent on the availability of input hydro-meteorological data, mainly from Environment Canada. Years with missing or unreliable data can make an estimate difficult. The lack of relationship between the estimated sediment loads in the Kennebecasis River (KR) and dredged sediments from the harbour could be related to the fact that loads were calculated for a hydrological station located in the middle portion of the watershed. This upstream location, with a drainage area of 1100 km2, might be too small to represent accumulated effects at the SJR scale. In addition, it is known that the morphology of the Kennebecasis Bay, which is much deeper than the SJR itself and experiences little freshwater flux, (Haigh and Clarke, Online) is favourable to sediment accumulation, which are likely not being discharged to the main river during normal hydrological events.
As hinted by previous analysis of sediment loads on the KR, the annual load is much influenced by transport throughout the year, not only by one important event such as the spring freshet, as is observed in many other river systems. While it might still be the case that most transport occurs during a few events, these might not be particularly high-magnitude events, and can thus go unnoticed without a closer look at the hydrograph. The result can be an unforeseen volume of sediments to remove from the harbour, especially when high amounts are expected only as a result of major flooding events.
As such, the general idea expressed by the SJPA that dredging volumes should be related to the magnitude of the previous spring flood does not seem to hold true, according to the limited data set analysed in this project. Rather, it seems that total water yield is the single most important parameter to take into account, followed by mean water level. For instance, the hydrological year 2005-2006, for which dredging volumes were especially high, did not have an extreme freshet. However, three other unusually high peaks for their respective season occurred in the previous fall and in mid-January. This was reflected in the total annual water yield, with a high value that had not been observed since 1983. It should be noted that precipitation was the second most important parameter, until data from the 2009 dredging campaign was included in the analysis. While a higher water yield was observed in 2007-2008, lower rain occurred that year. In addition, almost twice as much snow fell in Saint John in 2007-2008, likely protecting the ground from erosion for a longer period. While snowfall was not identified as a major variable in the present regression, it should be considered in future models.
Chapter 4, Discussion
7
Using degree-days in the spring could, for instance, give an idea of the timing and speed of snowmelt. As long as the dataset will remain as small as it is, the explanatory variables are likely to change every time a new year is added.
It has been acknowledged before that the timing of different processes affecting sediment transport plays a major role in the magnitude of annual loads. For instance, for similar total water yield between two years, Oeurng et al (2010) observed a 470% increase in sediment load in the second year, partially due to the timing of large floods and tilling activities in the fall of that year. This indicates that hydro-meteorological variables alone might not be sufficient to investigate inter-annual variation in sediment transport, and that anthropogenic influences should ideally be somehow taken into account. Yet, the results obtained in the present study seem to indicate an appropriate predictive model could be eventually developed for the SJPA using simple, easy-to-access hydro-meteorological variables. Finally, the results presented here should be examined in the context of the studies done in parallel in the estuary and the Bay of Fundy, looking at the impact of tides and currents on sediment deposition and accumulation.
8
5. References
Bray, D. I. and Xie, H. 1993. A regression method for estimating suspended sediment yields for ungauged watersheds in Atlantic Canada. Canadian Journal of Civil Engineering, 20:82-87.
Haigh, S. and Clarke, J. H. [Online] Numerical Modelling of Kennebecasis Bay. Ocean Mapping Group, UNB. Accessed from http://www.omg.unb.ca/people/haigh/kenneb.html on August 10th, 2010
Hansen, D. and Bray, D. I. 1993. Single-station estimates of suspended sediment loads using sediment rating curves. Canadian Journal of Civil Engineering, 20:133-143.
Higgins, H., A. St-Hilaire, S.C. Courtenay & K.A. Haralampides. 2011. Suspended
sediment dynamics in a tributary of the Saint John River, New Brunswick. Canadian Journal of Civil Engineering, 38(2):221-232.
Oeurng, C., Sauvage, S. and Sanchez-Perez, J.-M. 2010. Dynamics of suspended sediment transport and yield in a large agricultural catchment, southwest France. Earth Surface Processes and Lanforms 35(11):1289-130