arXiv:0803.3176v1 [astro-ph] 21 Mar 2008
Astronomy & Astrophysicsmanuscript no. 9491 c ESO 2008
March 21, 2008
A binary signature in the non-thermal radio-emitter Cyg OB2 #9
⋆
(Research Note)
Ya¨el Naz´e
1,⋆⋆, Micha¨el De Becker
1,⋆⋆, Gregor Rauw
1,⋆⋆⋆, and Cesare Barbieri
21 Institut d’Astrophysique et de G´eophysique, Universit´e de Li`ege, All´ee du 6 Aoˆut 17 Bat. B5C, B4000-Li`ege, Belgium e-mail: naze@astro.ulg.ac.be
2 Dipartimento di Astronomia, Universit´a degli studi di Padova, vicolo Osservatorio 2, I35122-Padova, Italy Received January 31, 2008; accepted March 17, 2008
ABSTRACT
Aims.Non-thermal radio emission associated with massive stars is believed to arise from a wind-wind collision in a binary system. However, the evidence of binarity is still lacking in some cases, notably Cyg OB2 #9.
Methods.For several years, we have been monitoring this heavily-reddened star from various observatories. This campaign allowed us to probe variations both on short and long timescales and constitutes the first in-depth study of the visible spectrum of this object. Results.Our observations provide the very first direct evidence of a companion in Cyg OB2 #9, confirming the theoretical wind-wind collision scenario. These data suggest a highly eccentric orbit with a period of a few years, compatible with the 2yr-timescale measured in the radio range. In addition, the signature of the wind-wind collision is very likely reflected in the behaviour of some emission lines.
Key words.binaries: spectroscopic – stars: early-type – stars: individual: Cyg OB2 #9
1. Introduction
The Cyg OB2 association constitutes one of the richest OB asso-ciations of our Galaxy. Using 2MASS data, Kn ¨odlseder (2000) estimated that it contains nearly 3000 hot stars, among them more than a hundred O-type stars. This cluster is therefore an ideal target for investigations of the massive star population. However, because of their high reddening, the nature of the main stars of Cyg OB2 only begins to be uncovered.
Among the most prominent O-type stars of Cyg OB2, there are three objects that are known to be non-thermal radio emit-ters: Cyg OB2 #5, #8a, and #9. Such non-thermal radio emis-sion is believed to arise from synchrotron radiation, proba-bly produced by relativistic electrons accelerated through the first order Fermi mechanism in a hydrodynamic shock (see e.g. Pittard & Dougherty, 2006, for a recent quantitative model). For massive stars, the requested shock could either form following instabilities intrinsic to the line-driven stellar wind of a single massive star or be a consequence of the collision of two stellar winds in a massive binary. Theoretical considerations support only the latter interpretation (van Loo et al., 2005), but obser-vational evidence was still lacking until recently. Thanks to a dedicated monitoring, the signature of a companion was finally unveiled in the non-thermal emitters Cyg OB2 #8a and 9 Sgr (see De Becker et al., 2004; Rauw et al., 2005a, for a review see also De Becker 2007).
However, Cyg OB2 #9 (=VI Cyg 9, Schulte 9, [MT91] 431) remained one of the most challenging objects in this respect. On the one hand, Pigulski & Kołaczkowski (1998) reported some
Send offprint requests to: Y. Naz´e
⋆ Based on observations obtained at the OHP and the Asiago
obser-vatory.
⋆⋆ Postdoctoral Researcher FRS/FNRS ⋆⋆⋆ Research Associate FRS/FNRS
short-term (a few days), low amplitude (∆I=0.03mag) varia-tions, of unknown origin, in the photometry of Cyg OB2 #9. On the other hand, the X-ray spectrum of this object is compatible with a colliding-wind (CW) binary (Rauw et al., 2005b), but no optical signature of a companion has ever been reported. This could be explained by a simple lack of data, which is why we undertook a dedicated monitoring of this system a few years ago. Our observing campaign was aimed at probing short-term variations, but also long-term ones because the radio lightcurve indicates a period of ∼2.4yrs (van Loo et al., 2008).
This paper is organised as follows. Section 2 presents the datasets and their reduction; section 3 shows the results obtained while section 4 provides a short summary and perspectives.
2. Observations and data reduction
Observations were carried out at two different observatories: Asiago observatory (Italy) and Haute-Provence observatory (OHP, France). A journal of the observations is provided in Table 1.
In Asiago, spectra were taken in 2005 and 2006 using the AFOSC (Asiago Faint Object Spectrograph & Camera) in echelle mode (grisms 9 & 10). Exposures generally lasted 1200s and provided medium-resolution spectra. Twelve orders were extracted, corrected for the blaze using flat fields, and cali-brated. Due to the low resolution, blends severely affected the ThAr spectra, rendering the wavelength calibration quite rough. Therefore, we used the Diffuse Interstellar Bands (DIBs) to fur-ther refine the calibration (see below). Normalization was done for each order by fitting low-order polynomials into carefully chosen continuum windows.
Archival data were also found in the Asiago archives. Three low-resolution spectra were taken with a Boller & Chivens spec-trograph in 1996 while 14 medium-resolution spectra were
ob-2 Ya¨el Naz´e et al.: A binary signature in the non-thermal radio-emitter Cyg OB2 #9 (RN)
4460
4480
4500
4520
4540
0.8
1
1.2
1.4
4379
4022
3990
3726
HJD
4660
4680
4700
4720
4740
0.8
1
1.2
1.4
4379
4066
4036
3726
HJD
5580
5600
5620
0.9
1
1.1
1.2
1.3
4472
4379
4066
4022
3726
HJD
5800
5850
5900
0.8
1
1.2
1.4
4472
4379
4066
4022
3726
HJD
Fig. 1. Evolution of the line profiles in a few selected spectra (dates shown to the right in format HJD-2 450 000). Vertical lines are drawn at the rest wavelength of the stellar lines and at the DIBs wavelength observed in the Sophie high-resolution spectra. Compare the profiles of Dec. 2005 (date=3726), Sep. 2006 (3990), Oct. 2007 (4379), and Jan. 2008 (4472) to the ones of Oct. 2006 (4022 or 4036) and Nov. 2006 (4066). The saturated emission line close to O λ 5592 is a mercury night sky line from light pollution.
tained in 2003 with an holographic grating (VPH4). The typical exposure times amounted to 600s and 2400s, respectively. These data were reduced in a standard way.
At the OHP, the Aur´elie spectrograph equipped with grat-ing #3 provided 27 additional spectra in the interval 2003-2008 while the Sophie echelle instrument observed the system 8 times in the high-efficiency mode. For individual spectra, the typi-cal exposure time was 1800–3600s, and the data were finally smoothed by a moving box average.
After a first analysis, it appeared that the system under-went only long-term changes. Therefore, spectra taken within 1–15days were generally averaged (see number N in Table 1). To improve the wavelength calibration, we took advantage of the high reddening and used several narrow, well-marked DIBs close to major spectral lines. Their mean radial velocity (RV) mea-sured on Sophie spectra, our highest resolution data, was cho-sen as reference. RVs amount to –15.2, +8.6, –8.0, –11.3km s−1
for DIBs at 4501.7, 4726.4, 5780.45 and 6613.62Å, respectively. The stellar lines were fitted by gaussian(s) and the measured RVs were corrected by the shift derived from the closest DIB. This ensures that the RVs are correct to within 10km s−1; larger
ex-cursions of the RVs are thus very likely real.
3. Data Analysis
The most striking feature of the spectrum of Cyg OB2 #9 is the presence of strong interstellar lines due to the high absorption of the star. Even some lines which are usually negligible in mas-sive stars’ spectra are here clearly detected (for a list of DIBs see Herbig, 1995). Some can be mistaken for stellar features and one must be particularly careful in the analysis when the DIBs are close to actual stellar lines. For example, C ł 5812 presents a double-line profile in the recent Sophie data, but this is only due to the contamination by a DIB at 5809.13Å! In lower-resolution spectra, such blends may remain undetected but they can still affect the measure of RVs (e.g. for He ł 5412 and C łł 5801,5812).
The observed spectrum of Cyg OB2 #9 also displays the absorption lines typical of an O5.5If star: strong He ł 4542,5412,6683 and weaker He lines (at 4471, 5876Å). It also shows some emission features, notably He ł 4686, C ł 5696, Hα.
The first spectra of the monitoring (until September 2006) showed relatively narrow and strong absorption lines, but the sit-uation changed abruptly in October 2006. At that time, the lines became shallower and broader, even showing double line pro-files, the typical signature of a binary. In November 2006, the lines presented intermediate line profile while the most recent
Ya¨el Naz´e et al.: A binary signature in the non-thermal radio-emitter Cyg OB2 #9 (RN) 3
Table 1. Journal of observations. Julian dates (mean values if N,1) are given in the format HJD–2 450 000, N is the number of spectra taken, ∆λ is the wavelength range, R is the spectral res-olution (λ/FW H Mcalib), S/N is the average signal-to-noise ratio
of the individual spectra.
Instrument Date N ∆λ (Å) R S/N B&Ch. 287.56 1 4900-6050 1000 300 287.57 1 5950-7100 1200 500 287.55 1 3850-5000 800 70 AFOSC-ls 2811.50 3 6400-7000 3400 300 2857.30 5 6400-7000 3400 400 2956.37 2 6400-7000 3400 300 2987.74 4 6400-7000 3400 300 AFOSC-ech 3726.23 4 3700-8800 3600 300 3887.49 1 3700-8800 3600 200 3990.46 1 3700-8800 3600 130 4022.25 3 3700-8800 3600 150 4036.24 2 3700-8800 3600 130 4051.39 1 3700-8800 3600 160 4066.30 1 3700-8800 3600 120 Aur´elie 2920.30 16 6400-6750 11000 70 3290.29 10 6400-6750 11000 150 3551.59 14 6400-6750 11000 250 3651.71 10 6400-6750 11000 130 4244.48 2 5500-5900 8800 50 4303.50 2 5500-5900 8800 70 4324.43 2 5500-5900 8800 100 4472.25 1 5500-5900 8800 90 Sophie 4348.77 3 3900-6900 35000 80 4379.06 3 3900-6900 35000 90 4463.75 2 3900-6900 35000 100
spectra again showed stronger and narrower lines. This evolution is illustrated in Figure 1. The double-peaked profiles of uncon-taminated stellar lines provide the first undisputable evidence of the binary nature of Cyg OB2 #9. This statement stands on solid ground: it relies on an homogeneous dataset, the Asiago spec-tra, and is thus independent of instrument changes; moreover, such double line profiles cannot be spontaneously generated in the sole stellar lines by instrumental problems or reduction pro-cesses.
A non-circular orbit was suggested by the variations of the radio emission (van Loo et al., 2008). The rapid variation of the line profiles in the visible domain also revealed the presence of eccentricity, with a quite high value. Figure 2 shows the evolu-tion of the RVs with time for He ł 5876 and He ł 6683, two strong and uncontaminated stellar lines. A sharp change of the RVs is detected in He ł 5876, as well as for other photospheric lines (O ł 5592 and C łł 5801,5812). It is reminiscent of the periastron passage in a highly eccentric binary. In this context, it should be noted that the line splitting and large RV excursion oc-cur when the radio emission is minimum (φOct06∼11.94 ± 0.08
following the ephemeris of van Loo et al. 2008), as expected if the non-thermal radio emission arises in the colliding-wing re-gion.
The onset of a drop in the RVs can also be detected in the He ł 6683 observations taken in 2003: the measured variations are thus compatible with the period of 2.355yr derived from the changes of the radio fluxes (van Loo et al., 2008), though the pe-riastron passage itself unfortunately occurred during a gap in the observations. In this context, it should be noted that the aver-age value of the RVs from Kiminki et al. (2007), −16.1km s−1, is fully compatible with our mean RV measured outside large RV excursion events and that the lowest value of the RV reported by
HeII6683 HeI5876
H/HeI avg (Kiminki et al.)
9.0 9.5 10.0 10.5 11.0 11.5 12.0 12.5
Fig. 2. Radial velocity evolution of the best stellar lines (in terms of strength and non-contamination by DIBs) between June 2003 and January 2008. Average RV values for various H and He lines from Kiminki et al. (2007) are also presented. A line in-dicating the length of three periods of van Loo et al. (2008) is drawn for comparison and phases derived from their ephemeris are shown on top (uncertainties amount to ±0.08 in phase).
these authors occured 3 periods before our 2006 RV drop (Fig. 2). Unfortunately, as for us in 2003, Kiminki et al. (2007) missed the periastron passages themselves by only a week or two.
The splitting observed in October 2006 for He ł 5876 allows us to derive RVs of +92 and –145km s−1, whereas the RV of the
apparently single component was –17km s−1in October 2007.
This suggests a mass ratio of about unity. The relative strength of the two components (see He ł 5876 and C ł 5812 profiles in Figure 1) suggests a slightly later type for the companion. The system could thus be O5+O6-7. However, the noise and un-certainties of our data prevent us from deriving more accurate spectral and orbital parameters.
Finally, the non-thermal nature of the radio emission not only suggested a binary nature for Cyg OB2 #9, but also im-plies the presence of colliding winds. The signature of such a phenomenon can also be detected in the visible domain, as has been shown for several systems (see e.g. Rauw et al., 2001; Sana et al., 2001). In this context, it is interesting to note that the RVs of the He ł 4686 emission line do not follow the trend of the other lines: this line appears redshifted while the main component of the others lines are moving bluewards (Figure 1). Since the lines from the companion appear of slightly reduced strength compared to those of the primary star, it is possible that this line arises in the CW region. In addition, the Hα pro-file displays a complex behaviour. The absorption component first presents a rather triangular shape and then appears more rounded; the emission component strengthens when a maximum RV separation is seen in the photospheric lines – such an anti-phase effect is quite typical of CW binaries.
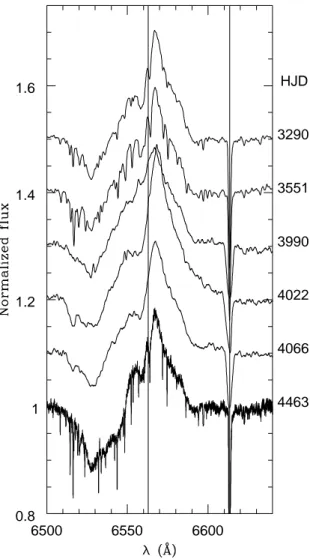
4 Ya¨el Naz´e et al.: A binary signature in the non-thermal radio-emitter Cyg OB2 #9 (RN) 6500 6550 6600 0.8 1 1.2 1.4 1.6 4463 4066 4022 3990 3551 3290 HJD
Fig. 3. Evolution of the profile of the Hα line. The data were taken in Oct. 2004 (date=3290), June 2005 (3551), Sep. 2005 (3990), Oct. 2006 (4022), Nov. 2006 (4066) and Oct. 2007 (4379). Note the sharp increase in line strength at date 4022, i.e. when the absorption lines are showing their largest separation (see Fig. 2).
4. Summary and conclusions
A dedicated monitoring of Cyg OB2 #9 has been going on since 2003. The detected line profile variations provide the first di-rect evidence of the presence of a companion in an eccentric orbit. The period of the detected changes is compatible with the 2.355yr timescale derived from radio measurements and the line splitting corresponds to the minimum emission in the ra-dio range. The behaviour of the He ł 4686 and Hα emission lines further suggests the presence of colliding winds. The bi-nary status of Cyg OB2 #9 lends thus additional support to the ‘standard scenario’ for the non-thermal emission from early-type stars, where particle acceleration and synchrotron radio emis-sion take place in the wind interaction region of a binary system (De Becker, 2007). In addition, the quite high plasma temper-ature (∼30 MK) derived from the fit of thermal models to the X-ray spectrum of Cyg OB2 #9 is compatible with a scenario where a significant fraction of the X-rays are produced in a long period colliding wind binary (Rauw et al., 2005b).
Though the presented evidence for binarity is indisputable, much work is still needed to gain a complete knowledge of this peculiar massive system. To derive accurate orbital param-eters and constrain the wind collision properties, it is necessary to accumulate more data. Additional spectra need to be taken with both high-resolution and high signal-to-noise, like e.g. our Sophie observations. It is particularly important to sample the rapid variations that occur near periastron. If October 2006 was indeed the last periastron event and if the 2.4yr radio period is correct, then the next periastron passage will take place in early 2009 - at a time when the star is not easily observable under good conditions (conjonction with the Sun). Nevertheless, any effort should be taken to monitor the system as close as possible to the event. A better estimate of the properties of Cyg OB2 #9 might indeed require to wait for mid-2011, except if additional archival data, taken at the right epochs, are available.
Acknowledgements. We acknowledge support from the Fonds National de la Recherche Scientifique (FNRS, Belgium), the Scientific Cooperation program 2005-2006 between Italy and the Belgian ‘Communaut´e Franc¸aise’ (project 05.02), the OPTICON trans-national access programme, and the PRODEX XMM and Integral contracts (Belspo).
References
De Becker, M., Rauw, G., & Manfroid, J. 2004, A&A, 424, L39 De Becker, M. 2007, A&A Rev., 14, 171
Herbig, G. H. 1995, ARA&A, 33, 19 Kiminki, D. C., et al. 2007, ApJ, 664, 1102 Kn¨odlseder, J. 2000, A&A, 360, 539
Pigulski, A., & Kołaczkowski, Z. 1998, MNRAS, 298, 753 Pittard, J. M., & Dougherty, S. M. 2006, MNRAS, 372, 801
Rauw, G., Naz´e, Y., Carrier, F., Burki, G., Gosset, E., & Vreux, J.-M. 2001, A&A, 368, 212
Rauw, G., Sana, H., Gosset, E., De Becker, M., Arias, J., Morrell, N., Eenens, P., & Stickland, D. 2005a, Massive Stars and High-Energy Emission in OB Associations, 85
Rauw, G., De Becker, M., & Linder, N. 2005b, Massive Stars and High-Energy Emission in OB Associations, 103
Sana, H., Rauw, G., & Gosset, E. 2001, A&A, 370, 121
van Loo, S., Runacres, M. C., & Blomme, R. 2005, A&A, 433, 313
van Loo, S., Blomme, R., Dougherty, S. M., & Runacres, M. C. 2008, A&A, in press