Summary A dynamic, closed-chamber infrared gas analysis (IRGA) system (DC-1: CIRAS-1, PP-Systems, Hitchin, U.K.) was compared with three other systems for measuring soil CO2 efflux: the soda lime technique (SL), the eddy correlation tech-nique (EC), and another dynamic, closed-chamber IRGA sys-tem (DC-2: LI-6250, Li-Cor, Inc., Lincoln, NE). Among the four systems, the DC-1 systematically gave the highest flux rates. Relative to DC-1, SL, EC and DC-2 underestimated fluxes by 10, 36 and 46%, respectively. These large and sys-tematic differences highlight uncertainties in comparing fluxes from different sites obtained with different techniques.
Although the three chamber methods gave different results, the results were well correlated. The SL technique underesti-mated soil CO2fluxes compared with the DC-1 system, but both methods agreed well when the SL data were corrected for the underestimation at higher fluxes, indicating that inter-site comparisons are possible if techniques are properly cross-calibrated. The EC was the only system that was not well cor-related with DC-1. Under low light conditions, EC values were similar to DC-1 estimates, but under high light condi-tions the EC system seriously underestimated soil fluxes. This was probably because of interference by the photosynthetic activity of a moss layer. Although below-canopy EC fluxes are not necessarily well suited for measuring soil CO2efflux in natural forest ecosystems, they provide valuable information about understory gas exchange when used in tandem with soil chambers.
Keywords: closed chamber, eddy covariance, infrared gas analysis, soda lime technique.
Introduction
Accurate measurements of soil CO2efflux are crucial in eco-system carbon (C) budgets, but are difficult to obtain (Lund et al. 1999). Soil CO2efflux is the result of two processes: soil CO2production (mainly root and microbial respiration) and transport of CO2 to the atmosphere (Fang and Moncrieff 1999). In undisturbed conditions, transport is dominated by gaseous diffusion and mass flow (Kimball and Lemon 1971),
although other forms of transport also occur (Thorstenson and Pollock 1989). The diffusive flux is driven by the concentra-tion gradient between the soil and atmosphere, whereas mass flow depends on pumping by atmospheric pressure fluctua-tions on turbulent scales (Kimball and Lemon 1971, Kimball 1983, Baldocchi and Meyers 1991). Thus, soil CO2efflux can be measured accurately only by a system that does not alter ei-ther soil respiratory activity, the CO2concentration gradient, or the pressure and air motion near the soil surface.
There are many methods for measuring soil CO2efflux, with large differences in accuracy, spatial and temporal reso-lution, and applicability. Hence, the choice of a specific tech-nique is often a trade-off between requirements (accuracy and resolution) and feasibility (applicability and cost). Further-more, there is no standard or reference to test accuracy (Nakayama 1990, Rayment and Jarvis 1997), and consider-able uncertainty characterizes all types of measurements (Lund et al. 1999).
Traditionally, soil CO2fluxes were measured with cham-bers covering small patches of soil. The use of such enclosures is sometimes criticized both because they are not well suited to sample the spatial heterogeneity inherent to soil CO2efflux, and because of so-called chamber effects (Mosier, 1990). Chamber effects include: (1) soil disturbance while placing the chamber, causing CO2to be released from the compacted soil pores (Matthias et al. 1980); (2) temperature and moisture changes in the soil and air under the chamber, possibly affect-ing decomposition and root respiration rates; (3) alteration of the CO2concentration gradient between the soil and the cham-ber headspace, influencing diffusion rates (Healy et al. 1996); (4) elimination or alteration of ambient turbulent pressure fluctuations within the chamber, reducing mass flow of CO2 (Rayment and Jarvis 1997) and affecting the development of the viscous layer near the soil; (5) sensitivity to pressure dif-ferences between the chamber headspace and the atmosphere (differences of 1 Pa or less have been found to induce signifi-cant mass flow of CO2into or out of the soil beneath the cham-ber, resulting in significant over- or underestimation of the true fluxes (Kanemasu et al. 1974, Fang and Moncrieff 1996, Rayment and Jarvis 1997, Lund et al. 1999); and (6)
place-Assessing forest soil CO
2
efflux: an in situ comparison of four
techniques
IVAN A. JANSSENS,
1ANDREW S. KOWALSKI,
1BERNARD LONGDOZ,
2and REINHART
CEULEMANS
11
Department of Biology, University of Antwerpen (UIA), Universiteitsplein 1, B-2610 Antwerpen, Belgium
2
Faculté des Sciences Agronomiques de Gembloux, Physics Department, B-5030 Gembloux, Belgium
Received April 9, 1999
ment of a soil chamber modifies air motion and generates pres-sure variations around the chamber that may alter efflux within the chamber, especially in windy sites and on porous soils and litter layers (Matthias et al. 1980, Rochette et al. 1997).
Depending on the presence or absence of air circulation, chamber methods have been categorized as either static or dy-namic (Witkamp and Frank 1969). Static chamber techniques are based either on enrichment or absorption. The soda lime method (Lundegårdh 1927, Monteith et al. 1964, Howard 1966, Edwards 1982, Grogan 1998) is frequently used because it is inexpensive, easy to use, and particularly suitable where spatial variability is large (Kleber and Stahr 1995, Keith et al. 1997, Janssens and Ceulemans 1998). However, static tech-niques tend to overestimate small fluxes and underestimate large fluxes (Nay et al. 1994) and are, therefore, often regarded as inferior to dynamic chamber systems (Norman et al. 1992).
Two approaches have been developed with dynamic cham-ber systems employing infrared gas analyzers (IRGA). In closed-chamber IRGA systems, air circulates in a loop be-tween the chamber and an external IRGA (Parkinson 1981, Norman et al. 1992, Goulden and Crill 1997, Rochette et al. 1997). Open-chamber systems have a constant airflow through the chamber, and the CO2concentrations in the inlet and outlet are continuously monitored. In these systems, air does not circulate but is vented to the atmosphere (Witkamp and Frank 1969, Edwards and Sollins 1973, Kanemasu et al. 1974, Schwartzkopf 1978, Denmead 1979, Fang and Moncrieff 1996, Iritz et al. 1997, Rayment and Jarvis 1997). Open-chamber systems are extremely sensitive to pressure differences between the chamber and the atmosphere (Kanemasu et al. 1974, Fang and Moncrieff 1996, Rayment and Jarvis 1997, Lund et al. 1999). Several approaches have been suggested to minimize these pressure differences, such as simultaneously blowing and drawing air through the chamber (Fang and Moncrieff 1996), and the use of very large air inlet apertures (Rayment and Jarvis 1997). In closed systems, pres-sure equilibration between the chamber and the atmosphere can be achieved with a properly designed venting tube (Hutch-inson and Mosier 1981, Norman et al. 1992) capable of mini-mizing leakage. Another important chamber-related problem is the elimination of ambient turbulence. In open systems, transfer of atmospheric pressure fluctuations to the chamber headspace may be partly achieved by using large inlets or out-lets (Iritz et al. 1997, Rayment and Jarvis 1997).
To avoid chamber-related problems, alternative techniques, such as the soil CO2profile method (de Jong and Schappert 1972, Dueñas et al. 1995, Uchida et al. 1997), the mass bal-ance technique (Dabberdt et al. 1993, Denmead and Raupach 1993) and an array of micrometeorological methods (eddy covariance technique, the flux-gradient method, the Bowen ra-tio/energy balance method, the aerodynamic method and oth-ers) have been applied to estimate soil CO2efflux (Rosenberg et al. 1983, Baldocchi et al. 1986, 1997, Fowler and Duyzer 1989, Mosier 1990, Baldocchi and Meyers 1991, Dabberdt et al. 1993, Denmead and Raupach 1993, Dugas 1993, Janssens et al. 2000, Kelliher et al. 1999, Law et al. 1999). The basic
concept of these micrometeorological methods is that gas transport from the soil surface is accomplished by eddies that displace air parcels from the soil to the measurement height, and that the vertical flux measured at that reference level is identical to the efflux from the soil (Mosier 1990). Micrometeorological techniques have advantages over cham-ber systems in that they do not modify the microenvironment of the soil surface (Dugas 1993), and can measure soil CO2 efflux continuously over long time periods. Another advan-tage is that they integrate larger surface areas (Baldocchi 1997), thereby sampling the spatial heterogeneity (Mosier 1990). Unfortunately, successful application of these tech-niques is dependent on several conditions. An extensive, ho-mogeneous upwind fetch and atmospheric steady-state conditions are prerequisites (Baldocchi and Meyers 1991). In addition, the presence of vegetation between the soil and the measurement height may alter the measured fluxes (Goulden and Crill 1997, Norman et al. 1997, A.-S. Morén and A. Lindroth, Swedish Univ. Agric. Sci., Uppsala, unpublished results). In view of these strict requirements, it is unlikely that micrometeorological techniques will replace chamber meth-ods as the most common means of measuring soil CO2efflux (Norman et al. 1997).
We have measured soil CO2effluxes with the eddy correla-tion technique and with three chamber techniques: the soda lime method and two dynamic closed chamber IRGA systems. The objectives of the study were to determine how the cham-ber systems compared, and to test the feasibility of using the eddy correlation techniques at the study site. We found large and systematic differences between the different chamber methods. We demonstrated that calibration functions derived in the laboratory are valid for use in situ, and that it is possible to calibrate the different chamber techniques to one standard. The eddy correlation system was not suitable for measuring soil CO2efflux at our site.
Materials and methods
Site description
The study was conducted in an even-aged, 69-year-old Scots pine (Pinus sylvestris L.) stand in the Belgian Campine region (51°18′N, 4°31′E). The 2-ha Scots pine stand is part of a 150-ha mixed coniferous–deciduous plantation (De Inslag) in Brasschaat (de Pury and Ceulemans 1997, Janssens et al. 1999b). The stand is a level-II observation plot of the Euro-pean program for Intensive Monitoring of Forest Ecosystems (EU and UN/ECE), and is managed by the Institute for For-estry and Game Management, Flanders, Belgium.
Mean annual temperature at the site is 9.8 °C, and mean an-nual precipitation is 767 mm (Kowalski et al. 1999). Apart from some shallow drainage ditches, the study site has a flat topography, a gentle slope (0.3%), and an elevation of 16 m (Baeyens et al. 1993). In 1995, tree density was 556 trees ha–1, with a mean tree height of 20.6 m and a mean diameter at breast height (1.3 m) of 0.27 m (Èermák et al. 1998). The for-est canopy has a mean depth of 3.7 m, a 35% gap fraction (Van den Berge et al. 1992), and a leaf area index varying between 1.9 and 2.4 (Gond et al. 1999). All undergrowth was
com-pletely removed in 1993, giving way to a dense moss layer dominated by Hypnum cupressiforme Hedw., Dicranium scoparium Hedw., Polytrichum commune L. and Dicranella heteromalla (Hedw.) Schimp.
The site has a moderately wet sandy soil with a distinct hu-mus or iron B-horizon, or both (Baeyens et al. 1993). The or-ganic matter content of the soil (up to 1 m) is estimated at 145 Mg ha–1, 19% of which is stored in the Mor-surface litter layer (Janssens et al. 1999c). Fine root (diameter < 1 mm) bio-mass is 3.2 Mg ha–1, and peaks just below the litter layer (Janssens et al. 1999c). More detailed information on the soil, vegetation and local climatic conditions can be found else-where (Van den Berge et al. 1992, Baeyens et al. 1993, Janssens et al. 1999c, Kowalski et al. 1999).
Measurement techniques
Dynamic closed chamber system 1 (DC-1) In this study, DC-1 was the reference system against which the other tech-niques were compared (Table 1). The DC-1 is a commercially available portable system (PP-Systems, U.K.), and consists of an IRGA (CIRAS-1) and a soil chamber (SRC-1), equipped with a fan. The soil chamber is cylindrical (height = 150 mm; diameter = 100 mm). Pressure differences between the cham-ber headspace and the atmosphere were below the detection limit of the manometer (0.5 Pa). To mitigate spatial variability, we enlarged the surface area sampled by the chamber (from 78 to 302 cm2) by attaching a PVC rim to the base of the chamber. The bottom side of the PVC rim had a slot in which a rubber joint provided an airtight seal for the soil collars. These collars were 20 cm in diameter and 8-cm tall, and were inserted in the soil to a depth of 5 cm, one week before the experiment began. All vegetation was removed from inside the collars. Flux rates were calculated from the increase in CO2over time, the volume of the entire system and the enclosed soil surface area. Each measurement interval was constrained by a maximum increase in CO2concentration of 50 ppmv and a maximum duration of 120 s.
Dynamic closed chamber system 2 (DC-2) The DC-2 con-sisted of a homemade chamber (based on the model proposed by Norman et al. 1992) linked to an IRGA (LI-6250 Li-Cor, Inc., Lincoln, NE) and a control console (Li-Cor LI-6200). At a workshop on soil respiration methodology (Uppsala, 1996), the homemade DC-2 chamber was compared with the com-mercial chamber sold by Li-Cor (LI-6000-09), and both cham-bers produced similar results.
The chamber (height = 185 mm; diameter = 80 mm) was aluminum with a PTFE coating on the interior. Air enters the
DC-2 chamber through an annular manifold just above the forest floor. The manifold generates sufficient air mixing to ensure homogenization within the chamber. A tube, inserted through a 2-mm-diameter hole in the chamber, equilibrates pressure with the outside. A laboratory study indicated that these pressure differences were less than 0.1 Pa (FCO42 dif-ferential pressure transducer, Furness Controls Ltd., Bexhill-on-sea, England). Carbon dioxide leakage through the tube was negligible, because the concentration in the chamber is nearly the same as the ambient concentration. The chambers were put on 8-cm collars. Airflow was first scrubbed with soda lime to reduce the CO2concentration below ambient, and soil efflux rates were then obtained from the rate of increase in CO2 concentration between 15 ppmv below and 15 ppmv above ambient concentration. Measurements on each collar were duplicated (always with less than 10% variation). Soda lime technique (SL) Soda lime measurements were made with the same 20-cm-diameter soil collars as used for the DC-1 measurements. The chambers were sealed with 3-cm thick PVC lids. The bottom side of the PVC lids had a slot that fitted the soil collars, and a rubber joint provided an airtight seal. For each measurement, 6 g of pre-dried (24 h at 105 °C) soda lime was placed in a 6-cm-diameter tin tray inside the closed chambers for 24 h. Six controls were used to correct for CO2absorption during transport. Even at peak flux rates, the weight-ratio of absorbed CO2to exposed soda lime never ex-ceeded 10%, which is well below the value at which saturation reduces absorption efficiency (Edwards 1982). Also, CO2 con-centrations in the chamber headspace remained more or less constant and well below ambient concentrations during the en-tire exposure period, indicating that saturation did not occur. Flux rates were calculated from the mass increase in soda lime (after drying for 24 h at 105 °C) multiplied by 1.69 to correct for the chemical release of water when soda lime reacts with CO2(Grogan 1998).
Eddy correlation technique (EC) The eddy correlation in-strumentation consisted of a sonic anemometer (USAT-3, Metek GmbH, Elmshorn, Germany) and a Li-Cor IRGA (LI-6262). Data were collected at 10 Hz. The anemometer was mounted at a height of 1.65 m above the forest floor, and the sample intake for the IRGA was located immediately below the anemometer. Air was sampled at a rate of 6.2 dm3min–1 through a 1.0-mm filter (Acro 50, P/N 4258, Pall Gelman Corp., East Hills, NY) into a teflon tube (inner diameter = 4.33 mm; length = 4.4 m) and heated to avoid condensation. A sub-sequent filter (Balston 300-01961, Balston Inc., Tewksbury,
Table 1. Overview and description of the four techniques used.
System Abbreviation Technical Information
Dynamic Closed system 1 DC-1 IRGA: Ciras-1, PP-Systems Chamber: SRC-1, PP-Systems Dynamic Closed system 2 DC-2 IRGA: Li-6262, Li-Cor Chamber: Norman et al. 1992
Soda Lime Method SL See Janssens and Ceulemans 1998
MA) conditioned the air before sampling by the IRGA. The IRGA ranges of 300–500 ppmv CO2and 0–30 pptv H2O cor-responded to analog output signal ranges of 0–5000 mV, which were processed through the A/D converter of the sonic anemometer, digitized and stored in a computer. Fluxes were computed based on a 30-min averaging period. Time series of winds were delayed to account for system lag in the gas sam-pling system. Turbulent fluctuations were determined as the difference between the time series and a digital recursive filter approximating a running mean, with a filter time constant of 50 s as described by McMillen (1988). The coordinate system for the fluxes was rotated such that the x-axis was aligned with the mean wind for the averaging period (v = w = 0). The sur-face-normal flux (w c′ ′)was used as the estimate of surface gas exchange. Data were rejected whenever the operators were present within 30 m of the sampling system. Some daytime data were also excluded when the CO2concentration fell below the lower measurement limit of the IRGA. Finally, whenever the change in CO2concentration from one half hour to the next exceeded 10 ppmv, the flux data were rejected; thereby limit-ing the importance of any unaccounted storage term. Within 25 m around the eddy correlation system, sparse grass and sap-lings were removed. In contrast with the chamber measure-ments, however, the moss layer remained untouched.
Comparison experiments
Modified versus original DC-1 In July 1998, we assessed the effect of enlarging the original soil chamber (see descrip-tion of DC-1). Inside the large, 20-cm-diameter soil collars of the modified chamber, we installed the smaller, 10-cm-diame-ter collars on which the original soil chamber fitted. All collars were sampled first with one chamber and then with the second, connected to the same IRGA (CIRAS-1). Because the modi-fied chamber measured a larger area than the original chamber, some degree of variability in the results was expected. DC-1 versus DC-2 On June 25, 1998, we compared the out-puts of the DC-1 and DC-2 chamber systems. For this purpose, the smaller DC-2 soil collars were inserted inside the larger collars used for DC-1. Chambers were selected to cover the widest possible range in soil CO2efflux.
DC-1 versus SL Because soda lime measurements take 24 h, in situ comparisons involved nighttime DC-1 measurements. The IRGA system provides information on the diurnal changes in soil CO2efflux, whereas the soda lime technique only gives the mean flux for the entire period. Because both techniques had to be applied simultaneously, we could not use the same collars. Instead, we installed 52 collars in 10 groups in the for-est. Half of the five to six collars in each group were measured with the soda lime technique, and the other half with the DC-1 system. Eight measurements with the DC-1 system were made at frequent intervals during the 24-h period. Mean daily flux for each collar was obtained by linear interpolation between data points and integration over the entire period. For each system, the mean of two to three collars per group was considered as one data point.
A laboratory experiment (Janssens and Ceulemans 1998) showed that, at higher flux rates, SL gave significantly lower results than DC-1 (Figure 1). For this reason, the SL data were corrected:
Corrected SL= −0137 1 071. + . SL+0 068. SL2 (1) DC-1 versus EC The EC system was installed at the forest floor for a three-week period in June–July 1998. Because the EC method integrates larger surface areas than the DC-1 method, we compared the half-hourly averaged eddy fluxes with the mean of 8 to 10 simultaneous DC-1 measurements. To avoid interference due to the operator’s respiration, all DC-1 measurements were made downwind of the EC system. For this purpose, we installed 20 soil collars in a regular circular pattern around, and 5 m from, the EC system. Repeated mea-surements of soil CO2efflux from these collars showed signifi-cantly different flux rates; however, the footprint of the eddy flux system integrates several collars. When smoothing the measured flux rates with the fluxes from the four adjacent col-lars, no significant differences between the different wind di-rections were detected (Figure 2). Therefore, we assumed no differences between the soil CO2efflux rates downwind and upwind of the EC system. To avoid problems associated with nighttime eddy flux measurements (Greco and Baldocchi 1996, Valentini et al. 1996), only daytime data were used in this comparison.
Results
Modification of the DC-1 chamber system
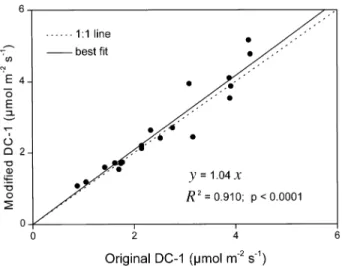
Measurements of soil CO2efflux obtained with the DC-1 sys-tem with the enlarged soil chamber were not significantly dif-ferent (P≤ 0.05) from those made with the DC-1 with the original soil chamber (Figure 3). We observed an almost 1:1
Figure 1. Laboratory comparison of the soda lime (SL) and the dy-namic closed chamber (DC-1) techniques (adapted from Janssens and Ceulemans 1998).
linear relationship (y = 1.04x) with good correlation (R2= 0.91, n = 19) between both chambers, despite the use of soil collars of different sizes.
DC-1 versus DC-2
Large differences (P≤0.001) were detected between the mea-surements obtained with the two dynamic closed chamber sys-tems, DC-1 and DC-2 (Figure 4). Compared with the results from the DC-1, the DC-2 systematically gave results that were nearly 50% lower (Table 2). Despite the use of different collar sizes, results of both systems were closely correlated (R2= 0.85, n = 9).
DC-1 versus SL
On average, the SL results were about 10% lower than the DC-1 results (Table 2). Both techniques were well correlated (R2= 0.76, n = 10, Figure 5 top panel), despite the use of dif-ferent collars, and the fact that the DC-1 result was obtained through linear interpolation of eight data points in the 24-h pe-riod. Applying the calibration function to the SL data de-creased the difference in absolute values between the two techniques (Figure 5 lower panel).
DC-1 versus EC
Results obtained with the EC system differed significantly (P≤0.001, n = 10) from those obtained with the DC-1 system (Figure 6). On average, the fluxes measured by the EC system were 36% lower than those measured by the DC-1 system (Ta-ble 2). However, unlike the chamber systems, the correlation between the DC-1 and EC data was poor (Figure 6 and Ta-ble 2). Continuous EC measurements at the site indicated that daytime fluxes were lower than nighttime fluxes, and that variability was much higher during nighttime (Figure 7). Be-cause the lower daytime fluxes measured by the EC system could have been related to moss photosynthesis, we plotted the difference between DC-1 and EC versus PAR (Figure 8).
Table 2. Relationships and correlations of the soda lime (SL), dy-namic closed system 2 (DC-2) and eddy correlation (EC) techniques relative to the dynamic closed system 1 (DC-1).
System Relative to DC-1 R2 DC-1 1 SL uncorrected 0.91 0.76 SL corrected 0.99 0.76 DC-2 0.54 0.85 EC 0.64 0.21
Figure 2. Soil CO2efflux rates in different wind directions measured with the DC-1 system at a distance of 5 m from the eddy covariance system. Data from each collar were smoothed with the four adjacent (two at each side) collars. Error bars represent the standard deviation between these five collars.
Figure 3. In situ comparison of the original dynamic closed chamber system (DC-1) with the the modified soil chamber.
Figure 4. Comparison of the dynamic closed chamber systems DC-1 and DC-2.
Measurements performed at low PAR (left side of Figure 8) were all made under similar soil temperature conditions, whereas measurements made at high PAR were made at dif-ferent soil temperatures, which could explain the larger scatter at high PAR. There was a positive effect of PAR on the differ-ence between the fluxes measured by DC-1 and EC.
Discussion
Dynamic chambers
Dynamic chamber systems overcome several chamber prob-lems inherent in static chamber systems. Because of the short sampling period required, changes in soil temperature and wa-ter content are negligible and buildup of CO2in the chamber is
limited. Dynamic systems thoroughly mix air in the chamber headspace, preventing the buildup of a thick soil boundary layer.
Inside dynamic chambers, air motion often differs from the prevailing undisturbed conditions. Turbulence influences soil CO2efflux directly by the pumping action of the pressure fluc-tuations, and indirectly by altering the thickness of the viscous boundary layer. In the viscous layer, CO2transport occurs slowly by molecular diffusion. An increase in the thickness of the viscous layer will retard diffusion rates, leading to an in-creased CO2concentration in the soil beneath the chamber. Because the soil is porous, CO2will diffuse laterally from the soil beneath the chamber to the surrounding area, and chamber flux will be diminished.
Chamber fans may induce unnaturally strong turbulence at Figure 5. Top panel: In situ comparison of the soda lime technique
(SL) and the dynamic closed chamber system (DC-1). Each data point is the mean of 2–3 soil collars. Error bars represent 1 standard devia-tion. The calibration function (derived from Figure 1) is also shown. Bottom panel: Corrected SL results (top panel) versus DC-1. For the correction procedure see text and Janssens and Ceulemans (1998). Each data point is the mean of 2–3 soil collars. Error bars represent 1 standard deviation.
Figure 6. In situ comparison of the eddy covariance technique (EC) and the dynamic closed chamber system (DC-1). All DC-1 values are means of 8–10 soil collars that were located downwind to the EC sys-tem.
Figure 7. Diurnal trend of CO2flux measured by the eddy covariance system (EC). Each data point is the mean of all values monitored at that specific time during a three-week sampling period. Error bars in-dicate one standard deviation.
the soil surface, enhancing both diffusion (thinner viscous layer) and mass flow (blowing CO2-poor air into the soil, and releasing CO2-rich air from the soil), and thus increase CO2 efflux (Norman et al. 1992, Hanson et al. 1993, Le Dantec et al. 1999). As a result of increased efflux in the chamber, the soil beneath the chamber may be depleted in CO2, which may induce lateral diffusion. This hypothesis is also supported by the studies of Le Dantec et al. (1999). These authors reduced the efflux inside the chamber, by increasing the wind speed outside the chamber to twice that inside the chamber. Le Dantec et al. (1999) concluded that the increased wind speed enhanced soil CO2efflux outside the chamber, reducing soil CO2 concentrations around the chamber and resulting in lateral diffusion toward the surrounding soil. These studies in-dicate that, in addition to the sensitivity of chamber measure-ments to over- or under-pressure, chamber measuremeasure-ments can only be accurate if turbulence inside the chamber resembles ambient conditions. This requirement is almost impossible to fulfill.
The DC-1 and DC-2, dynamic closed chamber IRGA sys-tems, differ with respect to: the ventilation system inside the chambers (DC-1 has a fan); the CO2concentrations in the chambers during the measurements (DC-2 measures around ambient CO2concentrations; whereas DC-1 measures above ambient CO2concentrations); and the pressure equilibration tube in DC-2. Relative to DC-2, the higher CO2concentrations in the DC-1 chamber would be expected to result in slightly re-duced soil fluxes; however, the opposite was observed. The DC-2 systematically gave results nearly 50% lower than the DC-1. In a similar study, Le Dantec et al. (1999) reported 30% lower flux estimates by the DC-2 system compared with the DC-1 system.
Because pressure differences between the chamber headspace and the atmosphere were small in both chambers (below the detection limits of 0.1 and 0.5 Pa), we believe that
the lower fluxes measured by DC-2 were caused by differences in turbulence in the chamber headspace. If this supposition is correct, the higher fluxes measured by DC-1 in-dicate that fan-induced mass flow in DC-1 is larger than mass flow in DC-2, which is induced by air motion and pressure fluctuations transferred through the pressure equilibration tube.
The ideal chamber system for measuring soil CO2efflux should mimic ambient conditions perfectly. In a comparison of the DC-1 and DC-2 systems, Le Dantec et al. (1999) found that the average wind speed 1 cm above the soil in the chamber was closer to the prevailing ambient conditions in DC-2 than in DC-1, suggesting that the DC-2 system is more appropriate for measuring soil CO2efflux in forests. However, because no reference soil CO2efflux data exist to test the accuracy of ei-ther method, it is impossible to say which method is best. Static chambers
Static techniques for measuring soil CO2 efflux have not evolved much since Lundegårdh’s (1927) “respiration bell.” Because static chambers have no air motion, molecular diffu-sion is the dominant process driving soil CO2efflux (Kimball 1983). In enrichment methods (Crill 1991, Rochette et al. 1992), the buildup of CO2in the chamber headspace decreases the concentration gradient, and thus the diffusive flux. Enrich-ment methods therefore tend to underestimate soil CO2fluxes (Norman et al. 1997).
In contrast to the enrichment methods, absorption tech-niques such as soda lime (SL) may reduce CO2concentrations in the chamber headspace (Bekku et al. 1997). Despite the in-creased concentration gradient between the soil and the cham-ber air, fluxes are usually underestimated relative to dynamic chamber techniques, especially at high flux rates (Edwards and Sollins 1973, Cropper et al. 1985, Norman et al. 1992, Haynes and Gower 1995, Janssens and Ceulemans 1998). Similarly, we found that the SL results were lower than the DC-1 results.
Depending on efflux rate, soda lime reduced the chamber headspace CO2concentrations to 40–60 ppmv. These cham-ber concentrations remained more or less constant throughout the exposure period, indicating that saturation of the soda lime did not occur. Because of the quasi-similar chamber concen-trations at all flux rates, the enhancement of the gradient be-tween the soil and chamber was independent of the flux. Therefore, enhancement of molecular diffusion was also simi-lar for all fluxes. Elimination of pumping activity by the chamber, however, had a greater effect on the measured soil CO2flux when efflux was large than when efflux was small, because mass flow becomes more important when soil CO2 concentrations are high (i.e., at high flux rates).
Thus, the effect of a static chamber with soda lime is to en-hance the concentration gradient and to diminish mass flow. The enhanced concentration gradient increases diffusion simi-larly at all flux rates, whereas the loss of mass flow inside the static chamber becomes more important at higher flux rates. As a result, the SL technique can overestimate small fluxes and underestimate large fluxes (Nay et al. 1994). Alternative Figure 8. Difference between the dynamic closed chamber system
(DC-1) and the eddy covariance technique (EC) as a function of inci-dent photosynthetically active radiation (PAR) above the canopy. (Difference = DC-1 – EC).
explanations for the underestimation by the soda lime tech-nique, such as a reduction of the concentration gradient or sat-uration of the absorbent, were not confirmed in this study.
Table 2 suggests that SL overestimated fluxes compared with DC-2, in contrast to previous comparisons (Rochette et al. 1992, Haynes and Gower 1995). Three explanations are considered. First, in all previous comparative studies, fluxes measured by SL were inaccurately corrected for the chemical release of water when soda lime absorbs CO2. Grogan (1998) has shown that the correction factor should be 1.69 and not 1.4 (the value used in all previous soda lime measurements). Adding 20.7% to the SL results obtained in the other experi-ments brings the values closer to those obtained with the DC-2. Second, in this study the SL and DC-2 techniques were not directly comparable, because the comparison between DC-1 and SL was done at lower fluxes (0.5–2.5 mmol m–2s–1) than the comparison between DC-1 and DC-2 (2–5 mmol m–2s–1). The SL technique does not underestimate signifi-cantly at low fluxes, whereas at high fluxes it does. If the com-parison between SL and DC-2 had been done at high flux rates (as were the other comparisons), the SL measurements would probably have been similar to or lower than the DC-2 mea-surements. Third, different types of soda lime may have been used. The absorption rate of soda lime is related to purity and surface area. Smaller granules are therefore more efficient in absorbing CO2and lead to lower CO2concentrations in the chamber headspace and increased diffusion rates.
We observed a high correlation between the SL and DC-1 techniques, even though different soil collars were used. The large error bars in Figure 5 were expected, because spatial variability in soil CO2efflux is large, and only two to three soil collars were used per data point. After adjusting the SL data with the calibration function, the SL and DC-1 agreed remark-ably well, thus validating the SL calibration curve obtained under laboratory conditions (Janssens and Ceulemans, 1998). It also indicates that, when properly used and calibrated against an accurate standard system, the soda lime technique can be a useful tool for measuring soil respiration rates, espe-cially where spatial variability is large.
Large and systematic differences among all kinds of cham-ber techniques have also been found in other comparative ex-periments (Cropper et al. 1985, Norman et al. 1997, Le Dantec et al. 1999). Despite large discrepancies between the different chamber systems tested in this study, they were all strongly correlated, indicating that it is possible to calibrate different systems to a reference system. However, because the relation-ships between the different chamber systems differ on differ-ent soil types (Rochette et al. 1992), calibrations should be done in situ, or in the laboratory on soil monoliths from the study site.
Eddy covariance
Three weeks of continuous eddy covariance measurements at the site indicated that daytime fluxes were lower than night-time fluxes. The large variability observed in the nightnight-time fluxes may be related to incomplete mixing during periods of diminished or sporadic turbulence. During such conditions,
turbulent flux at the measurement height is not necessarily re-lated to soil efflux (Janssens et al. 1999a).
In contrast to the findings of Rochette et al. (1997) and Kelliher et al. (1999), we found that the EC system was poorly correlated with DC-1. On average, the EC results were about 40% lower than the DC-1 results. However, underestimation by the EC system was larger during daytime, and increased at high solar irradiances, suggesting that moss photosynthesis contributed significantly to the CO2fluxes measured by the EC system. Similar effects of moss or understory plant gas ex-change on below-canopy EC measurements have been ob-served in other studies (Baldocchi et al. 1997, Goulden and Crill 1997, Morén 1999, Norman et al. 1997, Law et al. 1999). Because EC measurements integrate soil respiration as well as understory gas exchange and bole respiration, they are not well suited for estimating soil CO2efflux in forest ecosystems with undergrowth. They do, however, provide valuable infor-mation on the below-canopy gas exchanges, which are inter-esting when compared with soil CO2 efflux and with the above-canopy fluxes.
Conclusions
Large differences in estimated soil CO2efflux were found by the four measurement techniques that were tested. There is no means to evaluate which method is most accurate. These dif-ferent flux estimates imply that inter-site comparisons may be biased if the different measurement systems are not cross-calibrated. However, cross-calibrations should be done in situ, because the correction curves are site specific. Despite the large differences in absolute values, the different chamber systems were highly correlated, indicating that it should be possible to calibrate different methodologies against a stan-dard system. After correction, the soda lime results agreed well with the results from the DC-1 closed dynamic chamber system. If sufficient attention is paid to accuracy, the SL method can be a useful technique in heterogeneous forests, where large sample numbers are required. Because the EC system deviated more from the chamber system at high irradi-ances than at low irradiirradi-ances, we conclude that photosynthesis by the undergrowth (moss layer) plays an important role. For this reason, micrometeorological techniques are not suited to estimate soil CO2efflux in a forest with undergrowth; how-ever, they do provide valuable information on below-canopy gas exchange.
Acknowledgments
This work contributes to the Global Change and Terrestrial Ecosys-tems (GCTE) Core project of the IGBP, and was partly financed by the Ministry of the Flemish Community (Environment, Nature, Land and Water Management Administration, Forests and Green Areas Di-vision), by the Belgian Prime Minister’s Office (Federal Office for Scientific, Technical and Cultural Affairs; BELFOR network) and by the EC Environment and Climate Research Programmes ECOCRAFT and EUROFLUX. We gratefully acknowledge the Insti-tute for Forestry and Game Management for logistic support at the site, as well as Sylvie Mussche for the loan of a soil chamber, and Da-vid A. Sampson for the use of unpublished PAR data.
Spe-cial thanks to Andreas Ibrom and Kai Morgenstern (Institut für Biokliomatologie, Universität Göttingen, Germany) for the loan of the sonic anemometer, supporting electronics, and data logging soft-ware. I.A.J. is indebted to the Fund for Scientific Research Flanders (F.W.O.), for a post-doctoral fellowship.
References
Baeyens, L., J. Van Slycken and D. Stevens. 1993. Description of the soil profile in Brasschaat. Institute for Forestry and Game Manage-ment, Geraardsbergen, Belgium, 18 p.
Baldocchi, D.D. 1997. Flux footprints within and over forest cano-pies. Boundary-Layer Meteorol. 85:273–292.
Baldocchi, D.D. and T.P. Meyers. 1991. Trace gas exchange above the floor of a deciduous forest 1. Evaporation and CO2efflux. J. Geophys. Res. 96:7271–7285.
Baldocchi, D.D., S.B. Verma, D.R. Matt and D.E. Anderson. 1986. Eddy-correlation measurements of carbon dioxide efflux from the floor of a deciduous forest. J. Appl. Ecol. 23:967–976.
Baldocchi, D.D., C.A. Vogel and B. Hall. 1997. Seasonal variation of carbon dioxide exchange rates above and below a boreal jack pine forest. Agric. For. Meteorol. 83:147–170.
Bekku, Y., H. Koizumi, T. Oikawa and H. Iwaki. 1997. Examination of four methods for measuring soil respiration. Appl. Soil Ecol. 5:247–254.
Èermák, J., F. Riguzzi and R. Ceulemans. 1998. Scaling up from the
individual tree to the stand level in Scots pine. I. Needle distribu-tion, overall crown and root geometry. Ann. Sci. For. 55:63–88. Crill, P.M. 1991. Seasonal patterns of methane uptake and carbon
di-oxide release by a temperate woodland soil. Global Biogeochem. Cycles 5:319–334.
Cropper, W.P.J., K.C. Ewel and J.W. Raich. 1985. The measurement of soil CO2evolution in situ. Pedobiologia 28:35–40.
Dabberdt, W.F., D.H. Lenschow, T.W. Horst, P.R. Zimmerman, S.P. Oncley and A.C. Delany. 1993. Atmosphere–surface ex-change measurements. Science 260:1472–1481.
de Jong, E. and H.J.V. Schappert. 1972. Calculation of soil respiration and activity from CO2profile in the soil. Soil Sci. 113:328–333. de Pury, D.G.G. and R. Ceulemans. 1997. Scaling-up carbon fluxes
from leaves to stands in a patchy coniferous/deciduous forest. In Impacts of Global Change on Tree Physiology and Forest Ecosys-tems. Eds. G.M.J. Mohren, K. Kramer and S. Sabaté. Kluwer Aca-demic Publishers, Dordrecht, pp 263–272.
Denmead, O.T. 1979. Chamber systems for measuring nitrous oxide emission from soils in the field. Soil Sci. Soc. Am. J. 43:89–95. Denmead, O.T. and M.R. Raupach. 1993. Methods for measuring
at-mospheric gas transport in agricultural and forest systems. In Agri-cultural Ecosystem Effects on Trace Gases and Global Climate Change. ASA Special Publication, pp 19–43.
Dueñas, C., M.C. Fernández, J. Carretero, E. Liger and M. Pérez. 1995. Emissions of CO2 from some soils. Chemosphere 30:1875–1889.
Dugas, W. 1993. Micrometeorological and chamber measurements of CO2flux from bare soil. Agric. For. Meteorol. 67:115–128. Edwards, N.T. 1982. The use of soda-lime for measuring respiration
rates in terrestrial ecosystems. Pedobiologia 23:321–330. Edwards, N.T. and P. Sollins. 1973. Continuous measurement of
car-bon dioxide evolution from partitioned forest floor components. Ecology 54:406–412.
Fang, C. and J.B. Moncrieff. 1996. An improved dynamic chamber technique for measuring CO2efflux from the surface of soil. Funct. Ecol. 10:297–305.
Fang, C. and J.B. Moncrieff. 1999. A model for soil CO2production and transport. 1: Model development. Agric. For. Meteorol. 95:225–236.
Fowler, D. and J. Duyzer. 1989. Micrometeorological techniques for the measurement of trace gas exchange. In Exchange of Trace Gases between Terrestrial Ecosystems and the Atmosphere. Eds. M.O. Andreae and D.S. Schimel. John Wiley & Sons, Chichester, pp 189–207.
Gond, V., D.G.G. de Pury, F. Veroustraete and R. Ceulemans. 1999. Seasonal variation of leaf-area index, leaf chlorophyll and water content scaled up to fAPAR to estimate the carbon balance of a temperate multi-layer, multi-species forest. Tree Physiol. 19:673–679.
Goulden, M.L. and P.M. Crill. 1997. Automated measurements of CO2exchange at the moss surface of a black spruce forest. Tree Physiol. 17:537–542.
Greco, S. and D.D. Baldocchi. 1996. Seasonal variations of CO2and water vapour exchange rates over a temperate deciduous forest. Global Change Biol. 2:183–197.
Grogan, P. 1998. CO2flux measurement using soda lime: correction for water formed during CO2absorption. Ecology 79:1467–1468. Hanson, P.J., S.D. Wullschleger, S.A. Bohlman and D.E. Todd. 1993. Seasonal and topographic patterns of forest floor CO2efflux from upland oak forest. Tree Physiol. 13:1–15.
Haynes, B.E. and S.T. Gower. 1995. Belowground carbon allocation in unfertilized and fertilized red pine plantations in Northern Wis-consin. Tree Physiol. 15:317–325.
Healy, R.W., R.G. Striegl, T.F. Russel, G.L. Hutchinson and G.P. Livingston. 1996. Numerical evaluation of static-chamber measurements of soil–atmosphere gas exchange: Identification of physical processes. Soil Sci. Soc. Am. J. 60:740–747.
Howard, P.J.A. 1966. A method for the estimation of carbon dioxide evolved from the surface of soil in the field. Oikos 17:67–271. Hutchinson, G.L. and A.R. Mosier. 1981. Improved soil cover
method for field measurements of nitrous oxide fluxes. Soil Sci. Soc. Am. J. 45:11–316.
Iritz, Z., A. Lindroth and A. Gärdenäs. 1997. Open ventilated cham-ber system for measurements of H2O and CO2fluxes from the soil surface. Soil Techn. 10:169–184.
Janssens, I.A. and R. Ceulemans. 1998. Spatial variability in forest soil CO2efflux assessed with a calibrated soda lime technique. Ecol. Lett. 1:95–98.
Janssens, I.A., A.S. Kowalski and R. Ceulemans. 1999a. Intercomparison of forest floor CO2efflux estimates by eddy cor-relation and a chamber-based empirical model. In press. Janssens, I.A., L. Meiresonne and R. Ceulemans. 1999b. Mean soil
CO2efflux from a mixed forest : temporal and spatial integration. In Forest Ecosystem Modelling, Upscaling and Remote Sensing. Eds. R. Ceulemans, F. Veroustraete, V. Gond and J. Van Rensbergen. SPB Academic Publishing, The Hague. In press. Janssens, I.A., D.A. Sampson, J.Èermák, L. Meiresonne, F. Riguzzi,
S. Overloop and R. Ceulemans. 1999c. Above- and below-ground phytomass and carbon storage in a Belgian Scots pine stand. Ann. For. Sci. 56:81–90.
Kanemasu, E.T., W.L. Powers and J.W. Sij. 1974. Field chamber measurements of CO2 flux from soil surface. Soil Sci. 118:233–237.
Keith, H., K.L. Jacobsen and R.J. Raison. 1997. Effects of soil phos-phorus availability, temperature and moisture on soil respiration in Eucalyptus pauciflora forest. Plant Soil 190:127–141.
Kelliher, F.M., J. Lloyd, A. Arneth, B. Lühker, J.N. Byers, T.M. McSeveny, I. Milukova, S. Grigoriev, M. Panfyorov, A. Sogatchev, A. Varlargin, W. Ziegler, G. Bauer, S.-C. Wong and E.-D. Schulze. 1999. Carbon dioxide efflux density from the floor of a central Siberian pine forest. Agric. For. Meteorol. 94:217–232.
Kimball, B.A. 1983. Canopy gas exchange: gas exchange with soil. In Limitations to Efficient Water Use in Crop Production. Eds. H.M. Taylor, W.R. Jordan and T.R. Sinclair. American Society of Agronomy, Madison, WI, pp 215–226.
Kimball, B.A. and E.R. Lemon. 1971. Air turbulence effects upon soil gas exchange. Soil Sci. Soc. Am. Proc. 35:16–21.
Kleber, M. and K. Stahr. 1995. Soil carbon turnover in subalpine sys-tems and its dependence on climate. In Climate Change Research: Evaluation and Policy Implications. Eds. S. Zwerver, R.S.A.R. van Rompaey, M.T.J. Kok and M.M. Berk. Elsevier Science, Amster-dam, pp 561–566.
Kowalski, A.S., S. Overloop and R. Ceulemans. 1999. Eddy fluxes above a Belgian Campine forest and their relationship with predict-ing variables. In Forest Ecosystem Modellpredict-ing, Upscalpredict-ing and Re-mote Sensing. Eds. R. Ceulemans, F. Veroustraete, V. Gond and J. Van Rensbergen. SPB Academic Publishing, The Hague. In press.
Law, B.E., D.D. Baldocchi and P.M. Anthoni. 1999. Below-canopy and soil CO2 fluxes in a ponderosa pine forest. Agric. For. Meteorol. 94:171–188.
Le Dantec, V., D. Epron and E. Dufrêne. 1999. Soil CO2efflux in a beech forest: comparison of two closed dynamic systems. Plant Soil. In press.
Lund, C.P., W.J. Riley, L.L. Pierce and C.B. Field. 1999. The effects of chamber pressurization on soil–surface CO2flux and the impli-cations for NEE measurements under elevated CO2. Global Change Biol. 5:269–281.
Lundegårdh, H. 1927. Carbon dioxide evolution of soil and crop growth. Soil Sci. 23:417–453.
Matthias, A.D., A.M. Blackmer and J.M. Bremner. 1980. A simple chamber technique for field measurements of emissions of nitrous oxide from soils. J. Environ. Qual. 9:251–256.
McMillen, R.T. 1988. An eddy correlation technique with extended applicability to non-simple terrain. Boundary-Layer Meteorol. 43:231–245.
Monteith, J.L., G. Szeicz and K. Yabuki. 1964. Crop photosynthesis and the flux of carbon dioxide below the canopy. J. Appl. Ecol. 1:321–337.
Mosier, A.R. 1990. Gas flux measurement techniques with special reference to techniques suitable for measurements over large eco-logically uniform areas. In Soils and the Greenhouse Effect. Eds. A.F. Bouwman. John Wiley & Sons Ltd., Chichester, UK, pp 289–301.
Nakayama, F.S. 1990. Soil respiration. Remote Sensing Rev. 5:311–321.
Nay, S.M., K.G. Mattson and B.T. Bormann. 1994. Biases of cham-ber methods for measuring soil CO2efflux demonstrated with a laboratory apparatus. Ecology 75:2460–2463.
Norman, J.M., R. Garcia and S.B. Verma. 1992. Soil surface CO2 fluxes and the carbon budget of a grassland. J. Geophys. Res. 97:18845–18853.
Norman, J.M., C.J. Kucharik, S.T. Gower, D.D. Baldocchi, P.M. Crill, M. Rayment, K. Savage and R.G. Striegl. 1997. A compari-son of six methods for measuring soil–surface carbon dioxide fluxes. J. Geophys. Res. 102:28771–28777.
Parkinson, K.J. 1981. An improved method for measuring soil respi-ration in the field. J. Appl. Ecol. 18:221–228.
Rayment, M.B. and P.G. Jarvis. 1997. An improved open chamber system for measuring soil CO2effluxes of a boreal black spruce forest. J. Geophys. Res. 102:28779–28784.
Rochette, P., B. Ellert, E.G. Gregorich, R.L. Desjardins, E. Pattey, R. Lessard and B.G. Johnson. 1997. Description of a dynamic closed chamber for measuring soil respiration and its comparison with other techniques. Can. J. Soil Sci. 77:195–203.
Rochette, P., E.G. Gregorich and R.L. Desjardins. 1992. Comparison of static and dynamic closed chambers for measurement of soil res-piration under field conditions. Can. J. Soil Sci. 72:605–609. Rosenberg, N.J., B.L. Blad and S.B. Verma. 1983. Microclimate. The
biological environment. John Wiley & Sons, New York, 495 p. Schwartzkopf, S.H. 1978. An open chamber technique for the
mea-surement of carbon dioxide evolution from soils. Ecology 59:1062–1068.
Thorstenson, D.C. and D.W. Pollock. 1989. Gas transport in unsatu-rated zones: Multicomponent systems and the adequacy of Fick’s laws. Water Resour. Res. 25:477–507.
Uchida, M., Y. Nojiri, N. Saigusa and T. Oikawa. 1997. Calculation of CO2flux from forest soil using222Rn calibrated method. Agric. For. Meteorol. 87:301–311.
Valentini, R., P. De Angelis, G. Matteucci, R. Monaco, S. Dore and G.E. Scarascia Mugnozza. 1996. Seasonal net carbon dioxide ex-change of a beech forest with the atmosphere. Global Change Biol. 2:199–207.
Van den Berge, K., D. Maddelein, B. De Vos and P. Roskams. 1992. Analyse van de luchtverontreiniging en de gevolgen daarvan op het bosecosysteem. AMINAL/RUG, Belgium, 169 p. In Dutch. Witkamp, M. and M.L. Frank. 1969. Evolution of CO2from litter,