Technical report of goat activities
Final version November 2014
ANNADYA project:
Promoting appropriate technology for smallholders to increase food security among peoples in Cambodia and Lao PDR funded by the European Union (Europaid) under its Technology Transfer for Food Security in Asia (TTFSA) Programme, and implemented by UniversitéLibre de Bruxelles (ULB) in partnership with the Cambodian Center for Study and Development in Agriculture (CEDAC); Gembloux Agro-Bio Tech/ULg (GxABT/ULg) and Hanoi University of Agriculture (HUA) in the provinces of Attapeu (Lao PDR) and Ratanakiri (Cambodia).
« Promoting appropriate technology for smallholders to increase food security among peoples in Cambodia and Lao PDR » DCI-FOOD/2011/277-743
It shall be stated that the author is solely responsible for content communicated, published or disseminated and that it does not represent the European Union opinion (Europaid).
Technical report of the goat production
1 Localization of the village
The Figure 1 shows the localization of the village. The choice of the localization is realized during the identification with the DAFO and the village chief. The target village of the goat activities is also chosen in function of the number of goat per village and the number of household with goat. The free ranging facilitated the diffusion of the improved goat in each village. The goat’s population of Attapeu is estimated to 3,645 and this population is spreading between 600 and 900 goats in function of the district (Figure 1).
Figure 1: Localization of the goat activities
The goat’ activities are spreading in 10 villages in the four target’ districts. The project setting up eight farm-models in Hinlat and “The” and the other villages received male-goats to constitute a goat’s group.
2 Goat activities
2.1 Farm modelEight farm models are setting up in Hinlat (5) and “The” (3). The farm models received a Bach Thao male goat to improve the goat genetic in the production’s area. The male’ goats are coming from the Vietnam. The model returned back generally 2 male goats for the project. But two households returned 3 or 4 goats in function of the project’s investment. The stable is improved and the goat received vaccine. The vaccine concerned FMD and Pasterellosis because they are the most important disease in Attapeu. The project cost concerned the vaccine (364,000 LAK), some material for the stable (3,840,000 LAK) and a male goat (3,425,000 LAK per goat). The project shared one male for two households in “The” and four households in Hinlat (Table 1)
Table 1: Project cost per farm model
Village Name Cost for the goat Cost of vaccine Cost for the
stable The or
Thae
Mr Pin
3,425,000 LAK 19,500 LAK 454,000 LAK
Mrs. Ekeo 71,500 LAK 454,000 LAK
Mr. Kolakan 3,425,000 LAK 52,000 LAK 558,000 LAK
Hinlath
Mrs. Inkhane
3,425,000 LAK 32,500 LAK 454,000 LAK
Mr. Bupha 58,500 LAK 454,000 LAK
Mr. Pheng
3,425,000 LAK 19,500 LAK 454,000 LAK
Mrs.Duongchay 58,500 LAK 454,000 LAK
Mrs. Say 3,425,000 LAK 52,000 LAK 558,000 LAK
In 2012, the project introduced the technics and the improved goat at Hinlat and The. The main result of this model is realized in 2013. In fact, the compare mean (t-test) of goat number per household is very significant but the variability between the household is very high. The best result is obtained after two years because the new technics must be integrated in the food system by the farmers. The eight households kept 12 goats in the farm and eaten 1 or 1.5 goats per year but the households increased the number of sold goats. In fact, in 2012, the average of sold goat per household was 2.0 whereas the average in 2013 amounted to 4.2. In 2013, a flood caused a high mortality rate. The average of mortality rate was 21% while they were in 2011 and 2012 respectively 10% and 4%. The mortality rate decrease between 2011 and 2012 is caused by the vaccination. In fact, the vaccination decreases the disease impact especially the FMD and the Pasterellosis (Figure 2).
Figure 2: Average of head per household
The average of reproductive animals per year presents a relatively stable number (5). But at Hinlat, the number of reproductive animals decreases because the household returned some animal on Annadya and the Hinlat’ models sold some reproductive animals. However, the The’ models presented a higher number in 2012 and 2013 than before the project. This difference is realized through the increase of birth’s number (Figure 3).
Figure 3: Number of reproductive animals per year per household
The crossing between local female and Bach Thao male increases the number of birth per year. The figure 3 shows the average of birth from 2011 to 2013. Despite a high variability between the different models, the trend of birth’s number per year increased (Figure 4).
Figure 4: Average of birth per year per household
In 2014, the surveys show a difference between the birth per female before and after the project. This difference represents one or two goat per litter. The average in Hinlat and “The” demonstrates the birth’s number increase per reproductive animal. However, the variability depends on the age of the reproductive animal1. These results confirm the importance to follow the households after the goat male introduction and the training course. This following increases the sustainability and capitalization of knowledge. The compare mean (t-test) is very highly significant between each year (Figure 5).
Figure 5: Birth per reproductive animal
The goat practices were been focused on free ranging and the farmers don’t used forage. The main used feed is the natural grass near the house and the stable. In fact, the natural grass is an advantage because the work’s time is not very important for this animal production. For example, the rice constitutes the main work’s time because it is the first food in the Lao diet and it is cultural food. The goat is not a demanding production and the time to check the goat is not very long. In the morning, the farmer distribute some water and open the stable and in the evening, the farmer bring back the goats in the stable to protect their. Finally, five households indicated that the main problem was the Cholera, the Diarrhea and ulcerated mouth. This problem is resolved by a treatment with Barberin and Benstep for Cholera and Tylosin or Steptomycin, negasunt, Anagin and B-complex for Diarrhea and Ulcerated mouth.
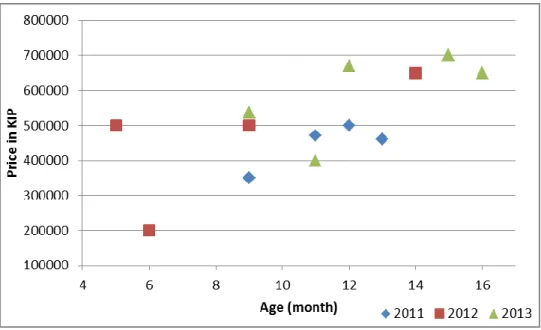
The goat income is estimated by the farmer during the survey and is spreading on one year. The goat income is determinated by the price, the goat number and the age. The income is obtained by the multiplication of the sold goat number and the price. The price is determinated by the size and the age of the animal. The figure 6 shows the price of sold goat during three years. The low number of price is not significant to show a trend but according with the farmer the price before and after the project change because the genetic improvement increases the size of the animal and the size is the major factor to determinate the price (Figure 6).
Figure 6: Evolution of the price in function of the age
But, the income’s average increases after the project’s improvement. This income is determinated by the goat size and the genetic improvement increases significantly the goat size.
The standard deviation is very high in 2014 because the age of the goat varies between 9 and 16 months. In addition to the age, the growing conditions in 2013 were difficult because a flood disrupted the goat growth (Figure 7). In 2011, the average of sold goat per household was 2.5 while the average of 2012 was 3.5 goats. But in 2013, the average decreased to 2.75 goats. This decrease was due to diseases caused by the flood.
Figure 7: Income per year per household 2.2 Group model
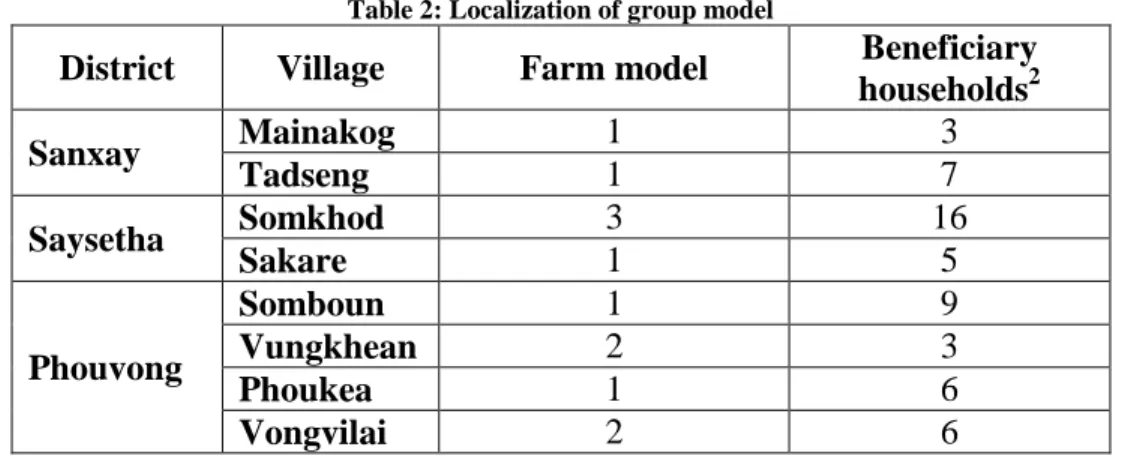
Eight group models are constituted with improved billy of the Hinlat and “The” farm model. Indeed, the model returned back generally 2 male goats for the project. But two households returned 3 or 4 goats in function of the project’s investment. One billy is introduced in eight groups spreading between eight villages. The table 2 shows the number of model farm and beneficiary’s households. The model farms kept the billy and set up a new stable. The group’s households practiced a crossbreeding between local goat and improved billy (present in one household). The local and improved goats of households received FMD vaccination.
Table 2: Localization of group model
District Village Farm model Beneficiary households2 Sanxay Mainakog 1 3 Tadseng 1 7 Saysetha Somkhod 3 16 Sakare 1 5 Phouvong Somboun 1 9 Vungkhean 2 3 Phoukea 1 6 Vongvilai 2 6
The goat groups practiced the cross breeding with the improved billy of the farm model. For each cross-breeding, the project supports the household and the cost of this support is 50,000 kip for the farm model to ensure the feed and good growth conditions and 20,000 kip for the group’s households to encourage the cross breeding. The cross-breeding between the Lao farmers are good to transfer and improve the knowledge of the beneficiary households. The dynamic of this activity is observed during the monitoring in the target villages. Indeed, the farmers exchanged between them about the goat experiences and the problem about this production (disease, crossbreeding, feeding) (Figure 8).
Figure 8: Model of the goat group
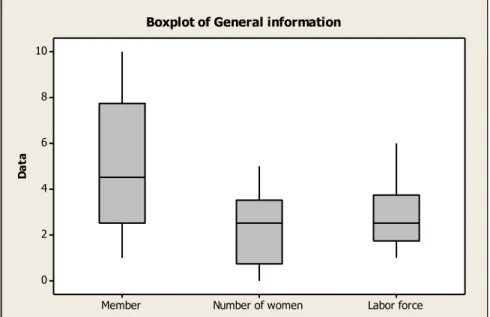
In September 20143, a survey conducted in three goat groups (six beneficiaries’ households) is realized. This survey showed the importance of the improvement and the
productivity of this speculation. The general information of the households is showed in the figure 9. The average work force per household represents 66% of the total4. The average of women in the household represents 42%.
Labor force Number of women Member 10 8 6 4 2 0 D a ta
Boxplot of General information
Figure 9: General information about the survey of September 2014
The table 3 shows the descriptive statistics of the animal per household. The evolution of the animal increases very significant5 in exception of one household in Vungkhean (Phouvong) because he sold some animals in 2013. Another difference is the introduction of improved animal in the goat’s production. Indeed, the average of improved goats in 2014 represents 16%. But this data of two households amounted to 0% because they depend on the crossbreeding and the gestation period. According to the project’s experience, the number of improved goats increases significantly after two years. In addition to this observation, the extensive grazing and the free ranging encouraged the cross-breeding between the goats of each household.
Table 3: Number of animal per household
Number of animal Before After
Mean 15 18
Standard deviation 8 9
Minimum 7 10
Maximum 25 30
3 Note that the data of 2014 do not represent one year. Indeed, the date concerned the period from January 2014 to
September 2014
4
The percentage is obtained with the ratio between the work force and the number of member per household
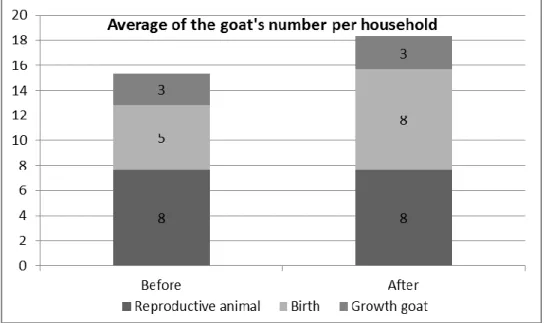
The figure 10 shows the difference before and after the project. Indeed, the number of goat’s birth increased. It passed from 5 to 8 goats per household. According to the farmers, the reproduction is better than before the project because the birth’s mortality decreases with the crossbreeding between the local goat and improved billy (Figure 10).
Figure 10: Average of the goat’s number per household
For the goat’s groups, the mortality is not linked with the disease but through some accident with car, motorbike and some trees’ and vegetation’ falling. The income is just presented for 2013 because in 2014, the households wait to sell the goats. According to the farmers, the goat size was not enough for them. The price is determined by the age and the size of the goats. In 2013, the sold goat’s average is estimated at 3 per household (Figure 11). The income is spreading between 500,000 kip and 8,000,000 kip and depends of the age (month) and the size. Sold animals Age 25 20 15 10 5 0 D a ta
Boxplot of Age; Sold animals
1200000 1100000 1000000 900000 800000 700000 600000 500000 400000 300000 P ri ce p e r h e a d
Boxplot of Price per head
3 Outputs and result
The main improvements of the goat activity are the following:
Genetic performance (introduction of improved billy and crossbreeding with the local animal)
Productivity (number of birth, weight)
Prevention and treatment of goat (vaccination, diagnostic, medicine)
Increased incomes (better price)
Sustainable of the activities (improved animal and extensive food system)
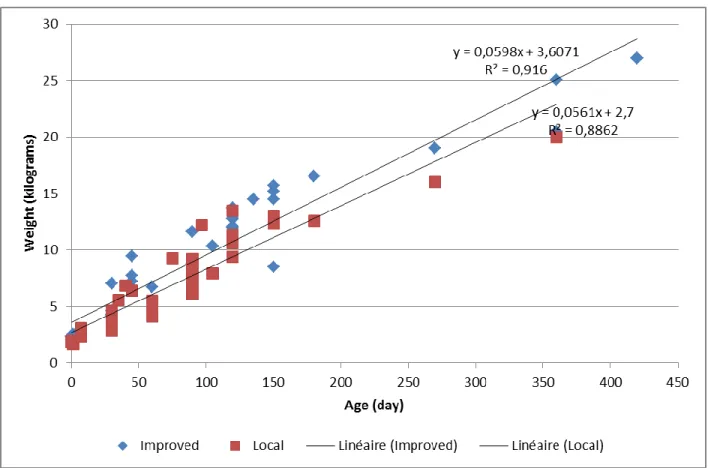
The outputs are the number of improved goats, the productivity (weight) and the beneficiaries’ households. In August 2014, the improved goats are estimated to 119 and in November 2014, the beneficiaries’ households amounted to 66. The goat number per household is estimated from 9 to 16 goats6. The increase is significant in each household but it depends of the sold goats. The households sold some goats after the project to obtain a better income and this sale decreases the goat number. The income and the price are better than before the project. The qualitative outputs are the knowledge of the diagnostic and treatment diseases. Finally, the productivity is estimated with the weight. This weight is obtained with the 75 weigh of local and improved goats. The figure 12 shows that the trend line was better for the improved goat.
6
The first data coming from the logframe of the project and the second data is the average of the survey realized in August and November 2014
Figure 12: Evolution of the improved and local goat’s weight
The main problems are linked to the disease and diarrhea. The solution for these problems is the improvement of the veterinary sector and the medicine’s access. This improvement should be developed to set up the veterinary store and the veterinarian knowledge especially the disease diagnostic, medicine treatment and vaccination. The network between the veterinarian of each village and the district authorities shall be structured.