HAL Id: hal-02122477
https://hal.archives-ouvertes.fr/hal-02122477
Submitted on 16 May 2019HAL is a multi-disciplinary open access archive for the deposit and dissemination of sci-entific research documents, whether they are pub-lished or not. The documents may come from teaching and research institutions in France or abroad, or from public or private research centers.
L’archive ouverte pluridisciplinaire HAL, est destinée au dépôt et à la diffusion de documents scientifiques de niveau recherche, publiés ou non, émanant des établissements d’enseignement et de recherche français ou étrangers, des laboratoires publics ou privés.
TeCTIC - Mesurer la préférence du choix du mode de
transport lié à l’usage des TIC pendant le temps de
déplacement
Nathan Bounie
To cite this version:
Nathan Bounie. TeCTIC - Mesurer la préférence du choix du mode de transport lié à l’usage des TIC pendant le temps de déplacement. [Rapport de recherche] IFSTTAR - Institut Français des Sciences et Technologies des Transports, de l’Aménagement et des Réseaux. 2018, 90p. �hal-02122477�
OST 2 - Innovations par les TIC et changements de comportements
-
Projet 2 - Changements de mobilité des personnes, comprendre les
comportements et définir les aménagements et les services
TeCTIC - Mesurer la préférence du choix du
mode de transport lié à l’usage des TIC
pendant le temps de déplacement
Nathan BOUNIE
Rapport Bounie N. (2018). TeCTIC - Mesurer la préférence du choix du mode de transport lié à l’usage des TIC pendant le temps de déplacement, IFSTTAR, 90 p.
Article Bounie N., Adoue F., Koning M. et L’Hostis A. (2018). Valuing Connectivity to ICTs in Public Transport: Empirical Evidence from Paris, 35 p. (work in progress, ne pas diffuser)
Conférence Bounie N., Adoue F., Koning M. et L’Hostis A. (2018). Quelle est la valeur de la connectivité aux TIC dans les transports publics ? Étude exploratoire en Île-de-France, 1ères Rencontres Francophones Transport Mobilité, Lyon
Matériaux Dossier de réponse à l’AAP DIME Quanti automne 2017 (ELIPSS) Base de données originale « LILLE VDA 2018 »
Table des matières
1 Etat de l’art ... 4
1.1 Un questionnement à la croisée des évolutions sociétales et des enjeux politiques ... 4
1.2 Usage du temps de transport dans les TC ... 4
1.3 L’usage des TIC dans les TC ... 5
1.4 L’organisation de la recherche ... 6
2 Le consentement à voyager plus longtemps pour une meilleure connectivité ... 9
2.1 Introduction ... 10
2.2 Modeling framework ... 12
2.2.1 The utility effects of connectivity to ICTs ... 12
2.2.2 Valuation of connectivity to ICTs ... 14
2.2.3 Clarifications ... 15
2.3 Data ... 16
2.3.1 Sample characteristics ... 16
2.3.2 Connectivity to ICTs and TBMT... 18
2.3.3 A typology of travelers ... 20 2.3.4 Valuation procedure ... 22 2.4 Empirical analysis ... 24 2.4.1 Econometric strategy ... 24 2.4.2 Results ... 25 2.4.3 Time multipliers ... 29 2.5 Discussions ... 31
2.5.1 Comparison with other valuation parameters ... 31
2.5.2 Socioeconomic appraisal ... 32
2.5.3 Caveats and further research ... 33
3 L’importance de l’usage de son smartphone dans son choix modal ... 35
3.1 La modélisation ... 35
3.1.1 Le modèle logit multinomial ... 35
3.1.2 Le modèle hybride à variables latentes ... 36
3.2 Les données empiriques ... 37
3.2.1 Le design de l’enquête ... 38
3.2.2 L’enquête ... 58
3.3 Le traitement économétrique ... 60
3.1 Le modèle logit multinomial simple ... 61
3.2. Le modèle logit multinomial mixte ... 62
4 Conclusion ... 63
5 Références ... 65
1 Etat de l’art
1.1 Un questionnement à la croisée des évolutions sociétales et des enjeux politiques
L’analyse de la société actuelle en tant que modernité liquide proposée par Bauman (2000), met en avant les grandes tendances à l’individualisme, à la fluidité des modes de vie, à l’accélération du rythme de l’existence, et enfin à l’usage des technologies de l’information et de la communication (TIC), en lien avec l’importance croissante de la notion de réseau social. L’idée d’une profonde transformation sociétale opérée par les TIC trouve dans ce cadre une place et une relation aux autres grandes dynamiques de la société.
Par ailleurs, la mobilité est une thématique essentielle de la compréhension des phénomènes sociaux et des trajectoires individuelles ; au point que pour certains, l’étude de la mobilité pourrait faire office de sociologie (Urry, 2007). Quel que soit le positionnement par rapport à cette thèse, on observe un large consensus quant à l’importance des mobilités dans nos sociétés, dont la mobilité dite physique est une composante essentielle. Or, ces mobilités physiques constituent un enjeu majeur de durabilité comme l’atteste, entre autres, la non décroissance de la contribution des transports aux émissions de gaz à effet de serre. Dans les politiques urbaines on observe une orientation explicite en faveur de la réduction de l’usage de la voiture, orientation notamment inscrite dans les principes des plans de déplacement urbain (Harman, L’Hostis et Menerault, 2007).
La recherche que nous souhaitons mener vise à mieux comprendre les transformations que les TIC opèrent sur la mobilité. En particulier dans un contexte où de nombreuses politiques publiques, notamment urbaines, visent à promouvoir les alternatives à l’usage soliste de l’automobile, nous cherchons à identifier les modes de transport pouvant bénéficier d’un regain d’attractivité aux yeux des individus sous l’effet de l’usage des TIC en mobilité.
Ainsi, nous nous interrogeons ici sur les facteurs qui, dans les évolutions sociétales actuelles saisies par la thèse de la modernité liquide (Bauman, 2000) en particulier l’usage des TIC, peuvent concourir à modifier l’expérience des transports, dans un sens favorable aux transports en commun (TC) plutôt qu’à la voiture personnelle (VP). Autant la VP a connu un essor lié à l’individualisme dans la période précédente, autant l’idée d’un « peak car » (Goodwin, 2012 ; Goodwin et Van Dender, 2013 ; Metz, 2013), ou d’un plafonnement de l’usage de la voiture sous sa forme actuelle, remet en cause ce paradigme.
1.2 Usage du temps de transport dans les TC
L’utilisation des TC est étroitement liée à l’utilité qu’ils procurent aux individus qui les consomment. Cette utilité peut s’appréhender à travers la notion de qualité du service de transport en commun (QSTC) qui dépend autant d’attributs quantitatifs (temps de transport, coût monétaire, fiabilité, etc.) que d’attributs qualitatifs affectant l’attitude des voyageurs (sécurité, confort, usage du temps de transport, etc.) (Cascetta et Carteni, 2014).
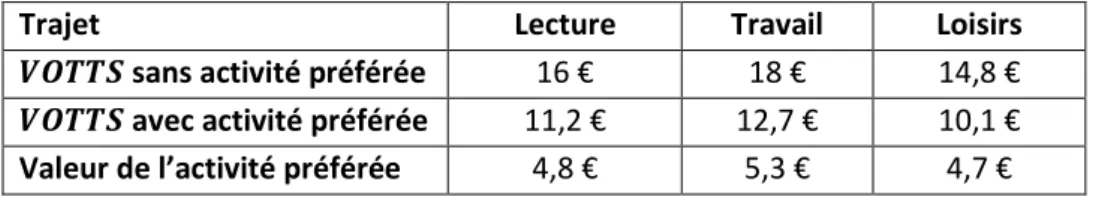
Parmi les attributs qualitatifs, se trouve l’usage du temps associé à l’activité de déplacement qui, comme le rappelle Urry (2007), est classiquement associé à une vision d’un temps improductif, exclusif et perdu, et donc un temps à réduire. De nombreux travaux relativisent ces postulats en montrant que le temps de transport peut être valorisé (Meissonnier, 2001 ; Kaufmann, 2002 ; Lanéelle, 2003 ; Flamm, 2004 ; Urry, 2007 ; Jain et Lyons, 2008 ; Adoue, 2016). Parce qu’ils permettent aux voyageurs de « freed their hands from the steering wheel » (Urry, 2007) les TC permettent de déployer des activités pendant le temps de transport (transport-based multitasking, TBMT) et donc de « remplir » la réserve de temps que cette dernière constitue, participant ainsi à augmenter l’utilité qui leur est associée (Ettema et Verschuren, 2008 ; Malokin, Circella et Mokhtarian, 2015). Certains travaux empiriques récents vont même jusqu’à proposer de prendre en compte différentes valeurs tutélaires du temps de déplacement (𝑉𝑂𝑇𝑇𝑆) dans les analyses coûts-avantages des infrastructures de transport, selon que ce temps de déplacement soit associé à d’autres activités ou non (Adjenughwure, 2017 ; Banerjee et Kanafani, 2008 ; Varghese et Jana, 2018).
Table 1.1 – Valeurs du temps en fonction du niveau de TBMT (€/hr)
Trajet Lecture Travail Loisirs
𝑽𝑶𝑻𝑻𝑺 sans activité préférée 16 € 18 € 14,8 €
𝑽𝑶𝑻𝑻𝑺 avec activité préférée 11,2 € 12,7 € 10,1 €
Valeur de l’activité préférée 4,8 € 5,3 € 4,7 € Source : d’après Adjenughwure (2017)
1.3 L’usage des TIC dans les TC
Les technologies de l’information et de la communication (TIC) – qui peuvent se définir comme « l’ensemble des technologies et services électroniques utilisés pour traiter, stocker et diffuser de l’information, afin de faciliter l’exécution d’activités humaines liées à l’information, fournis par et se mettant au service des secteurs institutionnel et privé, comme du grand public » (Adoue, 2016) – peuvent « équiper la mobilité » et ainsi améliorer le ressenti du temps de transport dans les TC. En effet, en quelques années les activités numériques se sont largement invitées dans l’espace-temps de déplacement (Keseru et Macharis, 2017). Ces activités ne sont, le plus souvent, pas des activités spécifiquement déployées à cette occasion, mais des activités également déployées à d’autres moments de la journée.
Aujourd’hui, le smartphone – instrument des TIC qui regroupe à la fois les propriétés du téléphone portable et de l’ordinateur (Adoue, 2016) – est considéré comme l’un des principaux vecteurs de déploiement d’un nombre important d’activités relatives à la communication, à la navigation, à l’information, et au divertissement pendant le temps de déplacement associé aux TC (Julsrud et Denstadli, 2017). Cependant, les différentes activités offertes par le smartphone peuvent diminuer l’utilité associée aux TC, par les nuisances qu’elles peuvent générer, en augmentant par exemple le risque d’interactions non souhaitées et en diminuant les possibilités d’anti-activité (par exemple ne rien faire ou dormir) pour un individu et pour ses voisins (Julsrud et Denstadli, 2017) qui peuvent être réalisées pendant les temps de transport.
Ces éléments sont mis en évidence par l’étude empirique menée par Ettema et Verschuren (2008) qui montre que les TIC – et notamment les smartphones – comme support du TBMT ne se traduisent pas
nécessairement sur la satisfaction que retirent les voyageurs de leurs moyens de transport. A l’inverse, dans le travail de Frei, Mahmassani et Frei (2015), le TBMT supporté par les TIC – indépendamment de leur support – joue sur la satisfaction subjective des voyageurs pour leur mode de transport.
Concernant l’impact du TBMT supporté par les TIC sur les choix modaux, les résultats des différentes études sont une fois encore relativement partagés. D’abord, le travail d’Adoue (2016) montre le rôle joué par les smartphones sur le déploiement d’activités, mais également la non significativité de leur rôle en faveur d’une plus grande utilité du temps de déplacement et donc d’une préférence pour les TC. Pour leur part Malokin, Circella et Mokhtarian (2017) identifient un impact, néanmoins relativement faible, des ordinateurs et des tablettes sur la préférence des voyageurs pour les TC dans le cadre de leurs voyages professionnels. De plus, cette étude met en évidence que les milléniales, qui se caractérisent par un usage plus intensif des TIC, attachent plus d’importance aux possibilités de TBMT dans leurs choix modaux que les non- milléniales. Enfin, Julsrud et Denstadli (2017) mettent en évidence la manière dont l’usage des smartphones peut modifier, ou du moins refléter, l’attitude des voyageurs vis-à-vis des TC. En effet, les auteurs identifient trois groupes d’utilisateurs des smartphones qui sont caractérisés par une attitude différenciées à l’égard des TC :
- Les utilisateurs actifs (32%) – qui sont caractérisés par une utilisation de l’ensemble du potentiel offert par leurs appareils (communication, navigation, coordination, information et divertissement) – sont les plus critiques vis-à-vis de la QSTC (seuls 11% considèrent qu’il n’existe aucune barrière à l’usage des TC) ;
- Les utilisateurs passifs (44%) – qui sont caractérisés par une utilisation moyenne des usages offerts par leur smartphone, et principalement orientée vers la communication et l’information – sont 15% à penser qu’il n’existe aucune barrière à l’usage des TC ;
- Les sous-utilisateurs (24%) – qui n’utilisent presque pas leur smartphone, et uniquement pour un usage de communication – ont l’attitude la plus positive vis-à-vis de la QSTC, 29% considèrent qu’il n’existe aucune barrière à l’usage des TC.
A la suite de ces différents éléments, nous formulons l’hypothèse que dans les évolutions sociétales actuelles, certains supports des TIC, particulièrement les smartphones, peuvent concourir à modifier l’expérience des transports dans un sens favorable aux TC plutôt qu’à la VP.
1.4 L’organisation de la recherche
L’objectif de cette étude est de participer à une meilleure connaissance de la QSTC à travers une analyse quantitative de l’un de ses attributs qualitatifs : l’usage du temps de déplacement. A la suite des différents travaux exploratoires introduits précédemment, nous cherchons à modéliser l’impact d’une variable explicative, l’usage des TIC – en particulier l’usage des smartphones – sur une variable dépendante, l’utilité associée aux TC, à travers la possibilité de déploiement de diverses activités secondaires pendant l’activité principale de déplacement (TBMT) afin de valider ou d’invalider notre hypothèse.
Dans une démarche de modélisation des choix de transport, le recueil de données est une étape indispensable (Faivre D’Arcier, 1998). Pour ce faire, deux grandes familles d’enquêtes cohabitent : des méthodes visant à recueillir des préférences « révélées » à partir de l’observation et de l’analyse des choix réellement effectués par des individus sur des marchés substituables, ou des méthodes visant à
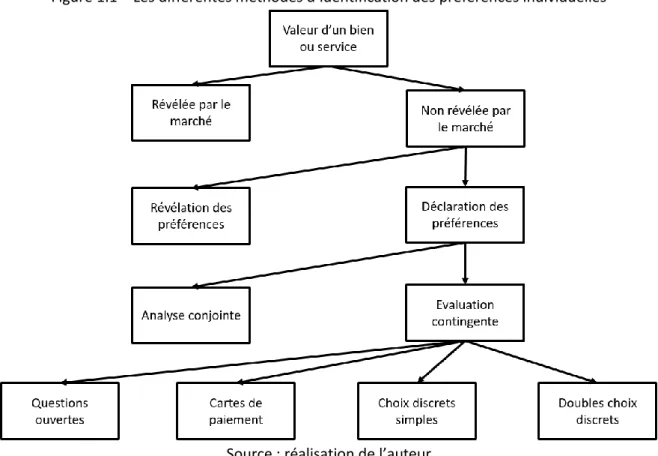
recueillir des préférences « déclarées » à partir de l’interrogation directe d’intentions d’actes d’individus confrontés à des situations hypothétiques. L’absence de marchés de transport substituables parfaitement homogènes sur l’ensemble de leurs attributs hormis sur la possibilité qu’ils offrent aux individus de se servir de leurs smartphones nous encourage à mobiliser, dans ce travail, des méthodes relevant des enquêtes de préférences déclarées (EPD). Parmi ces méthodes, il est possible d’en identifier deux principales (cf. Figure 1.1).
D’abord, des méthodes d’évaluation contingente (MEC) qui visent à interroger directement les individus sur leur consentement à payer (CAP) ou leur consentement à recevoir (CAR) pour l’amélioration ou la détérioration de leur situation, et qui peuvent mobiliser cinq différents instruments (Haab et McConnell, 2002 ; Terra, 2004) :
- Les questions ouvertes (open-ended) qui visent à questionner de manière ouverte des individus sur leur consentement pour une situation d’offre déterminée.
- Les cartes de paiement (payment cards) qui consistent à questionner des individus sur leur consentement à partir d’une liste de montants pré-spécifiés.
- Les questions fermées simples, ou choix dichotomiques simples (dichotomous choices), qui visent à interroger des individus sur leur acceptation ou leur refus d’un montant pré-spécifié (mais différencié et aléatoirement distribué au sein de différents sous-groupes) pour une situation d’offre donnée.
- Les doubles questions fermées, ou double choix dichotomiques (double-bounded dichotomous choices), qui constituent une variante des questions fermées simples par la proposition aux mêmes individus d’un deuxième montant, inférieur ou supérieur, selon leur acceptation ou refus du premier montant proposé.
- Les jeux d’enchères (bidding games) qui consistent à proposer un premier montant pré-spécifié à un groupe d’individus (pouvant ou non être différencié au sein de différents sous-groupes) puis à proposer une itération de montants ascendants ou descendants jusqu’au premier refus des répondants.
Ensuite, il est possible de mobiliser des méthodes dites d’analyse conjointe qui consistent en la réalisation de protocoles d’arbitrages entre un ensemble d’alternatives pré-spécifiées en termes de modalités d’attributs (Le Gall-Ely et Loïg, 2006). Les résultats des analyses conjointes étant très sensibles aux modalités des attributs constituant les différentes alternatives (Pons, 2011), il est nécessaire de connaître au préalable de l’administration d’une enquête les habitudes de transport des individus enquêtés.
Figure 1.1 – Les différentes méthodes d’identification des préférences individuelles
Source : réalisation de l’auteur
Afin d’analyser cette QSTC au regard de notre hypothèse, nous nous interrogerons dans un premier temps sur la valeur qu’accordent les voyageurs aux possibilités d’usage de leur smartphone pendant le temps de déplacement via une méthode relevant de l’évaluation contingente, cherchant à déterminer un « consentement à voyager plus longtemps » (CVL) des voyageurs pour un meilleur accès à leur smartphone dans les TC, ainsi que ses principaux déterminants (Partie 2). Cette partie reposera essentiellement sur l’analyse économétrique des résultats d’une enquête réalisée en 2015 dans le contexte francilien par Adoue (2016).
Dans un deuxième temps, nous enrichirons ce travail d’une méthode relevant de l’analyse conjointe visant à déterminer l’importance que les voyageurs attachent à la possibilité d’utiliser leur smartphone pendant leur temps de déplacement dans leurs choix modaux (Partie 3). Cette deuxième partie reposera essentiellement sur l’analyse économétrique des résultats d’une enquête menée entre mai 2018 et juillet 2018 dans le contexte lillois.
2 Le consentement à voyager plus longtemps pour une meilleure
connectivité
Valuing Connectivity to ICTs in Public Transport:
Empirical Evidence from Paris
113/08/18 – Work in progress (please, do not diffuse) Nathan Bounie (East Paris University – IFSTTAR/AME/LVMT)
François Adoue (6t Conseils)
Martin Koning (East Paris University – IFSTTAR/AME/SPLOTT) Alain L’Hostis (East Paris University – IFSTTAR/AME/LVMT) Abstract:
As opposed to personal vehicles’ drivers, public transport (PT) users may perform secondary tasks during their main travel activity, thus softening the corresponding utility cost. Moreover, Information and Communication Technologies (ICTs) could interact positively with “multi-tasking” possibilities by allowing individuals consuming their travel time in more diversified conditions.
This article attempts to value the connectivity to ICTs in PT, based on stated preferences of 501 PT users living in the Paris region. Surveyed individuals were confronted to hypothetical trade-offs between travel time reductions and improvements in the connectivity to ICTs.
Econometric analyses show that valuations for an improved connectivity are larger when individuals realize various tasks with connected devices during their trips, and lower when they face many connectivity troubles in the reference situation. Whereas individual heterogeneity has a modest direct impact, we propose a typology of PT users that captures variations in connectivity valuations.
On the average, the subjective value of the travel time should be reduced by 16% in the case Paris PT users would enjoy an optimal connectivity to ICTs. Alternative time multipliers are proposed and some policy implications are discussed.
Keywords: Connectivity to ICTs; travel-based multi-tasking; public transport; stated preferences; time multipliers.
1 Authors acknowledge Guillaume Monchambert and François Combes for comments on previous versions of this
draft. This research also benefited from useful suggestions made by participants of “Rencontres Francophones Transports et Mobilité” (Vaulx-en-Velin, France, Juin 2018). Nathan Bounie and Alain L’Hostis received financial support from the French Government, from the Hauts-de-France region and from the European Regional Development Fund (ERDF) as part of the “ELSAT 2020” research contract.
2.1 Introduction
For economists, transport choices are linked to the utility flows steaming from the different options available to individuals, a function of both objective (time, money) and subjective (comfort, reliability, safety) travel characteristics (Ortuzar and Willumsen, 2001; Cascetta and Carteni, 2014). As opposed to private vehicles’ drivers, it is worth noting that public transport (PT) users may perform additional (secondary) tasks during their main (primary) travel activity (Urry, 2007 ; Lyons, Jain et Holley, 2007 ; Keseru et al., 2015), thus reducing the corresponding utility cost. Following this intuition, a growing body of research (see the extensive reviews by Clayton and Jain (2015) and by Keseru and Macharis (2017); and case studies by Berliner et al. (2015); Circella et al. (2012); Ettema and Verschuren (2008) among others) has focused on the interplays between travel choices, individuals’ satisfaction and the so-called concept of “travel-based multi-tasking” (TBMT)2, with a strong interest on modal shift
potentialities towards PT (Frei, Mahmassani et Frei, 2015 ; Malokin, Circella et Mokhtarian, 2015). Moreover, this strand of literature has been recently magnified with the permanent development of Information and Communication Technologies (ICTs) that may help individuals “consuming” their travel time in more pleasant and/or productive conditions (Banerjee and Kanafani, 2008 ; Pawlak et al., 2015 ; Adoue, 2016 ; Wardman and Lyons, 2016 ; Julsrud and Denstadli, 2017 ; Malokin et al., 2017)3.
To fix ideas, consider one PT user who buys a new smart phone. Even if her travel time remains costly, the in-vehicle activities made possible thanks to this connected device – send emails to colleagues, browse information web-sites, purchase foods or clothes in e-stores, play on-line... – may improve the ridding experience as compared to her previous condition of “low-connected” traveler. This simple example thus highlights the potential utility effects of ICTs and TBMT options that depend on (at least) two moderating factors. First, the degree of connectivity to internet and/or phone networks is critical, especially in the case of underground PT where service breakdowns are likely to occur more often as compared to outdoor modes (e.g. buses or tramways). Second, idiosyncratic characteristics of travelers may also be influential: The more or less pronounced taste of individuals for ICTs, as well as their varying ability to use smart phones and tabs, could strongly impact the utility effects of any intervention aimed at up-grading the quality of connectivity to ICTs in PT, hence the possibilities of TBMT.
This article attempts to value connectivity to ICTs in PT, from the travelers’ perspective and in relation with TBMT. For that purpose, we rely on the contingent valuation methodology and we exploit original survey data collected late 2015 over 500 PT users living in the Paris region. Surveyed individuals were confronted to hypothetical trade-offs between varying travel time reductions and improvements in
2 Following (Kenyon et Lyons, 2007), we define “travel-based multi-tasking” (TBMT) as performing secondary
activities during the travel activity, that it be active (e.g. car driver) or passive (e.g. train passenger). In our approach, TBMT refers to the possibility of performing activities other than the travel activity while traveling (“simultaneous-tasking”), and also to the analysis of the multiplication of activities during the travel time (“task-switching”) (Circella, Mokhtarian et Poff, 2012).
3 For other studies, ICTs in PT can cause feelings of isolation and thus reduce the satisfaction resulting from their
the connectivity to ICTs, allowing us to propose an indirect assessment of the latter characteristic. Our contributions to the literature are twofold.
Whereas “stated preferences” (and to a least extent “revealed preferences”) have been analyzed in various contexts and places to value many dimensions of PT convenience – in-vehicle or on-platform crowding, reliability, vehicles interior design, travel information… (see the extensive review by OECD ITF (2014)) –, studies focused on the connectivity to ICTs and on the potentials for TBMT remain scarce to date. Valuable exceptions are (Ettema et Verschuren, 2008), (Malokin, Circella et Mokhtarian, 2017), (Pawlak, Polak et Sivakumar, 2017) and (Varghese et Jana, 2018). These authors in fact show how the possibilities to perform ICTs-related activities during the travel time, particularly thanks to a good level of connectivity, increase the benefits of the TBMT and influence the utility cost of the mobility. By looking at urban PT used by commuters, this article adds empirical evidence on this emerging research topic and corroborates the importance of these factors to travelers. In particular, we find that the value put on connectivity improvements is heterogeneous regarding current ICTs usages during trips, as well as regarding the perceived quality of connectivity in PT.
Second, the Paris region case study is particularly interesting in its own right. With more than 3,200 km of (subway, regional rail and tramway) tracks, Parisian rail-based PT systems have received around 3,145M trips in 2015 (OMNIL, 2018). As a consequence, the network is one of the most heavily used in Europe (UITP, 2015). Focusing only on Paris subway, it can be estimated that around 947,000 hours were consumed in-vehicles at that date4. Since French official reports regularly point-out the low
quality of connectivity to phone or internet networks in Parisian underground PT (ARCEP, 2015), we easily understand that assessing the hedonic value put by individuals on this travel dimension is of prime interest for both academic and operational purposes. Our results could thus be useful to policy makers willing to launch investments to improve the connectivity to ICTs in PT, as currently planned in the Paris region5.
The rest of this article proceeds as follows: Section 2.2 introduces the theoretical framework used to value connectivity to ICTs in PT in relation with TBMT. The survey data mobilized to test this model empirically are then described (Section 2.3). The econometric analyses (Section 2.4) are useful to identify the driving factors of valuations for an improved connectivity to ICTs in Paris PT but also to derive central estimates. Section 5 puts our main results in perspective and calls for further research.
4 According to OMNIL (2018) Paris subway has received 7,721M passenger*kilometers in 2015. Assuming that
the 260 working days account for 81% of the yearly traffic and considering one average commercial speed of 25.4 km/h, we can estimate the total amount of time daily spent in subway.
5 One of the two major Paris region PT operators (RATP) currently intends to deploy the 4G wireless technology
over its railway network, with the help of the Paris region PT regulator. Initially planned for 2015, this investment program (for a total public spending of 400M euros) has faced major delays because of civil engineering problems but also due to the complexity of contractual agreements to be found with phone/internet service providers. According to the last announcements, the 4G technology should be deployed at the 2019 horizon. Whereas stated preferences have been analyzed to value trains’ punctuality, information availability or in-vehicle crowding (Kroes et al., 2006, 2013 ; Haywood et Koning, 2015 ; de Lapparent et Koning, 2016), we are not aware of any study that proposes such parameters for connectivity improvements, hence the relevancy of this research.
2.2 Modeling framework
2.2.1 The utility effects of connectivity to ICTs
For the sake of simplicity, we consider one representative PT mode and we neglect mode choice. We classically specify the utility function of the traveler 𝑖 as:
𝑈𝑖 = 𝛼 + 𝛽𝑚𝑖+ 𝛿𝑡𝑖+ 𝜌𝑋𝑖 (2.1)
where 𝑚𝑖 represents the out-of pocket expenditures, 𝑡𝑖 refers to the travel time spent in PT and 𝑋𝑖 is
a vector of individual/ trip characteristics that affect traveler 𝑖’s utility.
The parameter 𝛿 (< 0) describes the marginal disutility of the travel time consumed in PT services. It is critical here because we model the utility effects of TBMT and of connectivity to ICTs as:
𝜕𝑈𝑖
𝜕𝑡𝑖
= 𝛿𝑘 = 𝛿0+ 𝛿1𝐶𝑖𝑘+ 𝛿2𝑀𝑖𝑘+ 𝛿3𝑀𝑖𝑘𝐶𝑖𝑘 (2.2)
where 𝐶𝑖𝑘 is the degree of connectivity to ICTs in PT and 𝑀𝑖𝑘 represents the number of tasks performed
by the traveler 𝑖 during her trip with smart phones, laptops or tabs. Without loss of generality, both variables are first considered as discrete, with index 𝑘 = 𝐻 referring to “high” level of connectivity and TBMT whereas index 𝑘 = 𝐿 refers to “low” level of attributes. Moreover, we assume that 𝛿0<
0 < 𝛿1𝐶𝑖𝑘+ 𝛿2𝑀𝑖𝑘+ 𝛿3𝑀𝑖𝑘𝐶𝑖𝑘.
Equation (2.2) stipulates that (“ceteris paribus”):
- The better the connectivity to ICTs in PT (𝐶𝑖𝐻> 𝐶𝑖𝐿), the less painful the travel time for
individual 𝑖 (𝛿𝐿< 𝛿𝐻< 0), for a given level of TBMT (𝑀
𝑖𝐻 = 𝑀𝑖𝐿);
- The larger the number of tasks performed by traveler 𝑖 during the PT trip with connected devices (𝑀𝑖𝐻 > 𝑀𝑖𝐿), the less painful her travel time (𝛿𝐿< 𝛿𝐻 < 0), for a given level of
connectivity to ICTs (𝐶𝑖𝐻= 𝐶𝑖𝐿);
- The better the connectivity to ICTs (𝐶𝑖𝐻> 𝐶𝑖𝐻) and the larger the number of tasks performed
by traveler 𝑖 during the PT trip with connected devices (𝑀𝑖𝐻 > 𝑀𝑖𝐿), the less painful her travel
time (𝛿𝐿< 𝛿𝐻 < 0).
There are good reasons to assume that connectivity to ICTs and potentials for TBMT affect travelers’ utility in proportion to the travel time spent in PT services. Actually, Ettema et al. (2012), (Frei, Mahmassani et Frei, 2015) and Mokhtarian et al. (2015) find that an increase in travel time causes a decrease in the subjective satisfaction of the journey, but performing secondary activities during trips, in particular those involving social interactions, may increase individuals’ satisfaction, or at least decrease the dissatisfaction caused by “unpleasant” journeys. For (Connolly, Caulfield et Mahony, 2009) and (Hislop et Axtell, 2009) a good connectivity to ICTs can support TBMT possibilities, which may improve and diversify the travel time use. (Axtell, Hislop et Whittaker, 2008), (Gripsrud et Hjorthol, 2012) and Lyons (2013) show in the case of professional journeys that if PT is equipped with “sound” technologies, in particular a good connectivity to phone/internet networks, carriages can be
considered as a “mobile office” (Clayton et Jain, 2015) in which travelers can work, thus increasing the journey utility. Starting from an theoretical model of time allocation, and coupling a discrete choice model, a hazard-based model and a log-linear model through copulas techniques, (Pawlak, Polak et Sivakumar, 2017) question the relationships between time allocation and productivity in the case of business travelers by rail in the United Kingdom. Their empirical test shows that the use of ITCs during the travel is associated with a longer duration of work activities, even if the level of productivity is reported to be lower than in offices.
Within our simpler theoretical framework6, the degree of connectivity to ICTs and the associated
possibilities of TBMT will affect the value of travel time savings (𝑉𝑂𝑇𝑇𝑆𝑘), i.e. the marginal rate of substitution between time and money resources:
𝑉𝑂𝑇𝑇𝑆𝑘 = 𝜕𝑈𝑖 𝜕𝑡𝑖 𝜕𝑈𝑖 𝜕𝑚𝑖 =𝛿 𝑘 𝛽 = (𝛿0+ 𝛿1𝐶𝑖𝑘+ 𝛿2𝑀𝑖𝑘+ 𝛿3𝑀𝑖𝑘𝐶𝑖𝑘) 𝛽 (2.3)
When the level of connectivity to ICTs and/or the degree of TBMT increase, so does the numerator (i.e. it becomes less negative), thus reducing 𝑉𝑂𝑇𝑇𝑆 (𝑉𝑂𝑇𝑇𝑆𝐻 < 𝑉𝑂𝑇𝑇𝑆𝐿). In other words, specification (2.2) postulates that the generalized cost of PT usage is lower in the case travelers would enjoy a good connectivity to ICTs, allowing them to spend their travel time in a more productive and/or pleasant way via TBMT. This is in line with past empirical evidence. Analyzing a survey collected on PT users in the Netherlands, Ettema et Verschuren (2008) show that listening music can reduce the 𝑉𝑂𝑇𝑇𝑆 by 69%. Using data from the Netherland Railways Panel, Adjenughwure (2017) find that trips during which professional travelers can perform their preferred activities (reading, working or listening music) lead to a reduction of 𝑉𝑂𝑇𝑇𝑆 between 42% and 46%. For leisure travelers, the decrease in 𝑉𝑂𝑇𝑇𝑆 is 6% when listening music is possible, 18% in the case of improved working conditions and 73% if they can read. Moreover, Varghese et Jana (2018) show in the case of Mumbai PT (India) that the 𝑉𝑂𝑇𝑇𝑆 of commuters who perform connected TBMT can be reduced by 25% if they use smart phones to read and by 37% if they visit social media. Based on survey data collected in Northern California, Malokin, Circella et Mokhtarian (2017) additionally show that the age is positively related to the 𝑉𝑂𝑇𝑇𝑆: Millennials (these people born after 1980) have a 𝑉𝑂𝑇𝑇𝑆 15.5% lower than the non-millennials, because the former have a higher propensity to use ICTs (which is a proxy of TBMT) during their trips
7.
Importantly, limitations in our survey data avoid us estimating 𝛽, hence a direct assessment of 𝑉𝑇𝑇𝑆𝑘. For that reason, we instead mobilize an indirect approach inspired from the contingent valuation literature.
6 We recognize that the 𝛽 parameter may also depend on the level of connectivity to ICTs in PT. For the sake of
simplicity, we ignore this dimension in our theoretical model and we only question, during our empirical exercise, the influence of PT fares on the value put on connectivity.
7 The study by Steer Davies Gleave (2016) shows that business travelers are willing to pay a higher ticket fare of
+17% to improve the internet service from “no connection” to “low connection”. The stated fare increase to improve the service from “low connection” to “medium” is equal to +4%. Regarding leisure travelers, Steer Davies Gleave (2016) estimate corresponding willingness to pay of +13% and +5% respectively.
2.2.2 Valuation of connectivity to ICTs
The contingent valuation methodology has been historically designed to value “non-market goods”, especially in the field of environmental economics (Haab et McConnell, 2002). As opposed to analyses that look at real behaviors (revealed preferences), it confronts individuals to hypothetical scenarios in order to determine the (equivalent or compensatory) variation in economic resources that make them indifferent between two “states of nature”, hence studying their stated preferences.
For reasons that will be made explicit in the next Section, our contingent scenarios involve trade-offs between improved connectivity to ICTs and reduced travel times, instead of more expensive PT fares as done in Steer Davies Gleave (2016) for instance. More precisely, we want to determine the “absolute reduction in travel time” (𝐴𝑅𝑇𝑇𝑖) that equalizes the utility flows experienced by the individual 𝑖 across
“optimally” (index 𝑜) and “as currently” (index 𝑐) connected PT services (𝐶𝑖𝑜> 𝐶𝑖𝑐):
𝑈𝑖𝑜 = 𝛼 + 𝛽𝑚𝑖+ (𝛿0+ 𝛿1𝐶𝑖𝑜+ 𝛿2𝑀𝑖+ 𝛿3𝑀𝑖𝐶𝑖𝑜)𝑡𝑖+ 𝜌𝑋𝑖
= 𝛼 + 𝛽𝑚𝑖+ (𝛿0+ 𝛿1𝐶𝑖𝑐+ 𝛿2𝑀𝑖+ 𝛿3𝑀𝑖𝐶𝑖𝑐)(𝑡𝑖− 𝐴𝑅𝑇𝑇𝑖) + 𝜌𝑋𝑖 = 𝑈𝑖𝑐
(2.4)
where the TBMT variable (𝑀𝑖) is now exogenous and does not depend on the state of nature.
Equation (2.4) can be re-written as:
𝐴𝑅𝑇𝑇𝑖 =
𝑡𝑖(𝛿1(𝐶𝑖𝑐− 𝐶𝑖𝑜) + 𝛿3𝑀𝑖(𝐶𝑖𝑐− 𝐶𝑖𝑜))
(𝛿0+ 𝛿1𝐶𝑖𝑐+ 𝛿2𝑀𝑖+ 𝛿3𝑀𝑖𝐶𝑖𝑐)
(2.5)
It is straightforward to show that the valuation for the connectivity to ICTs is an increasing function of the travel time spent in PT (because 𝐶𝑖𝑐− 𝐶𝑖𝑜 < 0 and 𝛿0+ 𝛿1𝐶𝑖𝑐+ 𝛿2𝑀𝑖+ 𝛿3𝑀𝑖𝐶𝑖𝑐 < 0). Moreover,
simple manipulations lead to: 𝜕𝐴𝑅𝑇𝑇𝑖 𝜕𝐶𝑖𝑐 = 𝑡𝑖(𝛿1+ 𝛿3𝑀𝑖)(𝛿0+ 𝛿1𝐶𝑖𝑜+ 𝛿2𝑀𝑖+ 𝛿3𝑀𝑖𝐶𝑖𝑜) (𝛿0+ 𝛿1𝐶𝑖𝑐+ 𝛿2𝑀𝑖+ 𝛿3𝑀𝑖𝐶𝑖𝑐) 2 < 0 (2.6) and: 𝜕𝐴𝑅𝑇𝑇𝑖 𝜕𝑀𝑖 = 𝑡𝑖(𝐶𝑖 𝑐− 𝐶 𝑖𝑜)(𝛿0𝛿3− 𝛿2𝛿1) (𝛿0+ 𝛿1𝐶𝑖𝑐+ 𝛿2𝑀𝑖+ 𝛿3𝑀𝑖𝐶𝑖𝑐) 2> 0 (2.7)
because (𝛿0𝛿3− 𝛿2𝛿1) < 0 if 𝛿0< 𝛿2𝛿1⁄ , which is satisfied according to our assumptions. 𝛿3
Equation (2.6) stipulates that individuals are asking a lower travel time reduction in exchange of an optimal connectivity to ICTs whenever they enjoy one higher reference level of connectivity. Equation (2.7) implies that PT travelers value more the optimal connectivity to ICTs whenever they perform more tasks with their smart phones or tabs during the trip.
Although the empirical analysis in Section 2.4 will test these conjectures, our favorite valuation of connectivity to ICTs is the “relative reduction in travel time”:
𝑅𝑅𝑇𝑇𝑖= 𝐴𝑅𝑇𝑇𝑖 𝑡𝑖 =(𝛿1(𝐶𝑖 𝑐− 𝐶 𝑖𝑜) + 𝛿3𝑀𝑖(𝐶𝑖𝑐− 𝐶𝑖𝑜)) (𝛿0+ 𝛿1𝐶𝑖𝑐+ 𝛿2𝑀𝑖+ 𝛿3𝑀𝑖𝐶𝑖𝑐) (2.8)
As previously, one can easily demonstrate that 𝑅𝑅𝑇𝑇𝑖 depends positively on 𝑀𝑖 and negatively on 𝐶𝑖𝑐.
Above all, Equation (2.8) may be re-written in order to formalize the link between 𝑅𝑅𝑇𝑇𝑖 and the “time
multiplier” (𝑇𝑀𝑖), a classical indicator in the literature on the valuation of PT qualitative attributes
(OECD ITF, 2014):
𝑅𝑅𝑅𝑇𝑇𝑖= 1 − 𝑇𝑀𝑖 = 1 −
(𝛿0+ 𝛿1𝐶𝑖𝑜+ 𝛿2𝑀𝑖+ 𝛿3𝑀𝑖𝐶𝑖𝑜)
(𝛿0+ 𝛿1𝐶𝑖𝑐+ 𝛿2𝑀𝑖+ 𝛿3𝑀𝑖𝐶𝑖𝑐)
(2.9)
Equation (2.9) shows that the time multiplier (the RHS) corresponds to the marginal rate of substitution between “as currently” and “optimally” connected travel times. Assume for instance that 𝑅𝑅𝑇𝑇𝑖 is
equal to 0.15, thus implying that 𝑇𝑀𝑖 is 0.85. This means that the utility cost of one minute spent in PT
with an optimal connectivity to ICTs is equivalent from individuals’ perspective to 85% of the disutility arisen from the same minute but spent with the current (lower) level of connectivity. In practice, it is enough to apply the estimated 𝑇𝑀𝑖 to one benchmark (or official) 𝑉𝑂𝑇𝑇𝑆 in order to translate into a
monetary metric the subjective value of the connectivity to ICTs in PT, moderated by the degree of TBMT (see Equation (2.3)). Such knowledge may be particularly relevant in the frame of costs-benefits analyses appraising the socioeconomic desirability of investments that improve the connectivity to ICTs in PT, as briefly discussed in Subsection 2.5.2.
2.2.3 Clarifications
Before describing the survey data used to implement this model, several precisions regarding our empirical strategy may be useful.
First, it is worth noting that econometric tests presented in Section 2.4 will not strictly stick to the structural forms defined by Equations (2.5) and (2.8). We will rather use reduced form approaches that mirror the main relationships between dependent and explanatory variables. Defining 𝜀𝑖 and 𝜖𝑖 as
random error terms that capture traveler 𝑖’s unobserved taste for the connectivity to ICTs (and considering 𝑍𝑖 as a vector of controls), we specify:
𝐴𝑅𝑇𝑇𝑖 = 𝛾0+ 𝛾1𝑡𝑖+ 𝛾2𝐶𝑖𝑐+ 𝛾3𝑀𝑖+ 𝛾4𝑍𝑖+ 𝜀𝑖 (2.10)
and:
𝑅𝑅𝑇𝑇𝑖 = 𝛾5+ 𝛾6𝐶𝑖𝑐+ 𝛾7𝑀𝑖+ 𝛾8𝑍𝑖+ 𝜖𝑖 (2.11)
To go beyond this additively linear specification of 𝐴𝑅𝑇𝑇𝑖 and 𝑅𝑅𝑇𝑇𝑖, we can consider functional forms
that allow for interaction terms between 𝑡𝑖, 𝐶𝑖𝑐 and 𝑀𝑖, in line with Equations (2.5) and (2.8). Once the
best specification identified on the basis of information criteria, we will then use the econometric predictions to determine 𝑇𝑀𝑖 (Equation (2.9)).
Second, measuring the current level of connectivity to ICTs in PT (𝐶𝑖𝑐) is not obvious. Whereas objective indicators of service quality do exist (ARCEP, 2015), they are mainly dedicated to networks’ operators and/or to regulatory bodies. By contrast, PT users only perceive a given connectivity to ICTs, which may strongly differ according to their subjective expectations about what should be a “normal” service quality. In order to account for this heterogeneity in perceptions, we will consider two alternative indicators of current connectivity to ICTs. As detailed below, the first one is a stated satisfaction score for the current quality of 2G and 3G wireless networks in Paris PT. The second indicator is the number of disturbances reported by travelers when trying to use their connected devices for different activities.
Lastly, a similar comment can be formulated for the TBMT variable (𝑀𝑖). Even if scholars have proposed
formal definitions for this concept in the frame of travel activities (Circella, Mokhtarian et Poff, 2012), TBMT remains highly subjective and specific to individuals’ habits. Whereas some estimates presented in Section 2.4 will inform 𝑀𝑖 with the number of activities realized with smart phones and tabs during
PT trips, we consider that this indicator alone does not describe TBMT. This could be much more a matter of individual skills and overall positioning regarding ICTs or time usage in general. In order to capture this heterogeneity (and to save some degrees of freedom), we will propose alternative estimates of 𝐴𝑅𝑇𝑇𝑖 and of 𝑅𝑅𝑇𝑇𝑖 where TBMT is approximated with a typology of PT users who differ
according to some key characteristics. Such clustering approach has been used by Keolis (2016) which identifies, in the frame of its Observatory of French mobility, three groups of individuals according to their expectations on PT quality of service (“Digi’mobiles”, “Connectés” and “Offlines”). (Julsrud et Denstadli, 2017) also identify, in the Norwegian case, three groups of travelers according to the use of ICTs while traveling (“Active users”, “Passive users” and “Low use”).
2.3 Data
2.3.1 Sample characteristics
The data used in this research are extracted from an on-line survey collected in 2015 with the help of the main PT operator in the Paris region (RATP), via two distinct channels8. First, a link towards the
questionnaire was included into the RATP monthly newsletter sent by email to around 400,000 travel pass’ subscribers. Because only 403 individuals took part to the survey, it was completed with 601 additional PT users hired through a dedicated access panel. This gave us an initial sample of 1,004 individuals. Unfortunately, this dataset was not directly exploitable. First, only 68% of the individuals completed the valuation question. Second, 141 travelers reported missing or partial information on
8 These data were initially collected in the frame of a PhD thesis in sociology entitled “La mobilité connectée au quotidien. Les usages du smartphone dans les transports en commun franciliens”. See Adoue (2016).
the in-vehicle travel time. Finally, we had to remove several inconsistent answers. All in all, we can work with a final dataset of 501 PT users9.
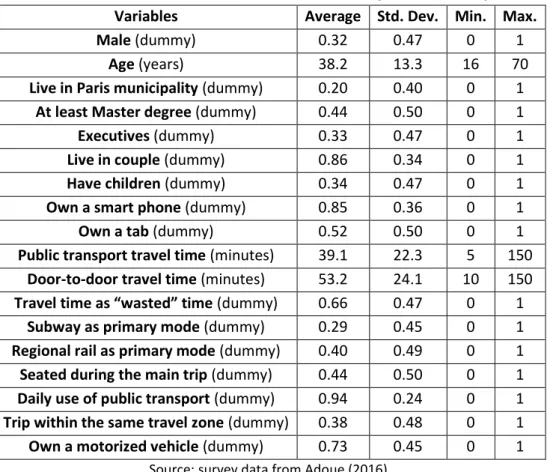
Table 2.1 reports the main individual and travel characteristics within our sample. Most of these variables can be considered as controls (𝑍𝑖) when estimating the value for connectivity to ICTs in PT,
in line with prior findings from the literature (Keseru et Macharis, 2017) but also with our valuation procedure. Importantly, questions on travel characteristics, broadly speaking, refer to the morning commute trip.
Table 2.1 – Individual and travel characteristics (501 individuals) Variables Average Std. Dev. Min. Max.
Male (dummy) 0.32 0.47 0 1
Age (years) 38.2 13.3 16 70
Live in Paris municipality (dummy) 0.20 0.40 0 1 At least Master degree (dummy) 0.44 0.50 0 1
Executives (dummy) 0.33 0.47 0 1
Live in couple (dummy) 0.86 0.34 0 1
Have children (dummy) 0.34 0.47 0 1
Own a smart phone (dummy) 0.85 0.36 0 1
Own a tab (dummy) 0.52 0.50 0 1
Public transport travel time (minutes) 39.1 22.3 5 150 Door-to-door travel time (minutes) 53.2 24.1 10 150 Travel time as “wasted” time (dummy) 0.66 0.47 0 1
Subway as primary mode (dummy) 0.29 0.45 0 1 Regional rail as primary mode (dummy) 0.40 0.49 0 1 Seated during the main trip (dummy) 0.44 0.50 0 1 Daily use of public transport (dummy) 0.94 0.24 0 1 Trip within the same travel zone (dummy) 0.38 0.48 0 1 Own a motorized vehicle (dummy) 0.73 0.45 0 1
Source: survey data from Adoue (2016).
Males represent 32% of the sample and the mean age is 38 years old. In their literature review, (Keseru et Macharis, 2017) report that both individual characteristics may affect the degree of TBMT in PT, hence the value put on the connectivity to ICTs. Paris municipality inhabitants are moderately represented (20%) and 44% of the individuals have (at least) a Master degree, thus leading to 33% of executives. Again, it may be the case that educated individuals and/or executives differ from others with respect to the use of ICTs during their trips. Regarding the familial situation, most of the surveyed people live in couple (86%) and 34% of them have one or more child. These variables control for the scheduling of individuals’ activities because our hypothetical scenarios imply changes in travel times (see below). Finally, around 85% of the sample is equipped with smart phones and 52% of the people own a tab, these devices being perhaps associated with higher valuations for connectivity.
9 We have decided not to use the “income” variable for benchmark estimates because only 409 individuals
Looking at travel characteristics, individuals spend an average 39 minutes in PT (for a total door-to-door travel time of 53 minutes). Recall that the temporal budget is expected to influence positively 𝐴𝑅𝑇𝑇𝑖, although heterogeneity in the perceived utility cost of the travel time can moderate this effect.
As such, 66% of the surveyed individuals consider their trip as a source of “wasted and unproductive” time. Regional rail and subway are the main “primary” transport modes used (40% and 29% respectively). We suspect that connectivity to ICTs is lower in subway, as compared to regional rail (but also to bus and tramway) that circulate underground only in central Paris. PT modes are essentially used on a daily basis (94%) and 44% of individuals are always seated during their trips, assuming that comfortable travels could ease TBMT10. Moreover, 73% of the sample owns a motorized vehicle (either
a private car or one motorized two-wheels, or both) and sometimes experiences” less connected” trips. Lastly, we constructed a proxy for the price of the travel pass, highly difficult to estimate in the Paris region case. Around 38% of individuals live and work in the same travel zone. It can be hypothesized that expenditures engaged by these people are lower given the pricing structure of PT in the Paris region in 201511. As such, they could be less likely to ask for a good level of connectivity to ICTs, as
compared to travelers who support more expensive fares.
An important issue relates to the representativeness of this sample with respect to the whole population of PT users in the Paris region, as generally documented by the 2010 households mobility survey (“Enquête Globale Transport”). As shown in Appendix 6.1, Table 2.12, our sample exhibits a gender bias (females are over-represented), an age bias (over-representation of old travelers), and an occupational bias (executives are over-represented). The over-representation of females is often observed in PT surveys; the age and occupational biases are probably due to the structure of the panel where only professionals and students have been interviewed. Despite these differences, we believe our sample to be heterogeneous enough in order to draw robust conclusions on valuations for connectivity improvements.
2.3.2 Connectivity to ICTs and TBMT
Two crucial ingredients for our empirical exercise are the benchmark level of connectivity (𝐶𝑖𝑐) and the
degree of individuals’ TBMT (𝑀𝑖). As explained previously, we consider different indicators for both
dimensions, whilst recognizing that proposed variables may be subject to debates.
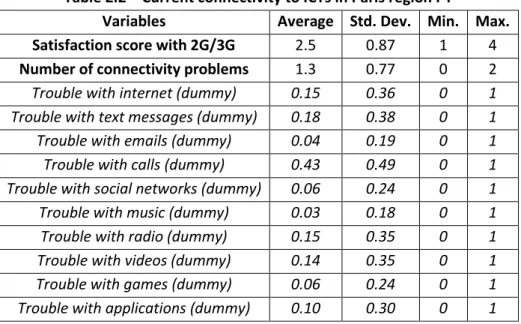
Regarding the current level of connectivity to ICTs, we will first use a stated satisfaction score describing the perceived quality of 2G and 3G wireless networks in Parisian PT. Individuals thus had to report a note ranging from 1 (“very poor quality”) to 4 (“very good quality”) for this attribute. As made clear in Table 2.2, the average satisfaction score within our sample is 2.5. Although not detailed here,
10 Investigating survey data collected on 1,000 Paris subway users, (Haywood, Koning et Monchambert,
2017)(Haywood, Koning et Monchambert, 2017) show that the “non-polychronic” use of the travel time is one of the most disturbing features of vehicle crowding. This result could come from the fact that excessive in-vehicle densities avoid travelers to read journals and books, or to use their smartphones during their trips.
11 At the time the survey was collected, the price of travel passes in the Paris region depended on five macro
travel zones, with a positive relationship between traveled distances and prices. After a reform implemented in 2016, the pricing structure has become flat. Importantly, our proxy does not account for employers’ refunding schemes that can reach up to 50% of travel passes.
around 11% of travelers have reported the lowest note (1) and 14% the best score (4). Intermediary notes (2 and 3) received the majority of answers (41% and 34% respectively).
Our second proxy for the current connectivity to ICTs is the number of troubles experienced by travelers in their use of phones or tabs in PT. Survey participants were proposed a list of activities potentially made thanks to ICTs and had to select a maximum of two items for which they face major difficulties because of low communication network quality. In average, individuals reported 1.3 connectivity problems. Only 18% of the sample did not experience any connectivity trouble whereas 53% of the individuals have faced two problems. When looking at the most disturbed activities, it appears that making a call and sending text messages are the two first items (43% and 18% respectively). Conversely, people stated they were not excessively disturbed when sending emails and/or listening to music (4% and 3% respectively).
Table 2.2 – Current connectivity to ICTs in Paris region PT
Variables Average Std. Dev. Min. Max. Satisfaction score with 2G/3G 2.5 0.87 1 4 Number of connectivity problems 1.3 0.77 0 2
Trouble with internet (dummy) 0.15 0.36 0 1
Trouble with text messages (dummy) 0.18 0.38 0 1
Trouble with emails (dummy) 0.04 0.19 0 1
Trouble with calls (dummy) 0.43 0.49 0 1
Trouble with social networks (dummy) 0.06 0.24 0 1
Trouble with music (dummy) 0.03 0.18 0 1
Trouble with radio (dummy) 0.15 0.35 0 1
Trouble with videos (dummy) 0.14 0.35 0 1
Trouble with games (dummy) 0.06 0.24 0 1
Trouble with applications (dummy) 0.10 0.30 0 1 Source: authors’ calculations from survey data.
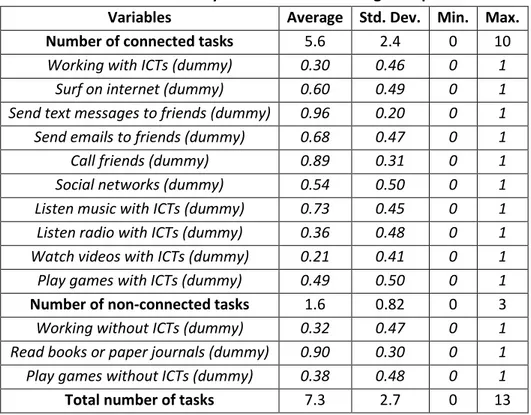
We now discuss the indicators used to assess the TBMT variable. First, individuals were asked to select activities they are (sometimes or regularly) performing in PT. The degree of TBMT is then found by adding the different dummies implied by these answers. For the sake of consistency, we distinguish “connected” and “non-connected” activities. Regarding the people who work during their trips for instance, we define as connected activities these tasks made with mobiles, tabs or laptops. By contrast, non-connected working tasks refer to those activities performed with “papers and pens”. Since our survey design proposed more connected activities than non-connected ones, the former are over-represented (Table 2.3): Individuals reported an average of 5.6 tasks realized during their PT trips thanks to ICTs, as opposed to 1.6 activities made without the assistance of phones or tabs. Both variables show large variations, with some travelers making up to 13 activities, others none. When looking at the different tasks performed in PT, items linked to communication are the most frequently quoted (96% of individuals send text messages to friends and 89% make calls). Somehow, surprisingly, working during PT trips is not systematic, with only 30% of individuals reporting such activities (with
or without ICTs). Moreover, we notice that reading paper books or journals constitutes a very common activity (stated by 90% of the sample).12
Table 2.3 – Variety of tasks realized during PT trips
Variables Average Std. Dev. Min. Max.
Number of connected tasks 5.6 2.4 0 10
Working with ICTs (dummy) 0.30 0.46 0 1
Surf on internet (dummy) 0.60 0.49 0 1
Send text messages to friends (dummy) 0.96 0.20 0 1
Send emails to friends (dummy) 0.68 0.47 0 1
Call friends (dummy) 0.89 0.31 0 1
Social networks (dummy) 0.54 0.50 0 1
Listen music with ICTs (dummy) 0.73 0.45 0 1
Listen radio with ICTs (dummy) 0.36 0.48 0 1
Watch videos with ICTs (dummy) 0.21 0.41 0 1
Play games with ICTs (dummy) 0.49 0.50 0 1
Number of non-connected tasks 1.6 0.82 0 3
Working without ICTs (dummy) 0.32 0.47 0 1
Read books or paper journals (dummy) 0.90 0.30 0 1
Play games without ICTs (dummy) 0.38 0.48 0 1
Total number of tasks 7.3 2.7 0 13
Source: authors’ calculations from survey data.
2.3.3 A typology of travelers
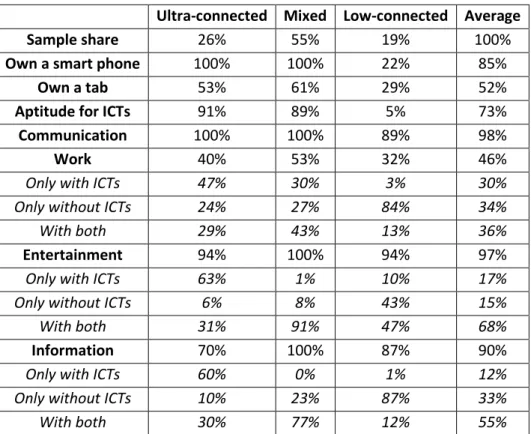
Although informative, the number of activities realized in PT could miss important features of the TBMT phenomenon. For instance, the value put on connectivity to ICTs may be impacted by the way limited time resources are consumed by individuals in other places; the level of pressure on the temporal resource during the whole day should impact an individual’ behavior during the mobility activity. In addition, it could also depend on idiosyncratic skills regarding ICTs usage. Since our survey includes many questions about these non-travel related characteristics, we may be willing to enrich our analysis with this information. In order to restrict the number of parameters to be estimated, however, we have decided to identify groups of individuals by means of a hierarchical cluster analysis (HCA) method, as done by (Julsrud et Denstadli, 2017) (see details in Appendix 6.2). Binary input factors used for this analysis are: The ownership of smart phones and/or tabs, individuals’ beliefs regarding their aptitudes for ICTs (“good” or “bad”), various dummies describing whether PT users perform some activities (regrouped into the general “work”, “communication”, “entertainment” and “information” categories) with and/or without ICTs.
As made clear in Table 2.4, three categories of PT users emerge: “Ultra-connected” individuals (26% of the sample) feel comfortable with ICTs. As such, the majority of their activities are realized with smart phones or tabs, especially for entertainment and informational purposes. By contrast,
12 We recognize one important shortfall of this TBMT variable: It only refers to the number of tasks realized during
connected” individuals (19% of the sample) are less likely to own a smart phone or a tab and they face difficulties to mobilize the many potentialities of ICTs. Logically, these people work and read information in more “classical” ways (without connected devices). Lastly, most of the sample (55%) belongs to the “mixed” category. These PT travelers mobilize both ICTs-based and classical media to work, to read information and for recreational purposes.
Table 2.4 – Typology of travelers
Ultra-connected Mixed Low-connected Average
Sample share 26% 55% 19% 100%
Own a smart phone 100% 100% 22% 85%
Own a tab 53% 61% 29% 52%
Aptitude for ICTs 91% 89% 5% 73%
Communication 100% 100% 89% 98%
Work 40% 53% 32% 46%
Only with ICTs 47% 30% 3% 30%
Only without ICTs 24% 27% 84% 34%
With both 29% 43% 13% 36%
Entertainment 94% 100% 94% 97%
Only with ICTs 63% 1% 10% 17%
Only without ICTs 6% 8% 43% 15%
With both 31% 91% 47% 68%
Information 70% 100% 87% 90%
Only with ICTs 60% 0% 1% 12%
Only without ICTs 10% 23% 87% 33%
With both 30% 77% 12% 55%
Source: authors’ calculations from survey data.
When looking at individual characteristics behind these users’ types, we see that low-connected individuals are mostly women, older than others, less educated and more likely to use regional rail as their primary transport mode. Table 2.5 also shows that users’ types greatly differ with respect to the perceived quality of current connectivity to ICTs and/or the number of activities made in PT, with or without connected devices. Again, this is especially true for low-connected travelers who are less prone to use smart phones or tabs in PT and who perceive less connectivity troubles. By contrast, ultra-connected and mixed individuals share many similarities in these respects. Put differently, the proposed clusters of PT users may be relevant to capture variations in both TBMT habits, reference level of connectivity to ICTs and individual heterogeneity13.
Table 2.5 – Users types’ characteristics
Variables Low-connected Mixed Ultra-connected
Male (dummy) 0.24 0.32 0.38
Age (years) 46.1 38.4 31.2
13 These elements are confirmed by the results of a multinomial logit aimed at identifying factors that significantly
Live in Paris municipality (dummy) 0.16 0.22 0.17
At least Master degree (dummy) 0.34 0.49 0.41
Executives (dummy) 0.25 0.37 0.30
Live in couple (dummy) 0.91 0.86 0.84
Have children (dummy) 0.34 0.36 0.28
Public transport travel time (minutes) 39.9 39.8 37.0
Door-to-door travel time (minutes) 54.5 54.2 50.1
Travel time as “wasted” time (dummy) 0.68 0.63 0.71
Subway as primary mode (dummy) 0.22 0.32 0.27
Regional rail as primary mode (dummy) 0.51 0.39 0.31
Seated during the main trip (dummy) 0.41 0.44 0.44
Daily use of public transport (dummy) 0.95 0.95 0.91
Trip within the same travel zone (dummy) 0.40 0.34 0.45
Own a motorized vehicle (dummy) 0.61 0.77 0.73
Satisfaction with 2G/3G 2.9 2.6 1.8
Number of connectivity troubles 1.4 1.5 0.9
Number of connected tasks 6.0 6.6 2.9
Number of non-connected tasks 0.9 1.9 1.7
Source: authors’ calculations from survey data.
2.3.4 Valuation procedure
Our valuation exercise is inspired from the contingent valuation methodology (Haab et McConnell, 2002). After asking survey participants whether they would be interested by any improvement in the connectivity to ICTs in PT (86% of them being interested), individuals were presented the following hypothetical choice:
“Which improvement would you prefer? One optimal connectivity to phone and internet networks in PT? Or a 10 minutes decrease in your (morning) PT travel time?”
In line with the “double-bounded” framework (Hanemann, Loomis et Kanninen, 1991), follow-up questions were implemented depending on individuals’ answers to this first scenario. Those who opted for the 10 minutes saving option were then confronted to a second choice experiment with a lower travel time reduction (5 minutes). For these individuals, the valuation exercise stopped after this second question. By contrast, travelers who initially selected the optimal connectivity option were then confronted to larger and successive travel time savings of 15, 20 and 25 minutes respectively. For these people, the choice experiment stopped as soon as the optimal connectivity option was rejected. Consequently, individuals’ answers to these hypothetical scenarios inform us about the value put on connectivity to ICTs, as approximated by the 𝐴𝑅𝑇𝑇𝑖 variable (see Equation (2.3)).
We recognize a major drawback of this contingent approach: The hypothetical gain proposed to PT users is subjective because each individual may define the “optimal level of connectivity” very differently. We consider, however, that indicators of current connectivity shown in Table 2.2 may control for such heterogeneity in perceptions. Moreover, using a temporal “payment vehicle”, instead
of a monetary one, could strongly improve the accuracy of stated preferences, a frequently pointed-out limitation of the contingent valuation methodology (Kanninen, 1995 ; Haab et McConnell, 2002). First, recall that on-line surveys have been diffused with the help of the Paris region PT operator. Therefore, individuals may have seen these hypothetical scenarios as an attempt to increase in the future the level of PT fares, with a potentially high rejection rate14. Second, we consider that proposing
more expensive PT fares would incentivize some individuals to free-ride on others’ contributions (“strategic bias”). Finally, some travelers may consider the communication network connectivity to be so low in Paris region PT that they prefer to interrupt their call before accessing the subway station, and to abstain calling while traveling. Put differently, these individuals are trading travel time against connectivity to ICTs in PT, which should reduce the so-called “hypothetical bias”.
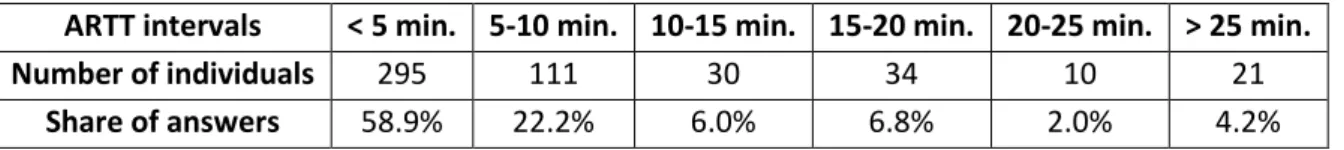
This being said, Table 2.6 shows the distribution of individuals’ answers. The majority of PT users (59%) have chosen twice the travel time savings option, their 𝐴𝑅𝑇𝑇𝑖 being consequently below 5 minutes.
The second most represented category (22%) is made of PT users who first favored the 10 minutes decrease in travel time, then the optimal connectivity option once confronted to lower time gains (of 5 minutes). Lastly, the share of individuals who highly value the connectivity to ICTs (because asking for reductions in travel time of at least 10 minutes) is moderate (19%). By censoring upper and lower intervals with reasonable thresholds (0 minute for “below 5 minutes” and the actual travel time in PT for “above 25 minutes”), the average 𝐴𝑅𝑇𝑇𝑖 amounts to 7 minutes. Regarding the median, however,
it is below 2.5 minutes, thus stressing variance in connectivity values (the standard deviation of the mean 𝐴𝑅𝑇𝑇𝑖 is 8 minutes).
Table 2.6 – Absolute reductions in travel times
ARTT intervals < 5 min. 5-10 min. 10-15 min. 15-20 min. 20-25 min. > 25 min.
Number of individuals 295 111 30 34 10 21
Share of answers 58.9% 22.2% 6.0% 6.8% 2.0% 4.2%
Source: authors’ calculations from survey data.
As argued in Section 2.2, our preferred valuation indicator is the relative reduction in travel time due to its direct relationship with the time multiplier (see Equation (2.9)) and its operational advantages. Table 2.7 highlights the distribution of the mean 𝑅𝑅𝑇𝑇𝑖 implied by individuals’ answers to the
trade-offs and by their travel times in PT. Again, we assume a minimal lower bound of 0% and a maximal upper bound of 100%. For 43% of PT users, the travel time should be reduced by 10% (or less) to provide them with the same utility flow as compared to a situation where they would enjoy an optimal connectivity to ICTs. By contrast, 23% of the travelers would need a travel time reduction of at least 30%, thus stressing that numerous people do really value connectivity to ICTs in PT. All in all, the average 𝑅𝑅𝑇𝑇𝑖 is 21.7% and shows an important variance: The standard deviation of 𝑅𝑅𝑇𝑇𝑖 is 21.9 (in
percentage points), for a median value of 13%.
Table 2.7 – Relative reductions in travel times
RRTT intervals < 10% 10-20% 20-30% 30-40% 40-50% > 50%
Number of individuals 216 106 64 31 36 48
14 Moreover, proposing higher PT fares in exchange of an optimal connectivity to ICTs would have required
Share of answers 43.1% 21.2% 12.8% 6.2% 7.2% 9.6% Source: authors’ calculations from survey data.
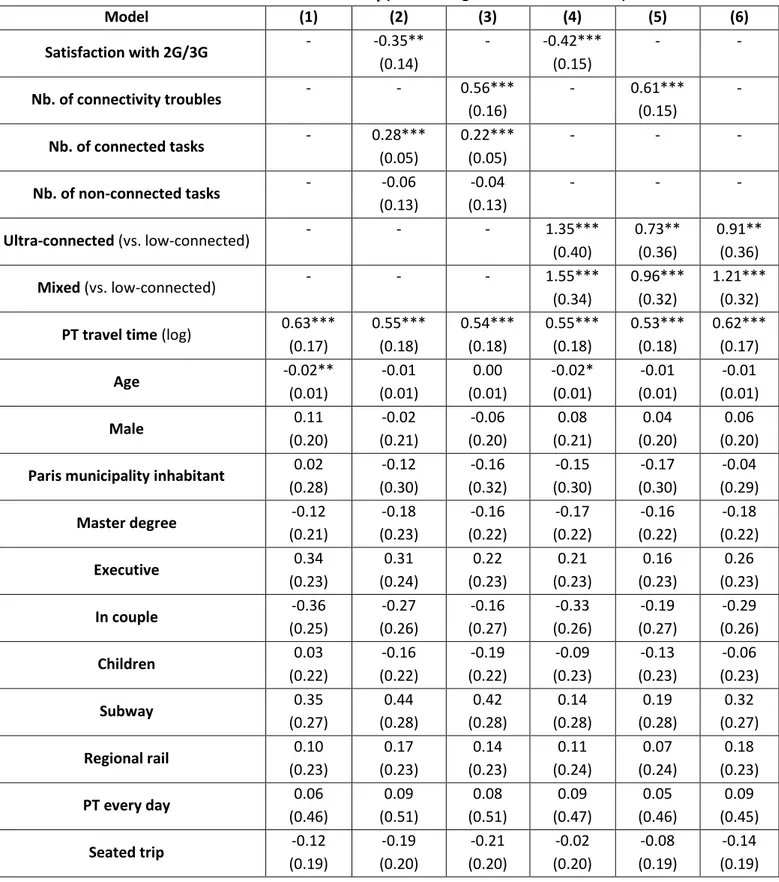
Once the empirical material presented, we can go beyond these average valuations and econometrically identify the driving factors of 𝐴𝑅𝑇𝑇𝑖 and 𝑅𝑅𝑇𝑇𝑖.
2.4 Empirical analysis
2.4.1 Econometric strategy
Individuals’ answers to the contingent experiments only inform us about intervals in which lie their “true” valuations for an optimal connectivity to ICTs in PT. As a consequence, we rely on econometric models that accommodate with “latent variables” (Long et Freese, 2001 ; Ben-Akiva et al., 2002 ; Train, 2009).
Assume for instance that the traveler 𝑖first favored the optimal connectivity option then rejected the second offer with travel time savings of 5 minutes. The probability that her stated 𝐴𝑅𝑇𝑇𝑖 (𝑆𝑡𝑎𝑡𝑒𝑑𝐴𝑅𝑇𝑇𝑖)
belongs to the second interval in Table 2.6 can be formalized as:
𝑃𝑟(𝑆𝑡𝑎𝑡𝑒𝑑𝐴𝑅𝑇𝑇𝑖 = 2𝑛𝑑) = 𝑃𝑟(5 < 𝐴𝑅𝑇𝑇𝑖 < 10) (2.12)
In line with Equation (2.10), 𝐴𝑅𝑇𝑇𝑖 depends on a vector of explanatory variables (𝐾𝑖) and of one
statistical noise (𝜀𝑖), which gives:
𝑃𝑟(𝑆𝑡𝑎𝑡𝑒𝑑𝐴𝑅𝑇𝑇𝑖 = 2 𝑛𝑑 𝐾⁄ ) = 𝑃𝑟(5 < 𝛾𝐾𝑖 𝑖+ 𝜀𝑖 < 10) (2.13)
Once the error term rearranged, the choice probability related to this second valuation category is: 𝑃𝑟(𝑆𝑡𝑎𝑡𝑒𝑑𝐴𝑅𝑇𝑇𝑖 = 2 𝑛𝑑 𝐾⁄ ) = 𝐹𝑖 𝜇𝑖(10 − 𝛾𝐾𝑖) − 𝐹𝜇𝑖(5 − 𝛾𝐾𝑖) (2.14)
where 𝐹𝜇𝑖 is the cumulative density function of the new error term 𝜇𝑖.
By considering all possible intervals and assuming that 𝜇𝑖 are EV-Type 1 i.i.d, we can estimate one
ordered logit model (see (Long et Freese, 2001 ; Train, 2009). Even if individuals’ answers do not directly lead to the intervals shown in Table 2.7, we will use a similar econometric method to investigate the determinants of 𝑅𝑅𝑇𝑇𝑖 based on these ranges15.
15 Double-bounded contingent experiments are generally analyzed with interval regression models (Hanemann,
Loomis et Kanninen, 1991 ; Lopez-Feldman, 2012 ; de Lapparent et Koning, 2016). We could not do so in this research, for two main reasons. First, some individuals faced two valuation questions whereas others were confronted to 4 hypothetical scenarios. As a consequence, we should have selected either the two first or a combination of two choices, which would reduce the amount of statistical information. Moreover, all individuals were initially proposed a 10 minutes travel time saving. This is a strong limitation because above-mentioned models require variations in the proposed bids in order to estimate the “stimulus” parameter. Hence the methodological choice in favor of ordered logit models that, can be seen as a variant of interval data models