HAL Id: dumas-03045212
https://dumas.ccsd.cnrs.fr/dumas-03045212
Submitted on 7 Dec 2020
HAL is a multi-disciplinary open access
archive for the deposit and dissemination of sci-entific research documents, whether they are pub-lished or not. The documents may come from teaching and research institutions in France or abroad, or from public or private research centers.
L’archive ouverte pluridisciplinaire HAL, est destinée au dépôt et à la diffusion de documents scientifiques de niveau recherche, publiés ou non, émanant des établissements d’enseignement et de recherche français ou étrangers, des laboratoires publics ou privés.
(Not so) Affirmative Action: Evidence From Malawi
Ucindami Mafeni
To cite this version:
Ucindami Mafeni. (Not so) Affirmative Action: Evidence From Malawi. Economics and Finance. 2020. �dumas-03045212�
MASTER THESIS N° 2020 – 04
(Not so) Affirmative Action: Evidence From Malawi
Ucindami Mafeni
JEL Codes:
Keywords:
Paris School of Economics
Master’s Thesis
(Not so) Affirmative Action: Evidence From
Malawi
Submitted By
Ucindami Mafeni
Supervisor
Liam Wren-Lewis Due Date: 14th June, 2020
Abstract
1I investigate the impact of the higher education quota that the Malawian government
instituted in 1987. The quota allocated a number of university seats to each district which was proportional to the district’s population size. I find that the quota did not have statistically significant impacts on secondary school completion or university entry, but that it did have large and negative impacts on the relative university completion rates of historically over-represented districts and districts in the Northern region . I also find evidence to suggest that the quota may have negatively impacted the long-run decisions of northern individuals to migrate to other regions. The direction and magnitude of these effects contradicts the existing literature on affirmative action in education, and may evidence the claim that the quota was intended to harm the north in favor of the south and center. I argue that affirmative action may have unexpected consequences, and that existing educational policy and limited enforcement capacity due to information constraints have serious implications on the effectiveness of affirmative action in improving societal welfare.
1
I would like to thank Prof. Liam Wren-Lewis for his supervision and support during the entirety of this venture. I would also like to thank Professors Denis Cogneau, Karen Macours and Julien Grenet for their useful insight. I am grateful to Dr. John Lwanda George Lwanda and Pastor Jere McPherson for their insight regarding the historical context and educational setting of Malawi. I also recognise Chikondi Maleta, Prof. Patrick Kambewa, Imran Chiosa, Mr Makewmba and Kalekeni Kaphale for their practical assistance.
Contents
1 Introduction 3
2 Literature Review 5
3 The Malawian Context 6
3.1 Background on Educational Inequalities . . . 6
3.2 The Structure of the Quota . . . 7
3.3 The Structure of Higher Education . . . 8
3.4 The Political Context . . . 8
3.5 The Repatriation of Northern Teachers. . . 9
4 Anticipated Effects 9 4.1 University Entry . . . 9 4.2 Pre-University Effort . . . 9 4.2.1 A Simple Example . . . 10 4.2.2 Without a Quota . . . 10 4.2.3 With a Quota. . . 10 4.3 University Completion . . . 12
4.4 Importance of the Malawian Context . . . 12
4.4.1 The Repatriation: Mismatch and Discouragement . . . 12
4.4.2 Student Perceptions and Discrimination . . . 13
4.4.3 Limited Capacity for Enforcement . . . 14
4.4.4 Annulment of the Quota . . . 14
5 Data 14 5.1 Outcomes of Interest . . . 15
5.1.1 Pre-University Effort. . . 15
5.1.2 University Entry . . . 16
5.1.3 University Completion . . . 16
5.2 Measuring Historical Over-representation . . . 17
5.3 Defining Cohorts . . . 17
6 Empirical Strategy 17 6.1 What I Would Like to Estimate . . . 17
6.2 What I can Actually Estimate. . . 18
6.3 Analytical Illustration . . . 19 6.4 Empirical Specification . . . 20 7 Results 21 7.1 Graphical Analysis . . . 21 7.1.1 Age-level Analysis . . . 21 7.1.2 Generating cohorts . . . 22 7.1.3 Cohort-level Analysis . . . 22 7.1.4 Over-representation Analysis . . . 22 7.2 Regression Analysis . . . 23 7.2.1 Interpretation. . . 24 8 Additional Analysis 24 8.1 Lifetime Outcomes . . . 24 8.2 Comparison of elites . . . 25
9 Discussion 26
9.1 Limitations . . . 26
9.2 Theoretical and Policy Implications. . . 27
9.3 Potential Extensions . . . 29 10 Conclusion 30 11 Table Appendix 33 11.1 Table 1 . . . 33 11.2 Table 2 . . . 33 11.3 Table 3 . . . 34 11.4 Table 4 . . . 35 11.5 Table 5 . . . 36 11.6 Table 6 . . . 37 12 Graph Appendix 45 12.1 Fig 1 . . . 45 12.2 Fig 2 . . . 46 12.3 Fig 3 . . . 47 12.4 Fig 4 . . . 47 12.5 Fig 5 . . . 48 12.6 Fig 6 . . . 48 12.7 Fig 7 . . . 49 12.8 Fig 8 . . . 49 12.9 Fig 9 . . . 50 12.10Fig 10 . . . 51 12.11Fig 11 . . . 53 12.12Fig 12 . . . 54 12.13Fig 13 . . . 55 12.14Fig 14 . . . 56
1
Introduction
To varying degrees, one the objectives of education policy in most developed and developing countries is to generate a more equitable distribution of educational resources and outcomes. Persistent inequalities arising from historical wrongs and discrimination in particular provide acute concern regarding fairness and equity, and often require policies which directly target the reduction of these imbalances. It is in these settings that education policy often adopts measures of affirmative action. Affirmative action, AA henceforth, in education policy refers to policies which favor minorities or disadvantaged groups in order to address their unequal education participation and attainment. In terms of higher education, these policies often take shape in the way of providing preferential admission status to the disadvantaged groups for entry into higher education institutions which they would otherwise be unable to attend. AA policies have been implemented in numerous nations (the US, India and Brazil being the most prominent examples) and are often justified as being compensation for historical wrongs (e.g. slavery, segregation and racial discrimination).
That being said, the effects of AA on both minority and nonminority student outcomes are still hotly debated. The outcomes often explored are pre-university effort, minority representation within prestigious universities and minority university graduation outcomes. Regarding pre-university effort, sophisticated structural models and quasi-experimental evidence seem to suggest that AA should motivate minority students to exert relatively more effort just before university due to reduced competition for and greater probability of attaining university seats. With regards to university entry, AA reforms have been shown to increase representation of minority racial groups and castes in Brazil, the US and India within universities. However, there is still little to no consensus on the effect of AA on arguably the most important outcome of all; university graduation. At the center of this controversy lies the mismatch hypothesis, which states that AA can actually harm minority students by allowing them to pursue a quality of university education which their previous education left them ill-prepared for. The evidence for the mismatch hypothesis is still rather inconclusive.
Nevertheless, the existing literature is still yet to address certain aspects of AA which are of interest to both researchers and policymakers alike. Firstly, the bulk of the empirical literature is based on university education in the US. While there has been a recent increase in the number of AA studies carried out in developing countries (Brazil and India being notable examples), the ironic under-representation of developing countries, particularly those from Sub-Saharan Africa, leaves room to question the generalisability of these theories and results to other contexts. Secondly, the effects of AA on "nonminority" students, namely students who are over-represented before AA is established, are relatively unexplored. This is predominantly due to educational nonminorities also being population nonminorities in most cases, such that identifying treatment effects in such a large population is often untenable. Finally, the role of existing educational policy and the extenuating political circumstances is, to my knowledge, not considered by any prominent paper in this field. Given that education policy does not occur in a vacuum, I feel that the existence of such confounding factors creates the opportunity for AA to have impacts which vastly differ from the predictions of standard theory.
In 1987, the Malawian government enforced a quota on higher education entry. The quota changed the process of university entry from one based on merit to one based on reserved seating, whereby university seats were allocated to each district on the basis of the district’s share in the country’s population. This necessitated that competition for university seats occur at the district level rather than the national level. Given that a large share of the seats were previously occupied by the smallest districts from the smallest region, the North, the quota essentially shifted university seats from the North to the central and southern regions. The aforementioned context provides a unique opportunity for me to contribute to the existing literature in the
following ways.
Firstly, it allows me to investigate the impact of an AA reform in the context of a developing country which had no salient history of inherent discrimination. This is particularly useful as not all settings in which AA may be a desirable policy have social injustice as a pretext. Secondly, it allows me to isolate the impact of AA on a nonminority group, as in this context, the educational nonminority is the population minority. Furthermore, there were aspects of the political setting at the time which served to frustrate and amplify certain aspects of quota. In particular, the government mandated repatriation of Northern teachers back to the north in 1989 likely improved the relative pre-university preparation of northern students, simultaneously undercutting the encouragement effects of the quota while exacerbating the extent of mismatch for non-northern students. Such interactions between AA and existing educational policies may allow for easier identification of the mismatch effect and, more generally, highlight the role of the existing social and political context in determining the effectiveness of AA.
I use data from the 1987 and 2008 censii to separately explore the impact of the quota. In particular, I divide the 2008 sample into age cohorts, and compare those who were likely to have been in education when the quota was enforced to those who were either too young or too old to be exposed to it. I compare the effects of belonging to a relatively over-represented districts and the northern region regional, conditional to being in an exposed cohort and not, on secondary school completion, university entry and university completion. Given that the reform AA was applied at the district level, district over-representation serves a measure of assessing the traditional impacts of AA. Regional comparisons, however, are intended to capture potential impacts which exist over and above the conventional impacts, and may arise due to region-specific differences that are driven by the political context.
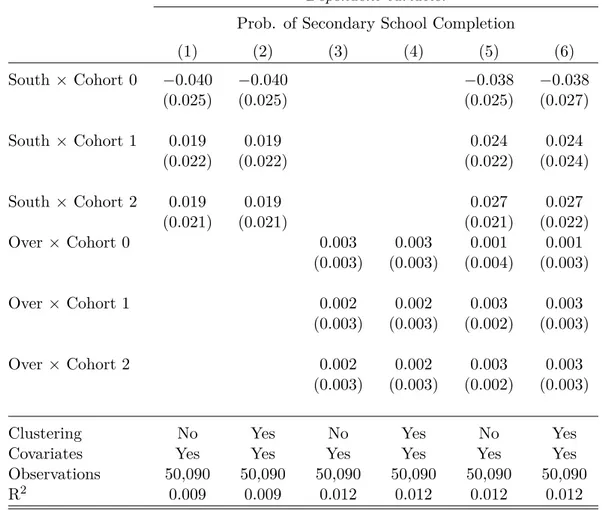
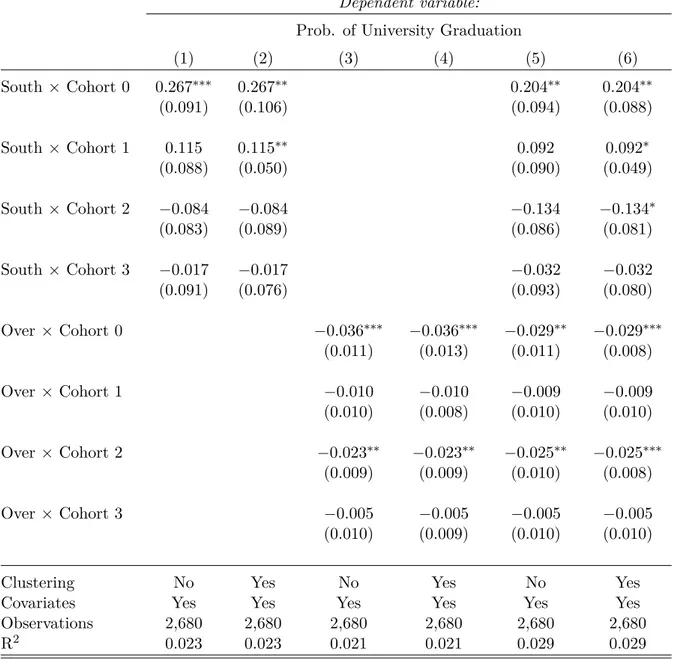
My empirical findings either fail or severely contradict the existing literature. In particular, I find no impacts of the quota on secondary school completion or university entry. However, I find the quota had large and negative impacts on over-represented districts and the northern region. I find that the university completion gap grew in favor of under-represented districts by 2.9 percentage points for each unit increase in over-representation, and that the regional gap in graduation rates over and above this grew by 20 percentage points in favor of the south. This directly contradicts the findings of higher pre-university effort and worsened university graduation prospects among minority students due to encouragement and the mismatch effect, respectively.
However, there are numerous shortcomings in my analysis due to data limitation. I do not observe pre-university effort at the intensive margin and I do not have contemporaneous data on education decisions, which may be masking some of the behavioural effects of the quota. Furthermore, I do not observe university applicants, and thus under-estimate the true population of university entrants. Nevertheless, I believe my results give me sufficient room to argue that the limited impact of the quota on secondary school completion and university entry are potentially due to the repatriation and the inability of the university to enforce the quota due to limited capacity. Furthermore, given that the regional gap is much larger than the gap due to over-representation, I believe that this suggests the existence of regional-specific impacts of the quota which go beyond the effects purported by standard theory. While the data does not give license to make any claims about what is driving these region-specific differences, the evidence does lend credence to historical sources which assert that the quota was devised to harm the north in favour of the non-northern regions in order to further consolidate the dictatorship of Malawi’s then dictator President Hastings Kamuzu Banda.
On the whole, this paper shows that the impact of AA may not necessarily conform with the existing literature in every context. In particular, if the existing set of educational policies is contradictory to the desired impact of AA and if the government does not have the capacity
to enforce AA due to information constraints, then the impacts of AA on pre-university effort and university entry may be muted. Furthermore, AA may have large and negative impacts on nonminority students if the context in which it is applied already possesses aspects of discrimination against nonminorities in favor of minorities. That is, discrimination which goes beyond positive discrimination intended to reverse an imbalance generated by a universally accepted societal wrong. However, greater work must be done to understand what the mechanisms of these aforementioned "negative impacts" are. I propose a few ways in which future research can build on this paper in order to better understand some of these underlying mechanisms.
2
Literature Review
In order to develop an understanding of the relationship between pre-university effort and AA built on micro-foundations, Bodoh-Creed & Hickman(2017) devised a seminal structural model in which students, conditional on their ability, developed varying levels of human capital in order to signal their ability to imperfectly informed universities. While this model was highly restrictive and had no exogenous variation to identify the key parameters, it did provide a framework for understanding how AA incentivised minority students to develop more human capital before university. By restricting the pool of competitors to other relatively less able minority students, AA exogenously increased the probability of university entry conditional on a student’s ability, which in turn motivatedthem to develop more human capital. Cotton et al. (2018) builds on this by providing experimental evidence of AA inducing beneficiary students to
exert relatively more effort to prepare for an in-experiment exam. A novelty of this paper is that it measured student time-use by observing the number of hours students used a computer software to prepare for the exam. However, due to the experimental design, generalisability is somewhat limited. Akhtari & Bau(2016) provided quasi-experimental evidence of AA inducing higher pre-university effort by showing that the reintroduction of AA in Texas improved the SAT scores of minorities relative to non-minorities.
It has also been a general finding that AA has increased the representation of minority students at university level, as well as students from low socio-economic status (SES) backgrounds. Hinrichs (2014) found that AA bans in the US did not reduce the representation of minority students in university at large, but it did reduce representation within selective universities and colleges. This suggests that AA created the opportunity for minority students to benefit from attending high quality institutions, and that the annulment of AA removed this benefit. Bertrand et al. (2010) found that caste-based AA increased the representation of students from low ranking
castes in university engineering degrees. Furthermore, the average SES of the student body also reduced as the displacing low-caste students also tended to come from relatively poorer families than the displaced high-caste students. These results were also mirrored byFrancis & Tannuri-Pianto (2012) in Brazil. Thus, on the whole AA tends to increase the representation of both minorities and the economically underprivileged in university when minorities are also over-represented among the poor.
However,Sander (2004) argued that AA can actually negatively impact minorities as offering them places in degrees and institutions which they are ill-prepared for essentially set-up to fail. Arcidiacono et al.(2016) applied and estimated a model of student net-returns to provide evidence for this. They outline two competing forces which determine student returns from attending a particular university course. College quality, consisting of institution-specific characteristics which improve the returns of all students, and mismatch, consisting of student-specific characteristics which define how "well suited" a student is to a particular institution. They postulate that the relatively high incompletion rates among minority students in selective programs is due to the losses of mismatch exceeding the gains of quality, such that the utility of minority students would actually be higher if AA were abolished and minority students attended less selective programs.
They find that the returns of minorities in STEM degrees within selective universities are lower than their returns in less selective universities, such that reallocating minorities to less selective programs would make them better off. While other studies find no evidence of mismatch (Bagde
et al.,2016;Hinrichs,2014;Antonovics & Backes,2013), the empirical evidence of this is not conclusive as it is unknown whether null results are due to college quality and mismatch effects offsetting one another, or universities responding to AA bans by targeting more resources at minority students.
Nevertheless, the literature on AA in higher education has two salient shortcomings. Firstly, the majority of the empirical studies are carried out in the US, leaving developing nations generally under-represented in the literature. While this has been somewhat mitigated by recent studies based in India (Bagde et al., 2016; Bertrand et al., 2010) and Brazil (Francis & Tannuri-Pianto, 2012), the scarcity of data from developing nations in this literature is notable. Consequentially, the generalisability of the present findings to other contexts may be rightly called into question. The importance of this issue is underscored by the fact that AA policies are applied in many developing nations, and generate a hotbed of controversy therein (e.g. South Africa). Secondly, very little attention is paid to post-education outcomes, such as those related to the labour market. Bertrand et al.(2010) is the only article of note which has attempted to link AA to labour market outcomes, and made the telling contribution that the labour market gains of AA for minority students are smaller than the losses of nonminority students. The lack of discussion on these outcomes is primarily due to data limitations; in practise, it very difficult to find individual data on education outcomes which can be linked to labour market data. That being said, the omission of post-education outcomes from the analysis creates a significant gap, as the obvious and crucial links between AA, education decisions and labour market outcomes are left relatively unexplored.
This paper, to my knowledge, is the first to empirically investigate the impact of the Malawian higher education quota. The limited number of studies which have investigated the quota are largely confined to qualitative and historical sources, many of which interpret it as another example of Banda’s anti-north pro-center sentiments. Carver (1990) views the quota before a backdrop of various education policies which seemed to be designed to undermine the north while benefiting the central region, Banda’s region of origin, and the southern region, which housed a non-negligible fraction of Banda’s political base. Vail(1989) goes a step further and argues that Banda’s entire presidency was one based on clientelism and cultural homogenisation, such that the culture of his own tribe became synonymous with the culture of the entire country. With regards to how Banda’s ethnocentric policies were accompanied by the systematic oppression of the northern region in particular,Mkandawire(2010) argues that the structural violence against the North in many of Banda’s policies had cultural violence at its core. In particular, he used the cultural differences which existed between the regions allowed him to legitimise the mistreatment of the northern region, and his normalisation of this mindset spread to the general population. While it is very difficult to quantify cultural violence, the finding that leaders of institutionally weak countries tend to siphon economic rents to citizens from the same ethnic group is common in the political economy literature (Kramon & Posner,2016;Franck & Rainer,2012).
3
The Malawian Context
3.1 Background on Educational Inequalities
Malawi is a landlocked country located in the South-East of Sub-Saharan Africa. It was a former British colony before achieving independence in 1964. Leadership was then assumed by President Hastings Kamuzu Banda, who ruled as an autocrat until 1994. He left the presidency after he was defeated by Bakili Muluzi in what was Malawi’s first democratic election. Malawi consists
of 3 regions; the Northern, Southern and Central. One of the first issues which the post-colonial Malawian government had to address was that of salient and persistent regional asymmetries in the educational attainment and employment outcomes. In spite of only possessing 12-13% of the country’s population, the Northern region boasted a literacy rate which doubled the national average in 1945 (Heyneman,1972) and, in the civil service in 1969, out of the 113 highest-level Malawian civil servants, the Northern Region held over 50 per cent of the places (Vail,1989). This imbalance was also reflected in the enrollment rates of Malawi’s sole higher education institution, the University of Malawi, more than two decades after its inauguration in 1964. By 1987, multiple sources claimed that the share of Northerners among entrants was as high as 50% (Posner,1995;Carver,1990). These disparities can be shown in Table (1), which evidences the North surpasses the other regions in terms of regional population shares of highest qualification and average years of schooling in 1987.
A potential source of these inequalities has been ascribed to the persistence of educational policies undertaken in the colonial era. During this era, education was predominantly supplied by church missions which established bases in various parts of the colony, and took it upon themselves to educate the surrounding population as part of a wider effort to Christianize them (Heyneman, 1972). While virtually all missions were of British origin, they possessed a degree of autonomy with regards to how they would fulfill this mandate, and the divergent philosophies of these missions, sources claim, had a tremendous impact on the trajectories of educational attainment. In particular, the mission which mainly operated in the Northern region was particularly progressive, and adapted curricula which emphasized highly skilled and academic tasks intended to prepare students for participation in leadership roles within the mission and society at large (Heyneman, 1972). On the contrary, the dominant missions in the Central and Southern Region were not equally ambitious. The typical Malawian student within their remit was rarely equipped with more than basic literacy and the ability to perform vocational tasks, with the Dutch Reformed Church Mission in the central region not even teaching English (Lamba,1984).
Of course, the reality on the ground was far more nuanced than the Northern region dominating the upper echelon of academia and the civil service with a Livingstonia-educated bourgeoisie, and being the sole region to provide key figures in the decolonisation push or post-colonial elite. The southern region also possessed a notable educated middle class which served in the civil service (Carver, 1990), and would serve as the backdrop for the infamous 1915 anti-colonial uprising led by John Chilembwe (also of southern origin). Furthermore, other factors likely influenced the trajectory of regional education and occupation outcomes, conditional on which missions which established there2. Nevertheless, the narrative which the government at the time
had, and most sources on the subject have, espoused e.g. (Vail, 1989;Mkandawire, 2010; Galafa, 2019) is that of colonial legacy being necessarily deterministic.
3.2 The Structure of the Quota
In order to deal with the imbalances in higher education enrollment and employment outcomes, the government of Malawi issued a directive mandating the The University Council of Malawi to select its students from the applicant pool on the basis of affirmative action rather than merit with effect from the academic year beginning in 1987 (Mhango,1993). This took form in the shape of the infamous Quota System, whereby: (i) each district was guaranteed 10 places; and (ii) the remaining places were shared amongst all the districts in proportion to their population sizes. The quota lasted until 1993, when it was illegalised by the Malawian high court soon after a referendum to end the one party state. Crucially, the illegalisation was on the grounds that the
2
For instance,Vail(1989) that the ethnic diversity in the northern region served as an incentive for educational pursuit, while cultural homogeneity and social norms in the centre generally frustrated it.
quota was "discriminatory and of no solid foundation" (Mhango, 1993). The anticipated winners and losers of this are both implicit and explicit. Explicitly, this reform reallocated seats from students originating from districts which were systematically over-represented in the University student-body relative to their population share, to those from districts which were relatively under-represented. Implicitly, the reform reallocated seats from students originating from the country’s Northern districts, to those from the Central and Southern districts.
3.3 The Structure of Higher Education
At the time, Malawi only had one university: the University of Malawi. Given the rarity of higher education in and of itself, seeking higher education abroad was an economic impossibility. Therefore, virtually all of Malawi’s graduates attended the University of Malawi. Higher education in Malawi typically lasted for 4 years, and university entrants would be determined on the sole basis of their performance on the exams taken at the end of the final year of secondary school. From the perspective of the university, seats were allocated based on secondary school exam performance and the requirements of the quota. The quota was applied centrally, such that the aggregate student body was mandated to be in line with quota requirements (i.e. representative of district-level population shares) while student shares within certain faculties needn’t comply with this. For instance, in a scenario of perfect compliance, we would expect the share of students from Northern districts in the total university population to be 12%, while the share of Northern students in the Accounting course could be much higher than this.
3.4 The Political Context
In order to better attribute the potential sources of the behavioural responses driving the empirical results to come, it is important to understand the political climate in which this quota was applied. In contrast to other prominent contexts in which AA has been adopted, the pre-text for AA in Malawi was not one of compensating a sub-group for decades of discrimination which resulted in their educational outcomes lagging behind the remainder of the population. Furthermore, the political climate in which AA was applied at the time was not typified by neutrality and fairness, but blatant ethno-regional favouritism and divide. From the outset of his 30 year rule, President Banda secured and consolidated his place as Malawi’s autocrat by heightening ethno-regional fractures. He then used those fractures to attract support from his own ethnic group (the Chewa in the central region) and other interest groups, while simultaneously undermining his rivals, detractors and ordinary citizens, particularly those in the North. When Banda was challenged by leading cabinet ministers from the Northern and Southern regions, the political fallout which ensued was regional in nature even though the initial disagreement was ideological. The ministers were summarily expelled, Chiefs from the Northern and Southern regions were dismissed, and numerous regoinal councils in the Northern and Southern regions were dissolved. The Central region (Banda’s region of origin) was unscathed and none of the dismissed cabinet ministers were Chewa (Banda’s tribe). Banda then used patronage to cement political support for his regime by issuing land reforms in 1965 which gave him the power to grant leases for estates throughout the country. This enabled him to use land to secure loyalty among the middle-class. Furthermore, he dispensed vast economic and strategic privileges upon the central region. Notably, the government moved the national capital from the southern to the central region, quadrupled the central region’s share in development expenditure from 11% to 40% between 1967 and 1972, and concentrated the majority of agricultural loans and economic gain to farmers in the central region (Vail,1989).
Central favoritism went hand in hand with strategic discrimination against the Southern and Northern regions, with a particular emphasis being placed on education in order to undo the northern domination of the educated elite and the civil service. A highly symbolic instance of
this was the illegalisation of the northern Tumbuka language from the press and radio, and the adoption of Chewa as the official language in 1968. This had the two pronged agenda of synonymising Malawian culture with Chewa culture and frustrating northern education prospects, as it necessitated that Chewa be taken as a subject in school which, if failed, would force the failing student to resit all exams. The Malawi Examinations Board replaced the Cambridge Overseas Examination, and made grade requirements for entry into secondary school higher for northern and southern students relative to central students. Finally, between 1973-1976 the administration within the University of Malawi and the civil service were purged of non-Chewa, southern and northern individuals in favor of Chewa candidates, in order to secure a steady stream of loyal Chewa bureaucrats. These are just a handful of numerous examples which evidence Banda’s intentions to not only advantage the central region, but also disadvantage the southern and northern regions (Vail,1989;Carver,1990).
3.5 The Repatriation of Northern Teachers
A policy reform which arose independently to the quota, but one which likely had serious interactions with it, was the repatriation of northern teachers in 1989. Following a series of speeches in which Banda accused northerners of carrying out policies to stunt development in the south and center, and allegations that northern teachers were sabotaging the academic performance of non-northern students, Banda issued an instruction that all teachers should return to teach in their regions of birth. While this was not instituted into law, compliance to this demand was sufficiently widespread for it to be felt and have telling ramifications. Carver (1990), which was written at the time, indicated that it was "implemented to a large degree, with many northern teachers having to return to lower paid jobs - or unemployment - in their own region". While there is no quantitative analysis of the impact of this reform, Mkandawire (2010) provides the anecdote of Mitundu Secondary School in Lilongwe, a school in the central
region which was reduced to just two teachers after the repatriation.
4
Anticipated Effects
4.1 University Entry
Given the findings in the literature, the nature of the quota and the setting in Malawi, it is possible to anticipate some of the potential discernible impacts of the quota, particularly regarding pre-university effort, university entry and university completion. The first and most obvious impact pertains to university entry. If the quota was perfectly enforced, we would anticipate that the share of university students originating from districts which were historically over-represented relative to their population shares before the quota would decline after the quota, such that their university shares correspond to their population shares. We would also anticipate the analogous result for historically under-represented districts, but in the opposite direction. Implicitly, the same analysis would roughly hold at the regional level. Given the over-representation of the northern districts relative to central and southern districts, we would expect the relative university share of the northern districts to also decline. This would, of course, only apply if the districts can produce enough eligible students to fill their allocated number of seats, such that the constraint binds. Conditional on this, the aforementioned effects would arise mechanically if the quota were stringently enforced.
4.2 Pre-University Effort
In order to better understand the implications of the quota on pre-university effort, let us consider a simplified thought experiment motivated by the theoretical model adapted byCotton
4.2.1 A Simple Example
Let us assume that student ability θi follows a continuous distribution and is bounded, such that
there exists a spectrum of individual abilities in the entire student population. Let us further assume that there are two districts of equal population size: the northern district, N , and the southern district, S. Let the total number of students in the North and South be equal to NN and NS, respectively, and NN = NS. Let the ability distribution of students in the South,
F (θi)S, be likelihood ratio dominated by the ability distribution in the North, F (θi)N. The most
important implication of this is that the value of θi at each quantile of the ability distribution is
higher for the North, such that the cumulative distribution function (CDF) of ability for the South is to the left of that of the North for every value of θi.
For simplicity, let us assume that university provides a positive and identical payoff, P , for all students (e.g. due to securing a financially rewarding job after graduation) and that universities select students on the sole basis of the observed human capital, hi, which students produce
(e.g. test scores). Furthermore, let us assume that there are fewer university seats, NC, than there are students in each district, such that NC < NN = NS only some students qualify for university. Let us further assume that the production of human capital is costly in terms of utility, its production technology depends positively and entirely on ability, and that this technology is identical for all students. It follows that the utility of student i corresponds to:
Ui = A × P − hi(θi), where A = 1 if the student qualifies for university and A = 0 otherwise.
Let’s assume that students are rational and maximise utility and that there is some level of human capital hi(θi) for each agent for which Ui= P − hi(θi) < 0 such that there is no incentive to go to university. It follows that the human capital exerted by each student exists in the interval hi∈ [0, hi(θi)]. It also follows that hi(θi) for low ability students is relatively low, while
that of high ability students is relatively high. Finally, let us assume that students know the entire distribution of ability, such that they know their own ability and that of every other student in the population.
4.2.2 Without a Quota
Let us now consider a scenario in which university considers students on the basis of free entry, such that a student competes with the entire population of students. It follows that, conditional on each realisation of θi being unique, there is some optimal level of human capital hi(θi)min
which results in all university seats being perfectly filled with no shortage or excess. It also follows that hi(θi)min corresponds to the maximal human capital of the marginal student who just failed to qualify. This occurs because there is perfect knowledge of student ability, and the next subsequent student to this marginally failing student would have no incentive to produce a level of human capital more than this, as this is the minimum amount needed to qualify and the production of human capital is costly. By the same logic, all other qualifying students generate human capital equal to hi(θi)min, and all non-qualifying students produce no human capital, as
there is no incentive to behave differently as far as utility is concerned.
As far as the distribution of students in university is concerned, by virtue of the dominance of
F (θi)N over F (θi)S, it follows that the share of students from the South will be less than its
population share, 50%, while that of the North will exceed its population share. This is because there will be a higher share of students in the North for whom hi(θi) > hi(θi)min. Hence, a no
quota situation results in the North being over-represented in university and the south being under-represented.
4.2.3 With a Quota
Now let us consider what may happen when a quota is introduced. The university still selects students on the sole basis of human capital production, but now allocates an equal number
of seats for students from the North and South. Thereafter, the university selects the best performers from each district to fill the allocated seats. In order to see how student behaviour changes according to student ability, we simply carry out the previous analysis but at the district level.
Let the prohibitive levels of human capital for the marginally failing students in the South and North be equal to hi(θi)
S
min and hi(θi) N
min, respectively. Given the dominance of the dominance of F (θi)N over F (θi)S, it follows that hi(θi)
S
min < hi(θi)min < hi(θi) N
min. This means that students
in the South who had no incentive to produce human capital before the quota due to their value of θi being too low now produce human capital after the quota. This is the discouragement effect
at work; the quota reduces the relative competition which Southern students face such that the level of human capital required to qualify is no longer prohibitive for low ability students. However, not all Southern students increase their human capital production. There are some students who still produce no human capital as hi(θi)
S
min is still prohibitive. Furthermore, there
are some students, those who qualified for university without the quota, who actually reduce their human capital production as the human capital required for university entry is less demanding than before.
The converse is true for the northern district. The relative competition increases, and this forces students for whom hi(θi)min< hi(θi) < hi(θi)
N
min to reduce their human capital production to
0, while the remaining subset of qualifying students increase their human capital levels above the pre-quota level. Consequently, the district shares of students in university equals their population shares, while the pre-university effort levels increase for some and decrease for others in both districts.
On aggregate, human capital (or effort) can either increase or decrease depending on the pre and post-quota effort levels, and the share of seats allocated to each district post-quota. In particular, pre and post-quota human capital are equal if
hi(θi)min = q N × h i(θi) N min+ (1 − q N) × h i(θi) S min
Where qN is the share of seats allocated to the North under a quota.
The aforementioned model is very simple and makes numerous assumptions. For instance, it assumes that schooling (or "human capital" in the model) has no inherent productive purpose beyond serving as a signal for universities. This would be in line with the Spence Model (Michael, 1973) of human capital, in which the only purpose which education serves to students is as a signal for universities to be able to discern their unobserved types. It, however, completely neglects the Beckerian perspective on the perceived role of education as a means of developing human capital (Becker, 1973). However, it still roughly captures the competitive elements of the pre-university effort decisions which students face before and after the quota.
By virtue of the quota restricting a given student’s competition pool to individuals from their own district of origin, the ability distribution of the student’s competitors effectively shifts, conditional on the student’s ability. For students from relatively under-represented districts, the quality of competition likely reduced, as the historical under-representation of their districts suggests that the level of ability of students within these districts was relatively low compared to the overall population. Lowering the ability of the student’s competition would increase the probability of the student entering university, conditional on the student’s own ability. This, in turn, may have increased pre-university effort for some students who, in absence of the quota, may have not qualified for university without the quota but now can because of the quota. The empirical literature suggests that this may be true in terms of the intensive margin (i.e. test scores), while there has been no notable research done on extensive margin effects (i.e. secondary
school completion). The converse of this would be true for over-represented (northern) districts: due to greater competition, the discouragement effect would reduce pre-university effort and attainment at the bottom of the ability distribution, while increasing it at the top.
Regarding aggregate effects, the literature suggests that the discouragement effects for the losers of AA (and indeed some winners in under-represented districts) in this respect are minimal, at least relative to the encouragement effects for the winners, such that a net-gain is possible. Even if there is a reduction in aggregate effort, there may still be gains in terms of allocative/pareto efficiency if students from under-represented districts value education more than students from over-represented districts (however, I feel this to be highly debatable in this context).
4.3 University Completion
With regards the impact of the quota on university completion, the debate in the literature gravitates around the mismatch hypothesis. Mismatch refers to a situation in which AA essentially sets up minority students to fail by allocating them seats in prestigious programs and institutions even though these students lack the required preparation to succeed. This can be illustrated by hearkening back to the exercise developed in previous discussion.
Suppose we are considering the students enrolled in the university when there is no quota applied. Every student enrolled has a level ability such that the cost of developing human capital in the entry phase was not prohibitive, in particular hi(θi) > hi(θi)min for each student. Let us call
the distribution of ability observed among Southern entrants ΘSF, where F represents free entry. When the quota is applied, the entry requirements for Southern entrants become less stringent, such that the distribution of abilities now also consists of students that were not sufficiently able to enter before the quota. In particular, those for whom hi(θi)Smin< hi(θi) < hi(θi)min. It
follows that the lower bound for the ability distribution of Southern entrants under AA, ΘSAA, is lower than that observed before ΘSF, such that Southern university students are now, on average, less able.
Suppose there were some minimum level ability required to graduate from university, θmin which
remains the same before and after the quota. Let us assume that the lower bound of abilities for the Southern students before the quota was below this value and that the upper bound was above this value, such that there was some failure already present but not all students failed. It would necessarily be the case the failure rate among Southern students would increase. If we make the analogous assumption for the Northern students, then the Northern failure rates would necessarily decrease.
With application to the Malawian context, it would be reasonable to expect that the quota increased the university failure rate in the under-represented (southern/central) districts, while potentially reducing the failure rate among over-represented (northern) districts.
4.4 Importance of the Malawian Context
While the aforementioned predictions stem from credible theoretical and empirical literature, it would also be reasonable to assume that some particularities of the Malawian context at the time would amplify certain aspects of these predictions more than others, leading to final results which may be more extreme than or somewhat contradictory to those which prevail in the existing literature.
4.4.1 The Repatriation: Mismatch and Discouragement
Corroborating the repatriation with the assertions of the mismatch hypothesis, it is possible that the repatriation may have exacerbated the mismatch effect. If northern teachers were moved
from non-northern regions to return to the north, then it suggests that the teacher-student ratio in the north, and thus the quality of schooling therein, was relatively improved compared to other regions. This suggests that student preparedness for university relatively decreased in the central and southern regions, such that the pre-existing mismatch generated by the quota may have been, ironically, reinforced. According to the theory, it would be reasonable to expect the university completion rates among southern and central entrants to be negatively impacted for cohorts who’s secondary schooling years coincided with the repatriation.
With regards to secondary school completion, the repatriation may somewhat counterbalance the discouragement effect by better equipping northern students for secondary school examinations relative to students from other regions. However, there may also be discouragement effects associated with the repatriation, such as teachers being demotivated by having to move back to the north against their will or observing their colleagues having to do so, or northern students being demoralised by the regionalism underlying the repatriation. Hence, the reinforcement in this case could go either way.
4.4.2 Student Perceptions and Discrimination
The political atmosphere in the period of the quota was one fueled by ethno-regional divisions and tensions, with the quota itself possessing implicit regionalistic undertones. This may have had two potential impacts on educational outcomes. Firstly, it may have led to disproportionately higher student discouragement in non-central regions, primarily the north, if student’s from these regions saw the quota as a veiled attempt to favour students from the centre at their expense. Secondly, it may have led to the teaching and administrative staff, and possibly students, within the university showing partiality toward students from the central region at the expense of students from the north and south.
While there is no existing survey data of student perceptions at the time, there were salient instances of student discontent toward the quota. In 1988, an issue of the Chirunga Newsletter, a Magazine produced by students attending the Chancellor College, levelled many criticisms against the University establishment, including the quota itself (Carver, 1990). When the students responsible for publishing the issue were expelled, it sparked a student-led demonstration within the University. This event is particularly striking as such outspoken criticism of the government was unprecedented and, indeed, dangerous3. Hence, these events may be indicative of serious student discontent toward the quota. WhileCarver (1990) stated that even beneficiaries of the quota were also displeased by the fact it would diminish the merit and value of their achievements, it seems reasonable to hypothesise that discontentment was asymmetrically skewed toward those who lost out from the quota, especially students from the north.
With regards to discrimination, there is, again, little to no documented evidence of this. Then again, given the nature of this subject, that should hardly serve as a surprise. Albeit so, there are aspects of the institutional context at the time that would facilitate discrimination. For instance, Kamuzu’s continual purges of the university staff and administration may have led higher incentives among university lecturers to show favoritism to students from the central region, either due to patronage-purchased loyalty or out of fear of being removed from their position. Indeed, the repatriation served as a vivid example of how Banda would treat a teaching establishment which he distrusted. These factors may have served as motivators for lecturers to provide "desirable results" by giving central students relatively higher grades and graduation probabilities.
Nevertheless, I express these conjectures with the utmost caution, especially as I do not have
3
3 of the 4 expelled students eventually left the country in fear of being arrested. Several dissenters and critics of the government were imprisoned without trial for several months and even years within the infamous Mikuyu prison.
clear-cut data on student perceptions and time-use. However, I am merely highlighting aspects of this context which may lead to results that are contradictory to those seen in other contexts. Indeed, these factors would suggest that the quota would induce relatively higher rates of failure among northern students at university level, while the mismatch hypothesis, buttressed by the repatriation of northern teachers, would strongly suggest the opposite.
4.4.3 Limited Capacity for Enforcement
In most other contexts in which AA was applied, there was reasonable room to believe that there was sufficiently credible compliance to the AA reforms. This was either due to relative ease of verification of the different groups, or the possession of sufficient information to be able to verify a student’s belonging to a certain group. For instance, Brazil and the US perform AA on the basis of race, which is verified either visually or through tracing one’s lineage through public records. Similarly, the Indian government issues caste validity certificates to verify one’s caste. However, Malawi did not have a centralised means of gathering information about individuals in the country, therefore one’s district of birth had to be self-declared. The quota likely created the incentive for students from over-represented districts to falsify their district of origin, with the lack of credible verification making it possible.
There is some evidence in the literature of students manipulating the self-declared membership to a minority group for their advantage. Francis & Tannuri-Pianto (2012) investigated the impact of racial quotas in Brazilian higher education, whereby seats were reserved for students who self-identified in their university application as being Afro-Brazilian. All students who self-self-identified in their application were later interviewed by a university panel in order to verify their claim. However, comparison of the racial identity claims made by students on their application to claims the same students made in a survey after they had matriculated suggested that the quotas raised the likelihood that dark skinned students, who thus had the ability to declare Afro-Brazilian ethnicity, self-identified as Afro-Brazilian in their application but not in the post-matriculation survey. This suggests that students only claimed Afro-Brazilian ethnicity in order to benefit from the quota, without truly identifying as being Afro-Brazilian. It further suggests that we should be cautions of potential misrepresentation when considering the Malawian context.
4.4.4 Annulment of the Quota
Finally, the annulment of the quota in 1993 also provides a hypothetical reversal of the afore-mentioned effects. In particular, students from historically over-represented (under-represented) districts may once again, in theory, have a high (low) probability of university entry. While this would only give us a rather short/medium-term impact of AA, it would still be very interesting to see how this reversal would influence all the aforementioned outcomes, if at all. This is made more significant by the fact that Kamuzu was elected out of power in 1994, simultaneously changing the political climate. A highly suppressive dictatorial regime with limited public freedoms, at least in certain domains, was replaced with a democracy. Hence, there may have been other unforeseen impacts on education behaviour which may appear in the data.
5
Data
The data to be used for estimation come from the 10% samples of the micro-data from the Malawi population censii in 1987 and 2008. While the 1998 census was also available, this data had no information on district of origin, and, therefore, could not be used. The censii data contain information on individual characteristics and education such as age, district4 of
4
It must be noted that the definition of district changed marginally for some areas between 1987 and 2008. In particular, Lilongwe, Blantyre and Zomba were divided into two separate districts each, while Neno separated
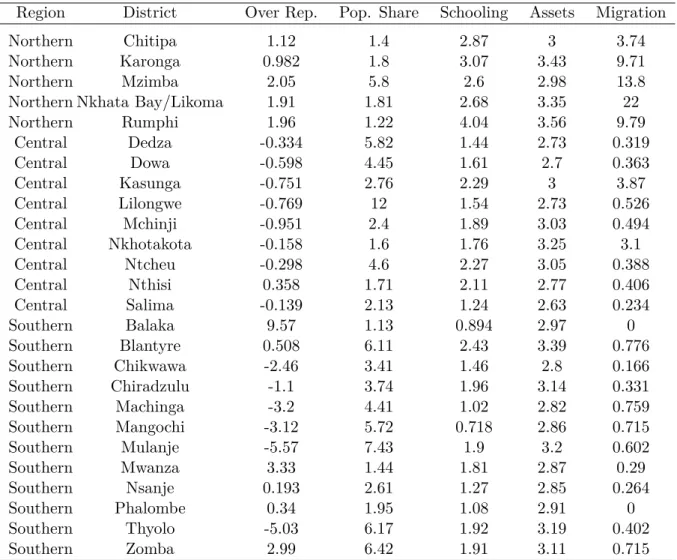
birth, district of residence, highest qualification and year of education in the Malawian schooling system and number of years of schooling. It also contains information on current occupation and asset ownership. Given that the samples are randomly drawn from a population census, they are representative at the population level. The summary statistics for the individual and and district-level characteristics are shown in tables (4) and (5) respectively.
5.1 Outcomes of Interest
Ideally, I would like to estimate the impact of the quota on pre-university effort, district/regional representation in university and university completion. I will now discuss the measures which I use to proxy for these outcomes, why I chose them and their limitations.
5.1.1 Pre-University Effort
With regards to the effect of the quota on pre-university effort, the associated outcome often used in the empirical literature is student performance in a standardised exams which universities use to select students, such as the SAT and high school GPA in the United States (e.g. ( Bodoh-Creed & Hickman, 2017)) or secondary school examinations in India (e.g. (Bagde et al., 2016)). Due this being a somewhat imprecise measure of effort, as exam performance also depends on stochastic factors (e.g. sleep the night before), this measure has been improved upon by finding some measure of time-use. For instance,Cotton et al. (2018) uses the number of times children logged into and the amount of time they spent using a revision software. However, I do not have this information at hand, as the Malawi National Exam Board, the institution which holds records of secondary school exam performance dating back to the early 1960s, does not make this information publicly available.
Therefore, I opted to use the only information available to devise an imperfect measure of secondary school effort. In particular, since I have information on the highest year of schooling, I look at the probability that an individual completes secondary school, conditional on entering secondary school. I use the conditional probability so that I can isolate the impact of the quota on the immediate transition from secondary school to university, and not other outcomes which occur prior to this (e.g. the probability of entering secondary school). While it is indeed possible that the quota influenced decisions prior to a particular stage of interest (e.g. looking at conditional university completion "disguises" the impact which the quota had on secondary school completion and university entry), it is an outcome which most obviously relates to how these impacts are investigated in the literature. For instance, secondary school effort focuses on tests which were taken in the final year of secondary school, hence limiting the sample to those who took it and excluding potential secondary school entry effects, for example. Thus, conditional probabilities are outcomes which are very fitting with the outstanding theoretical and empirical literature on the effects of AA. Nevertheless, this is still an imperfect measure nonetheless, as I may still be capturing the effect of the quota on behaviour other than effort just before university entry as shown by standardised tests (e.g. attrition during the years before the final year).
There are three variables which can be used verify secondary school completion: (i) highest education attainment achieved on the international scale (edattain); (ii) highest education attainment achieved on the International scale but with more detail (edattaind); and (iii) highest year of schooling ever achieved on the Malawi scale (educmw). edattaind is the equivalent dis-aggregation of edattain into attainment subcategories, while educmw is a further dis-dis-aggregation of edattaind into individual years and is specific to the Malawian education system. This makes
from the Mwanza to become its own district. Since the districts which existed in 1987 were likely to have been districts upon which the quota was imposed, I redefined the districts in 2008 census such that they were identical to those in the 1987 census.
the detection of the completion of various stages of education, namely secondary and tertiary, very easy. Hence, this is the strategy I use to define the outcome of interest which proxies for pre-university effort. When investigating this outcome in the regression analysis, the sample will be limited to all those who have reported completing at least one year of secondary school (i.e. secondary school entrants).
5.1.2 University Entry
I look at the probability of entering university (conditional on completing secondary school) and the share of university seats occupied by each region to see if the quota influenced university entry. This step is used to verify if there is a "first stage"; that is, to assess if the quota worked as expected and actually reallocated university seats from over-represented districts to under-represented districts. Narrowing the population to those who have completed secondary school would be consistent with the methods used in the literature. For instance, the effect of AA on minority representation at university has typically been investigated by considering the population shares of minority and nonminority groups among first-time undergraduate enrollees as an outcome of interest (Hinrichs, 2012), hence limiting the sample to those who have completed high school. The corresponding sample to be used for the regression analysis of this outcome are all those who have completed secondary school.
However, detecting entry into these stages is less perfect with the data I have available. Stage entry is not measured directly, but can be inferred by corroborating edattaind and edattain with
educmw. In particular, if edattaind and edattain indicate that an individual has accomplished a
certain stage of education (e.g. primary school) and has also achieved at least one year of the next stage (e.g. "Secondary School, Year 1") then it suggests that the individual has begun the next stage of education. The problem with this measure, however, is that we do not consider the individuals who entered the next stage and failed to complete a year. Hence, I cannot distinguish individuals who enrolled into university, but did not finish their first year, from those who graduated from high school without pursuing any further education. Hence, the number of enrollees is underestimated.
Furthermore, conditional entry may be an inaccurate measure of university entry probability as not all individuals graduating from high school want to attend university. A better measure would be to look at the share of applicants which are accepted from each region/district (Antonovics & Backes,2013), but applicant information is unavailable5. Finally, since only one university is observed and the reform occurred simultaneously for the whole population, I can only assess the effect of the quota on district university shares graphically, as opposed to quantitatively assessing its impact by comparing student outcomes across universities which were treated at different times6.
5.1.3 University Completion
As for university completion, I look at the probability of completing university conditional on "entering" university (that is, having completed at least 1 year of university). While this outcome relates most closely to the outcomes looked at in the literature, I do not observe first year drop-outs, and this may bias my results. Any results which I find must be viewed with these limitations in mind. The corresponding sample to be used for the investigation of this outcome are all individuals who have completed at least one year of university.
5This strategy would also allow me to estimate how the composition of students changes with a diff-in-diff. 6
The primary short-coming of the variation in my data is that I cannot estimate a diff-in-diff specification of region/district shares across cohorts at the individual level while only looking at university entrants
5.2 Measuring Historical Over-representation
I chose to define over-representation as the percentage point difference between a district’s historical representation at university and its share in the population in 1987. Historical university representation refers to the average share of university seats held by a particular district in all cohorts prior to the reform. I use an average over all cohorts because I was to capture the systematic entry probabilities affiliated with a district. This, in my opinion, better captures how districts are likely to be impacted by the quota than measures like the one or two cohort lag. This is because it preserves the number of cohorts and captures long-run entry probabilities, which are likely to be more precise than short-term entry probabilities. The population share corresponds to the population share of the entire district in 1987, as I believe that this is likely to be the benchmark which the government set for the quota to reach.
The distribution of historical over-representation by district is shown Table (5). As expected, all districts in the north are over-represented and only one district in the central region is over-represented with the rest being under-represented. The southern region has a mixture of the two, and actually possesses the most over-represented district in the period, Balaka.
5.3 Defining Cohorts
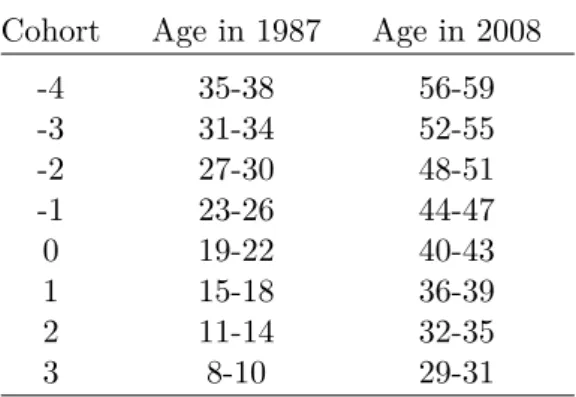
Given that the data on education is not contemporaneous, identifying the effect of the quota relies on retrospective analysis. While I have information on whether an individual eventually completed a certain level of education, I do not have information on how old they were when they did. Thus, in order to identify the effect of the reform I aggregate individuals into cohorts based on age, and observe how outcomes vary for cohorts which I believe are most likely to have been impacted by the quota. I roughly pinpoint which cohorts were the most likely to be impacted by looking at how the distributions of the outcomes of interest vary with age. Ages which show drastic discontinuities which in line with the predictions are considered potential candidates. These ages are also cross-referenced with the distribution of ages observed among students who were attending various levels of education in 1987 in order to assess whether those ages roughly correspond with education behaviour at the time. I look at a wide range of measures and ages in order to avoid misattribution of the affected cohorts, which may lead to misapprehension of the true effect of the reform.
More details of what age ranges the cohorts were divided into and how they were selected are given in the section discussing graphical analysis.
6
Empirical Strategy
Before outlining the empirical strategy, it is important to highlight what different effects are at work, what I would ideally like to estimate and what the data allows me to estimate. It is after these issues are addressed that I can then propose an empirical strategy to estimate the desired and identifiable causal impact.
6.1 What I Would Like to Estimate
Given that the quota impacts both under-represented and over-represented districts simultane-ously, there are two potential treatment effects which I would ideally want to identify. Namely, the effect of the quota on outcomes for individuals who originate from over-represented districts and on individuals who originate from under-represented districts. In an ideal and fictional scenario, both treatment effects could be identified if we simultaneously observed the outcomes of over-represented and under-represented districts with and without the quota in the time
period the quota was implemented. But given that we can only observe outcomes with the quota in the post-quota period, there is an identification problem due to missing information.
In most cases in the empirical literature, this identification problem is overcome by using a difference-in-difference (DID) estimator. In particular, for situations in which exposure to the AA reform varies over time for both minority and nonminority students, the researcher can compare the difference in outcomes between minority/nonminority students in different areas when none of the areas are treated to the corresponding difference after one of the areas is treated but the other is not. Assuming parallel trends, this DID estimator identifies the average treatment effect of AA on the minority/nonminority students7.
6.2 What I can Actually Estimate
Given that all under-represented and over-represented districts are exposed to the quota at the same time, and that there are districts who’s university shares perfectly equal their population proportions, I cannot separately recover the effects of the quota on both types of districts using DID. Nevertheless, what I can identify using DID is the effect on the quota on the difference in outcomes between over-represented and under-represented districts. That is, I can still identify how the quota, for instance, impacts the difference between the high school completion probabilities of students in over-represented districts and students in under-represented districts. However, what I cannot identify is how the separate impacts of the quota on over-represented and under-represented districts contribute to this difference. For example, I can identify whether the quota makes students from under-represented districts 10% less likely to complete secondary school than students from over-represented districts, but I cannot verify whether this is because the quota makes students from under-represented districts less likely to complete secondary school outright. It could be that the quota makes from under-represented districts more likely to finish secondary school, but that it makes the students over-represented districts even more so. Nevertheless, identifying the impact of the quota on the difference in outcomes between various districts and regions can still be useful for evaluating the validity of the claims and findings within the theoretical and empirical literature in the Malawian context. In particular, standard theory would suggest that the quota would make the difference in secondary school completion between over-represented and under-represented districts to decline. That is, we would expect pre-university effort exerted by students in under-represented districts to grow relatively to that of students in over-represented districts post-quota. Furthermore, we would expect the relative difference in university completion outcomes to grow in favor of over-represented districts post-quota due to the mismatch effect.
In fact, we would expect the quota to have a larger impact on the relative difference between the district outcomes than on the individual district outcomes themselves because the individual effects are going in opposite directions. For instance, theory predicts secondary school outcomes in over-represented districts to deteriorate while outcomes in under-represented districts improve post-quota, such that the combination of these two effects (i.e. the difference) would be larger than the individual effects. Hence, if the predictions of standard theory hold true, we would expect them to materialise in even more exaggerated fashion than what would be typically expected. However, if no differences are observed, or the differences go in the opposite direction to what the literature predicts, then it would suggest an even more extreme divergence from
7
Parallel trends refers to the assumption that the difference in outcomes between the minority/nonminority students in the different areas in the period the reform took place, had the reform not taken place, would have been identical to the difference before the reform. Hence, the outcomes of the minority/nonminority students in the untreated areas are used as a proxy for the outcomes of the students in the treated areas if the students in the treated areas were not treated. Given that the timing of the treatment varies across areas for both the minority and nonminority students, the effects of AA on both groups can be separately identified using a DID estimator. Hinrichs(2012) does this by exploiting the variation in the timing of AA bans across states in the US.