HAL Id: hal-01593550
https://hal.sorbonne-universite.fr/hal-01593550
Submitted on 26 Sep 2017
HAL is a multi-disciplinary open access
archive for the deposit and dissemination of
sci-entific research documents, whether they are
pub-lished or not. The documents may come from
teaching and research institutions in France or
abroad, or from public or private research centers.
L’archive ouverte pluridisciplinaire HAL, est
destinée au dépôt et à la diffusion de documents
scientifiques de niveau recherche, publiés ou non,
émanant des établissements d’enseignement et de
recherche français ou étrangers, des laboratoires
publics ou privés.
Effects of Frequency Distribution on Linear Menu
Performance
Wanyu Liu, Gilles Bailly, Andrew Howes
To cite this version:
Wanyu Liu, Gilles Bailly, Andrew Howes. Effects of Frequency Distribution on Linear Menu
Perfor-mance. Proceedings of the 2017 CHI Conference on Human Factors in Computing Systems (CHI ’17),
May 2017, Denver, United States. pp.1307-1312, �10.1145/3025453.3025707�. �hal-01593550�
Effects of Frequency Distribution on
Linear Menu Performance
Wanyu Liu
1,2Gilles Bailly
1,3Andrew Howes
41
LTCI, CNRS, Telecom ParisTech, Université Paris-Saclay, Paris, France
2LRI, Univ. Paris-Sud, CNRS, Inria, Université Paris-Saclay, Paris, France
3
Sorbonne Univeristés, UPMC Univ Paris 06, CNRS, ISIR, Paris, France
4School of Computer Science,University of Birmingham, Birmingham, UK
[email protected], [email protected], [email protected]
ABSTRACT
While it is well known that menu usage follows a Zipfian distribution, there has been little interest in the impact of menu item frequency distribution on user’s behavior. In this note, we explore the effects of frequency distribution on average menu performance as well as individual item performance. We compare three frequency distributions of menu item usage: Uniform; Zipfian with s=1 and Zipfian with s=2. The results show that (1) user’s behavior is sensitive to different frequency distributions at both menu and item level; (2) individual item selection time depends on, not only its frequency, but also the frequency of other items in the menu. Finally, we discuss how these findings might have impacts on menu design, empirical studies and menu modelling.
ACM Classification Keywords
H.5.2 [User Interfaces]: Interaction styles.
Author Keywords
Menus; User performance; Frequency distribution.
INTRODUCTION
Linear menus remain the primary graphical widget in desktop applications and consumer electronics for selecting commands. As a consequence many scientific efforts have been devoted to better understand user’s behavior in linear menus[2, 5, 6] and how the menu features impact performance. For instance, several empirical studies described how menu length, menu organization or target position affect performance [4, 21]. Beyond menu features, the behavior of the user is also con-strained by, and adapted to, the statistical structure of the environment [22, 23]. One important, but neglected, statisti-cal property of menu use, is that the natural ecology of tasks tends to result in menu items being selected according to a Zipfian distribution, i.e., a highly skewed distribution with the most frequent items tending to be selected far more frequently
Permission to make digital or hard copies of all or part of this work for personal or classroom use is granted without fee provided that copies are not made or distributed for profit or commercial advantage and that copies bear this notice and the full citation on the first page. Copyrights for components of this work owned by others than ACM must be honored. Abstracting with credit is permitted. To copy otherwise, or republish, to post on servers or to redistribute to lists, requires prior specific permission and/or a fee. Request permissions from [email protected].
CHI 2017, May 06-11, 2017, Denver, CO, USA
© 2017 ACM. ISBN 978-1-4503-4655-9/17/05. . .$15.00
DOI: http://dx.doi.org/10.1145/3025453.3025707
than the long-tail distribution of low frequency items. While it is well known [6, 8, 9], the consequences of the distribution for behavior have not been systematically investigated. Indeed, many previous studies rely either on a Uniform distribution [2, 4, 5, 16, 20] when comparing selection time, or a variant of a Zipfian distribution [1, 11] when focusing on the average menu selection time. However, it is unclear if these obser-vations hold when given a different, and more ecologically plausible, frequency distribution.
In this note, we investigate the effects of frequency distribu-tion on both individual Item selecdistribu-tion time and Menu selecdistribu-tion time1. To achieve this, we compare the performance of 2 Zip-fian distributions (s= 1 & s = 2) and the Uniform distribution as a baseline by carefully manipulating the item frequency factor. Our results show that frequency distributions affect user behavior at both the menu level and item level but in an opposite manner. The most surprising result is that individual item selection time does not only depend on its own frequency but also the frequency of other items in the menu. We then discuss how these effects might be of relevance to efforts to design more learnable interfaces and/or training regimes for intermediate skill-level users [3].
THE UNIFORM AND ZIPFIAN DISTRIBUTIONS
While uniform distribution does not reflect menu usage in real worlds [8, 9, 10, 12], it has been used in many menu studies [2, 4, 5, 16, 20] because it is easy to experimentally control. In contrast, Zipfian distribution is more difficult to control in spite of better modelling item frequency distribution in common applications [6, 8, 9]. It describes the fact that few items are selected very frequently while many items are seldom used. A Zipfian distribution is defined as:
f(k;s,N) = 1�ks
∑N n=1(1�ns)
(1)
Where N is the number of elements, k∈ [1,N] is the rank of the considered element (with k= 1 the element with the highest frequency) and s is the value of the exponent characterizing the distribution. For instance, for a menu with 12 items (N= 12) and s= 1, it means that the most frequent item (k = 1) is selected 12 times more often than the least frequent item. Therefore,
1We define Menu selection time as the average selection time for
the whole menu including all the items. Item selection time is the selection time for an individual item.
Frequency
distribution (decreasing order)Selection count for 12 items (RDistance2) | d
Uniform 6, 4, 4, 4, 4, 4, 4, 4, 3, 3, 3, 2 n/a | 0.26
Zipfian s=1 15,6, 5, 4, 3, 3, 2, 2, 2, 1, 1, 1 >0.99 | 0.14 Zipfian s=2 28,6, 4, 3, 2, 1, 1, 0, 0, 0, 0, 0 >0.99 | 0.19 Table 1. Distribuions used in the experiment: Names, multiset of item frequencies, the r-squared and pairwise distance. These distributions
have 4 item frequencies in common (C= 4) marked in bold.
it may trigger some confound effects if the experiment is not delicately designed, e.g., a target item might be faster to select because it is located on the top of the menu or because it is more frequently selected than other items due to practice. It results that Zipfian distribution was only used when (1) comparing the average menu selection time (rather than item selection time) of different menu techniques, or (2) assuming that the layout is similar enough so that the correspondence between item location in the menu and item frequency do not bias the results. For instance, Cockburn et al. [6] compared the Menu performance of four linear menu techniques (e.g., split menus or Morphing menus) with a single Zipfian distribution. Other studies used a variant of Zipfian distribution [1, 11] where one frequency corresponds to two items (instead of a single item). While this distribution does not have empirical or theoretical foundations, it reduces the complexity of the experimental design by diminishing the impact of the most frequent items on the total performance of the menu technique. Finally, Sears and Shneiderman [24] as well as Lee and Yoon [18] used a non-uniform distribution (which is not a Zipfian distribution). They show that the frequency distribu-tion has an impact on the choice of the most effective menu technique. For instance, Split menus and Folded menus are more efficient than traditional linear menus when the two or three most frequent items appear respectively more than 30% and 90% of the time. However, these studies did not use a Zipfian distribution "in order to control experimental complex-ity" [18] and focused only on the average menu selection time rather than item selection time.
The definition of the frequency distribution thus differs be-tween experiments and is rarely manipulated while this factor might have an impact on performance and menu design.
USER STUDY
In this study we primary investigate the effects ofFREQUENCY DISTRIBUTION,ITEM FREQUENCY, on both item selection time and
menu selection time, but we also controlTARGET LOCATIONand PRACTICE. The core aspect of the experimental design is the
control of the correspondence betweenTARGET LOCATIONin the
menu andITEM FREQUENCYto compare item selection time. To
achieve this, we subtly manipulateFREQUENCY DISTRIBUTIONso
that each distribution has a a subset of items with the same frequency for comparison purpose. To focus on the main effects, we considered a single menu length with 12 items and a single menu organization (Unordered). We now detail the experimental design.
Frequency Distributions and Item Frequency
FREQUENCY DISTRIBUTION. We considered 3 frequency
distribu-tions: two Zipfian distributions with s= 1 and s = 2 as well as Uniform distribution as a baseline.
ITEM FREQUENCY. The definition of the item frequency should
satisfy some constraints in order to precisely compare item performance:
1. The total duration of the experiment should not exceed one hour. From a pilot study, we estimated that the total number of selections should be limited to 48 per block.
2. Each condition has the same number of selections per block. 3. Item frequency should be adapted so that the item selection
count per block is an integer.
4. The distance between the generated and the original dis-tributions should be as close as possible. We used R2to
measure their similarity as in [6]. We also used Pairwise dis-tance (d) as R2is not appropriate for Uniform distribution.
The distance d: d= 1 N× � � � ��N i=1(Gi−Oi) 2 (2)
Where Giis the generated and Oiis the original frequency
distribution. Both distances are given in the table 1. 5. The distributions should maximize the number of item
fre-quencies that they have in common for comparison purpose. This constraint is the most difficult to satisfy and is mea-sured as C= �Zs=1∩ Zs=2∩U� where Z and U are the sets
(without diplactes) of item frequencies for, respectively the Zipfian and Uniform distribution.
Given the above-mentioned constraints, we generated all pos-sible configurations containing between 35 and 48 selections per block. The optimal number of selection was 45 selections per block with the configurations shown in Table 1. We ob-serve that the above-mentioned constraints are all met and particularly, the generated distributions are very closed from the original distributions as indicated by R2> 0.99 or d < 0.5
and the number of item selection in common (C) is 4.
Item Frequency and Target Location
The ideal design would be to counter-balance all item frequen-cies and target locations in a way that participants can test all possible configurations. However, the design space is enor-mous, which is not compatible with a feasible experiment time frame. We reduce the experimental complexity by focusing on a subset ofITEM FREQUENCYandTARGET LOCATION:
● We focused on the item frequencies shared by the three distributions (marked in bold in Table 1):6, 4, 3, 2. ● We thus chose a subset of 4 locations: 1, 4, 7, 10. We did
not consider the last item to avoid possible bias related to the last-item effect [2].
● The correspondence between item frequency and item loca-tion was counterbalanced across all participants, i.e., each selected item frequency is assigned to each target location an equal number of times.
● The other item frequencies were randomly assigned to the other item locations and participants did not have the most frequent items (15 in s=1 and 28 in s=2) at the same location across conditions.
Participants and Apparatus
Twenty-four participants (6 females), raging in age 23 to 37 years (median = 26.7,s = 3.48), were recruited from our institution and received a handful of candies for their partic-ipation. All of them were right-handed and interacted with WIMP menus regularly. The experiment was conducted on a Linux desktop at 1280× 1024 resolution with the use of mouse at the same sensibility and acceleration.
Task, Stimulus and Procedure
Participants were instructed to select the target items as fast and accurately as possible but were not informed of the fre-quency distribution they used. The sequence of action for a trial is the following. The user first moves the cursor above a button located on the bottom of the screen. Then the stimulus appears just above this button and indicates the target item. The user has to click on another button located on the upper part of the screen to open the menu, search the target item and select it. The button to display the stimulus and the one to open the menu was far enough to let enough time for participants to interpret the stimulus before opening the menu. A trial fin-ishes when the target item is selected (i.e., a wrong selection requires the user to reopen the menu to select the target item). The selection time starts when the user opens the menu and finishes when the target item is selected. Participants were forced to take a break between blocks and between conditions, but they could also take a break between trials.
Design
A repeated measures within-subject design was conducted. Each participant tested the threeFREQUENCY DISTRIBUTION. The
order of frequency distribution was counter-balanced between participants. ITEM FREQUENCYwas counter-balanced between TARGET LOCATION. For each condition, participants performed 5
blocks (PRACTICE). In summary, the design was: 24 Participants
× 3FREQUENCY DISTRIBUTION × 5 Blocks × 45 Selections =
16,200 trials.
FINDINGS
We removed trials including wrong selections (4.1%) and out-liers (0.5%). The Shapiro-Wilk normality test verified that wrong selections and outliers were randomly distributed across participants, frequency distributions and target locations. Ta-ble 2 and 3 summarize the main effects and interaction effects from ANOVA for respectively menu selection time and item selection time. The full table and additional graphs are avail-able in supplementary material. For the following section, we focus on the effects of FREQUENCY DISTRIBUTIONandITEM FREQUENCYeffects on Menu and Item selection time.
Menu Selection time
We used the whole data set (15,455 trials) to analyze menu selection time. Fig.1-Left features an overview of Menu
Factors df, den F p
FREQUENCY DISTRIBUTION(FD) 2, 46 58.4 < 0.0001
PRACTICE(P) 4, 92 98.8 < 0.0001
FD × P 8, 184 79.2 < 0.001
Table 2. Effects ofFREQUENCY DISTRIBUTIONandPRACTICEon Menu
selection time. 0 1 2 3 4 1 2 3 4 5 Selection time (s) Block ID Uniform Zipfian s=1 Zipfian s=2 0 1 2 3 4 6 4 3 2 Item frequency Uniform Zipfian s=1 Zipfian s=2
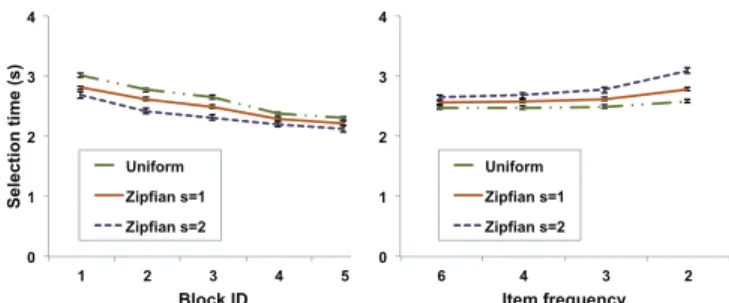
Figure 1. Left: Menu selection time in 3FREQUENCY DISTRIBUTION
across blocks. Right: Individual Item selection time in 3FREQUENCY
DISTRIBUTION. Factors df, den F p FREQUENCY DISTRIBUTION(FD) 2, 46 24.1 < 0.001 ITEM FREQUENCY(IF) 3, 69 12.5 < 0.05 TARGET LOCATION(TL) 3, 69 11.9 < 0.05 PRACTICE(P) 4, 92 31.2 < 0.001 FD × IF 6, 138 18.7 < 0.05 FD × TL 6, 138 13.3 < 0.05 FD × P 8, 184 29.8 < 0.001 IF × TL 9, 207 7.8 < 0.05 IF × P 12, 276 17.5 < 0.001
Table 3. Full factorial ANOVA on Item selection time. Only significant
effects regardingFREQUENCY DISTRIBUTIONandITEM FREQUENCYare
shown here.
selection time in 3 FREQUENCY DISTRIBUTION across blocks.
ANOVA shows a significant effect forPRACTICEwith a
post-hoc Tukey test confirming that selection time decreases over time. ANOVA also reveals an effect ofFREQUENCY DISTRIBUTION.
A post-hoc Tukey test shows that Zipfian with s= 2 (2.31s) is significant faster than Zipfian with s= 1 (2.52s) which is significantly faster than Uniform distribution (2.71s). The
FREQUENCY DISTRIBUTION ×PRACTICEinteraction effect is also
significant and shows thatFREQUENCY DISTRIBUTIONeffect
de-creases withPRACTICE, with no difference betweenFREQUENCY DISTRIBUTIONat the fifth block. This result confirms that
us-ing skewed Zipfian distributions reduces the average menu selection time since users only select a subset of items very frequently.
Item selection time
We analyzed the effect of the controlled frequency (6,4,3,2) on item selection time. (This frequency was used in a subset of 5,156 trials.) ANOVA confirmed known effects such as the effects ofTARGET LOCATIONandPRACTICE(Table 3) on Item
selection time. More interesting, ANOVA reveals a signifi-cant effect ofFREQUENCY DISTRIBUTION(FD) andITEM FREQUENCY
(fitemshort) as well as aFD× andIFinteraction effect on Item
selection time which is illustrated in Fig.1-Right. Post-hoc Tukey tests show that Item selection time increases whenITEM FREQUENCYdecreases (6: 2.58s; 4: 2.63s; 3: 2.69s; 2: 2.77s)
and that Zipfian with s= 2 (2.82s) is significant slower than Zipfian with s= 1 (2.67s) which is significantly slower than Uniform (2.53s). These results are surprising as they contrast with those obtained for Menu selection time (Fig. 1-Left) as the performances are in the opposite order. The interaction effect illustrated in Fig. 1-Right shows that the difference of Item selection time betweenFREQUENCY DISTRIBUTIONincreases when ITEM FREQUENCYdecreases. Finally, theFREQUENCY DISTRIBUTION
×PRACTICEinteraction effect reveals that the difference of Item
selection time betweenFREQUENCY DISTRIBUTIONincreases with PRACTICE. This also contrasts with the results obtained for
Menu selection time whereFREQUENCY DISTRIBUTIONshows no
difference for overall Menu selection time when users are well practized (Fig. 1-Left).
DISCUSSION
The main finding is that individual item selection time depends not only on its own frequency but also on the frequency of other items in the menu (i.e. the whole frequency distribu-tion). More precisely, items are selected faster in the Uniform distribution condition than in the skewed distribution (Figure 1-Right). This finding is surprising as it contrasts with average menu selection time illustrated in Figure 1-Left where menus with skewed distribution are faster to select than menus with Uniform distribution.
It is reasonable to expect that the Hick-Hyman Law (HHL) [13, 15] should offer an explanation for this phenomenon, since it demonstrates that human response time is a function of the information conveyed by a particular stimulus. More precisely, HHL indicates that response time is a linear func-tion of H, the weighted surprisal value (also called average uncertainty) [25], H= −∑ pi×log2(pi) with piis the
proba-bility of appearance of an item. While HHL may reflect the phenomenon observed for the average menu selection time (i.e. skewed distributions are faster to select), it is unclear how it can be applied to individual item selection time. The original Hick’s [13] and Hyman’s [15] experiments only con-cerned the whole distribution, yet later studies [6, 25] have applied HHL to individual item selection time: The former claimed that "decision time depends on the entropy of each item" T = a + b × (−log2(pi)) [6] and the latter introduced
−log2(pi) as "surprisal value for a particular trial" [25].
How-ever, there has been no validation for this application. More importantly, HHL applies only to expert users. In the original experiments [13, 15], participants were trained for more than 8,000 practice trials before starting the test. In contrast, our study involves novice and intermediate users [17].
Instead, the phenomenon might be explained by assuming that users maintain a probability distribution over item locations and that they continually update this distribution, perhaps us-ing Bayes rule, as new evidence is observed. Importantly, this model would not only involve updating the location distribu-tion of the target item but of all items that would be viewed during search for the target item. We refer to this as inciden-tal learning because the model would learn about items that are incidental to the target. Importantly, with this model, the location of the small number of frequent target items in a Zip-fian distribution would be learnt very quickly but once these locations were learnt, incidental learning would be reduced because the model would move directly to the target without visiting medium and low frequency items. In contrast, the location of items in the Uniform distribution would be learnt more evenly with incidental learning distributed over the lo-cation distribution of the entire set of items. This increased use of incidental learning in Uniform distributed menus would give the learning advantage observed in the experiment.
Implications
A correctly parameterized distribution of menu items is es-sential for ecologically valid investigation of menus. Intu-itively, Zipfian distributions lead to faster overall performance, counter-intuitively, they lead to slower performance of indi-vidual items with matched probability. These results have implications both for scientists testing theories and for prac-titioners conducting usability testing. In the former case the validity of a theory of interaction will be questionable in the absence of a parameterized distribution. In the latter case, the validity of the claim that one interface is better than another may depend on the ecologically determined distribution. Modeling. There is a continuous effort to encapsulate HCI knowledge by building models of users’ behavior. Recently, models of menu performance [2, 5, 6] do not only predict average menu selection time, but also item selection time. Our results indicate that we should take frequency distribution into account when modeling menu performance so that the distribution is correctly parameterized and the investigation is ecologically valid.
Menu design. In real life, command selection with radical Zipfian distribution is ubiquitous (i.e., Copy and Paste). In-deed, analyses of software containing many commands such as AudoCad show that users only use a subset of the available commands [19]. This implies that users’ performance is often impaired by not using the appropriate functions, possibly due to the lack of awareness of the menu content [7, 14].
Using a flat frequency distribution might impair short-term performance, but it might also improve long-term performance by favoring the transition from novice to expert behavior. In-deed, when a person uses a menu, they may not only learn about the location of the target item, but also incidentally learn about the locations of non-target items, which are encountered while looking for the target. More such non-target learning will occur when more search is required for the user to find the target. In practice, the way designers assign commands or command shortcuts to software functionalities should be thought so that to improve menu awareness.
Empirical studies. Since empirical studies are essential for both modeling and menu design, we therefore advocate a bet-ter consideration of frequency distribution when elaborating experimental designs. While difficult to manipulate, our re-sults show that frequency distribution has an impact on users’ behavior and some possible interaction might occur with other factors such as task nature.
In conclusion, this work advances the knowledge of menu selection by a better understanding of the impact of item fre-quency and frefre-quency distribution on both item and menu selection time. This effect is counter-intuitive but relevant to efforts to design more learnable interfaces.
ACKNOWLEDGMENTS
This research was funded by Labex DigiCosme (ANR-11-LABEX-0045-DIGICOSME), operated by the French Agence Nationale de la Recherche (ANR) as part of the program “In-vestissement d’Avenir” Idex Paris-Saclay (ANR-11-IDEX-0003-02). We thank reviewers, C. Coutrix and A. Oulasvirta.
REFERENCES
1. Caroline Appert and Shumin Zhai. 2009. Using Strokes As Command Shortcuts: Cognitive Benefits and Toolkit Support. In Proceedings of the SIGCHI Conference on Human Factors in Computing Systems (CHI ’09). ACM, New York, NY, USA, 2289–2298. DOI:
http://dx.doi.org/10.1145/1518701.1519052
2. Gilles Bailly, Antti Oulasvirta, Duncan P. Brumby, and Andrew Howes. 2014. Model of Visual Search and Selection Time in Linear Menus. In Proceedings of the SIGCHI Conference on Human Factors in Computing Systems (CHI ’14). ACM, New York, NY, USA, 3865–3874. DOI:
http://dx.doi.org/10.1145/2556288.2557093
3. Suresh K Bhavnani, Bonnie E John, and Ulrich Flemming. 1999. The strategic use of CAD: an
empirically inspired, theory-based course. In Proceedings of the SIGCHI conference on Human Factors in
Computing Systems. ACM, 183–190.
4. Michael D. Byrne, John R. Anderson, Scott Douglass, and Michael Matessa. 1999. Eye Tracking the Visual Search of Click-down Menus. In Proceedings of the SIGCHI Conference on Human Factors in Computing Systems (CHI ’99). ACM, New York, NY, USA, 402–409.
DOI:http://dx.doi.org/10.1145/302979.303118
5. Xiuli Chen, Gilles Bailly, Duncan P. Brumby, Antti Oulasvirta, and Andrew Howes. 2015. The Emergence of Interactive Behavior: A Model of Rational Menu Search. In Proceedings of the 33rd Annual ACM Conference on Human Factors in Computing Systems (CHI ’15). ACM, New York, NY, USA, 4217–4226. DOI:
http://dx.doi.org/10.1145/2702123.2702483
6. Andy Cockburn, Carl Gutwin, and Saul Greenberg. 2007. A Predictive Model of Menu Performance. In
Proceedings of the SIGCHI Conference on Human Factors in Computing Systems (CHI ’07). ACM, New York, NY, USA, 627–636. DOI:
http://dx.doi.org/10.1145/1240624.1240723
7. Andy Cockburn, Carl Gutwin, Joey Scarr, and Sylvain Malacria. 2014. Supporting Novice to Expert Transitions in User Interfaces. ACM Comput. Surv. 47, 2, Article 31 (Nov. 2014), 36 pages. DOI:
http://dx.doi.org/10.1145/2659796
8. Stephen R Ellis and Robert J Hitchcock. 1986. The emergence of Zipf’s law: Spontaneous encoding optimization by users of a command language. IEEE transactions on systems, man, and cybernetics 16, 3 (1986), 423–427.
9. Leah Findlater and Joanna McGrenere. 2004. A Comparison of Static, Adaptive, and Adaptable Menus. In Proceedings of the SIGCHI Conference on Human Factors in Computing Systems (CHI ’04). ACM, New York, NY, USA, 89–96. DOI:
http://dx.doi.org/10.1145/985692.985704
10. Saul Greenberg and Ian H Witten. 1993. Supporting command reuse: empirical foundations and principles. (1993).
11. Tovi Grossman, Pierre Dragicevic, and Ravin
Balakrishnan. 2007. Strategies for Accelerating On-line Learning of Hotkeys. In Proceedings of the SIGCHI Conference on Human Factors in Computing Systems (CHI ’07). ACM, New York, NY, USA, 1591–1600. DOI:
http://dx.doi.org/10.1145/1240624.1240865
12. Stephen José Hanson, Robert E Kraut, and James M Farber. 1984. Interface design and multivariate analysis of UNIX command use. ACM Transactions on
Information Systems (TOIS) 2, 1 (1984), 42–57.
13. William E Hick. 1952. On the rate of gain of information. Quarterly Journal of Experimental Psychology 4, 1 (1952), 11–26.
14. Andrew Howes, Stephen J. Payne, and Amelia
Woodward. 2000. The Trouble with Shortcuts. In CHI ’00 Extended Abstracts on Human Factors in Computing Systems (CHI EA ’00). ACM, New York, NY, USA, 267–268. DOI:http://dx.doi.org/10.1145/633292.633448
15. Ray Hyman. 1953. Stimulus information as a determinant of reaction time. Journal of experimental psychology 45, 3 (1953), 188.
16. Gordon Kurtenbach and William Buxton. 1993. The Limits of Expert Performance Using Hierarchic Marking Menus. In Proceedings of the INTERACT ’93 and CHI ’93 Conference on Human Factors in Computing Systems
(CHI ’93). ACM, New York, NY, USA, 482–487. DOI:
http://dx.doi.org/10.1145/169059.169426
17. Roy Lachman, Janet L Lachman, and Earl C Butterfield. 2015. Cognitive psychology and information processing: An introduction. Psychology Press.
18. Dong-Seok Lee and Wan Chul Yoon. 2004. Quantitative results assessing design issues of selection-supportive menus. International Journal of Industrial Ergonomics 33, 1 (2004), 41–52.
19. Justin Matejka, Wei Li, Tovi Grossman, and George Fitzmaurice. 2009. CommunityCommands: command recommendations for software applications. In
Proceedings of the 22nd annual ACM symposium on User interface software and technology. ACM, 193–202. 20. Brad Mehlenbacher, Thomas M Duffy, and James Palmer.
1989. Finding information on a menu: linking menu organization to the user’s goals. Human-Computer Interaction 4, 3 (1989), 231–251.
21. Erik L Nilsen. 1996. Perceptual-Motor Control in Human-Computer Interaction. Technical Report. DTIC Document.
22. Stephen J Payne and Andrew Howes. 2013. Adaptive interaction: A utility maximization approach to understanding human interaction with technology. Synthesis Lectures on Human-Centered Informatics 6, 1 (2013), 1–111.
23. Peter Pirolli. 2007. Information foraging theory: Adaptive interaction with information. Oxford University Press.
24. Andrew Sears and Ben Shneiderman. 1994. Split Menus: Effectively Using Selection Frequency to Organize Menus. ACM Trans. Comput.-Hum. Interact. 1, 1 (March
1994), 27–51. DOI:
http://dx.doi.org/10.1145/174630.174632
25. Tim Wifall, Eliot Hazeltine, and J Toby Mordkoff. 2015. The roles of stimulus and response uncertainty in forced-choice performance: an amendment to