HAL Id: hal-01687328
https://hal.archives-ouvertes.fr/hal-01687328
Submitted on 25 Sep 2018
HAL is a multi-disciplinary open access
archive for the deposit and dissemination of
sci-entific research documents, whether they are
pub-lished or not. The documents may come from
teaching and research institutions in France or
abroad, or from public or private research centers.
L’archive ouverte pluridisciplinaire HAL, est
destinée au dépôt et à la diffusion de documents
scientifiques de niveau recherche, publiés ou non,
émanant des établissements d’enseignement et de
recherche français ou étrangers, des laboratoires
publics ou privés.
A methodology and new criteria to quantify the
adhesive and abrasive wear damage on a die radius using
white light profilometry
Sabine Le Roux, Christine Boher, Luc Penazzi, C. Dessain, B. Tavernier
To cite this version:
Sabine Le Roux, Christine Boher, Luc Penazzi, C. Dessain, B. Tavernier. A methodology and new
cri-teria to quantify the adhesive and abrasive wear damage on a die radius using white light profilometry.
Tribology International, Elsevier, 2012, 52, pp.40-49. �10.1016/j.triboint.2012.02.018�. �hal-01687328�
A methodology and new criteria to quantify the adhesive and abrasive wear
damage on a die radius using white light profilometry
S. Le Roux
a, C. Boher
a,n, L. Penazzi
a, C. Dessain
b, B. Tavernier
baUniversite´ de Toulouse, Mines Albi, ICA (Institut Cle´ment Ader), Campus Jarlard, F-81013 Albi Cedex 09, France bArcelorMittal Global Research & Development Montataire, 1 route de Saint Leu, 60761 Montataire Cedex, France
Keywords:
Surface damage criteria Adhesive and abrasive wear White-light profilometry Hot stamping process
a b s t r a c t
A methodology is developed in this article to assess the wear damage occurring on a die radius in a deep-drawing process. Profilometric and topographic measurements were performed with a white-light-source confocal microscope on the rubbed part of the die radius, using a repeatable procedure. Four new quantitative damage criteria were defined from 2D profiles, to quantify and determine the degree of regularity of both adhesive and abrasive damage. This method allows different tool steels to be classified in terms of their adhesive and abrasive wear behavior, with fairly good repeatability and reliability.
1. Introduction
In tribology, the quantification of wear damage is not usually easy to achieve, whatever the field of application may be. Wear quantification techniques are based on mass or geometric mea-surements. One widely used technique is gravimetric wear measurement which calculates the wear volume loss[1–4], but this method is not pertinent when the specimen mass loss or addition is lower than the accuracy of the weight balance (typically 0.01 mg). Neither is it useful when the wear damage involves both adhesive and abrasive mechanisms. Another tech-nique consists in weighing the wear particles ejected from the contact area. In this case, adhesive particles cannot be measured accurately. Many studies involve microscopic observations of the test samples after the wear test, with optical or scanning electron microscopes (sometimes coupled with energy dispersive spectro-metry), to study the wear morphologies (craters, cracking, spal-liation, transfer layer, plastic deformation, fatigue, shear fracture, etc.). Although these investigations are useful to understand the wear mechanisms better[3,5], they remain qualitative and do not allow measurement of wear damage quantities.
Approaches using 2D or 3D profilometry measurements with standard stylus or optical devices could be good alternatives. These techniques are powerful tools, which can not only quantify the wear volume or depth, but also assess the local development
of the wear damage on the sample surface. The normal standar-dized roughness parameters calculated from profiles or topogra-phies make them possible to follow wear development[6], but do not provide a direct quantification of the wear damage. Several authors evaluate the wear volume from functional surface para-meters calculated from the probability distribution (called the Abbott–Firestone or bearing ratio curve). Las Casas et al. [7]
analyzed the surface texture parameters (skewness Sk, roughness probability parameters Spk and Svk, and texture aspect ratio Str) to characterize the wear damage on dental enamel specimens. Gara et al. [8]performed wear measurements at different loca-tions on the liner surface of a diesel-engine cylinder, using a replication technique. They developed wear-volume equations based on bearing-ratio parameters (Rk, Rpk, Rvk, Mr1 and Mr2), calculated from 2D profiles measured with an optical profil-ometer. The bearing-ratio curve is divided into three approximate areas, related respectively to the peaks, the core and the valleys of the surface profile, and the related volume of the material is calculated with a simplified pyramidal model. Then, the wear volume is calculated by subtracting the volumes before and after the wear test. But these calculations constitute an approximation of the real wear volumes, as no reference is taken between two bearing ratio curves. Moreover, this method does not allow discrimination between transferred and material loss damage, as the global wear volume includes both the elements. Kumar et al.[9]developed a procedure to measure the engine-liner wear volume and depth, based on bearing-length curves. This method consists in estimating the difference between the bearing-area curves calculated from roughness profiles, measured on the
n
Corresponding author. Tel.: þ33563493169; fax: þ33563493099. E-mail address:Christine.boher@mines-albi.fr (C. Boher).
cylinder before and after the test. Nevertheless, this method requires that the zone of wear is less than the valley depth, in order to keep a lower reference line equivalent for both profiles. Theocharopoulos et al.[10] processed the surface topographies measured on dental enamel and glass ceramic disk samples, using the profilometer dedicated software. They assessed the worn volume by subtracting the topographies scanned before and after the wear test. However, this tool is difficult to apply on samples with irregular shapes, as the mathematical processing can gen-erate distorted surfaces, making wear quantification complicated. The global aim of this study is to investigate the adhesive and abrasive wear generated by the sliding at high temperature of a High Strength Steel strip on different tool steels, using a deep-drawing simulator. Because of the cylindrical shape of the tools (die radii), the quantification of wear loss and material transfer is not particularly easy. A method and new criteria, based on profilometric and topographic measurements, are developed here in order to locate and quantify the wear damage. The relative amount and degree of regularity of the adhesive and abrasive wear are determined on the die radius surface, allowing us to classify the tool steels investigated.
2. Wear test 2.1. Materials
The strip was a high-strength 22MnB5 boron–manganese steel with an Al–Si coating (Usibor 1500Ps, ArcelorMittal). The width of the sheet was 50 mm and it thickness was 1 mm.
Three different steel grades were studied for the die radius: an X50CrMoV5 alloyed nitrided steel (called SG1), a 60CrMoTiV16 alloyed steel (SG2), and a Mo alloyed steel (SG3). These three tool steels present a martensitic microstructure with good wear resistance, and are currently used as mold materials. For SG2 and SG3 steel grades, the bulk and surface hardness is about 550Hv0.2. The SG1 steel grade presents a bulk hardness of about 650Hv0.2, and because of the nitrided surface, its superficial hardness reaches 980Hv0.2.
2.2. Test procedure
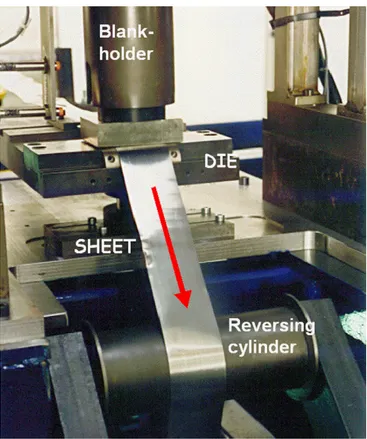
In order to reproduce tribological interactions between the strip and the tool in the hot stamping process, an experimental high-temperature friction simulator was developed in the laboratory (Fig. 1) [11,12]. The pre-alloyed strip was heated to 875 1C, and maintained at this temperature before being slid onto the die radius. Two campaigns were undertaken, the first up to 5000 cycles with cycling interruptions at each 1000 cycles, and the second up to 2000 cycles with shorter interruption cycles at 200, 500 and 1000 cycles. The test parameters (sliding distance and speed, strip temperature, strip exit angle, die radius geometry and materials) were strictly identical for the two campaigns[13]. The test interruptions were used to carry out non-destructive investigations on the die radius, in order to monitor its surface degradation.
3. Wear measurement methodology 3.1. White-light profilometer
Profilometric and topographic measurements were performed using an extended field confocal microscope (AltiSurf520 from Altimet), based on the principle of chromatic coding (Fig. 2). A white-light-source (W) is focused onto the sample surface (O), where it is reflected. The beam of this polychromatic light source
is split into its constituent wavelengths by an accurate distance-measuring sensor which incorporates special chromatic lenses (L). Each wavelength can only be sharply focused on a point lying at a specific distance from the sensor, thus creating a continuum of monochromatic imaging points (M). The distance-sensing ability of the sensor is enabled by matching the central wavelength of the reflected beam to the exact height of the focused point, via a spectrometer (S). A microtopographic image is then constituted by raster scanning across the desired specimen surface. This optical surface profilometer can provide analysis of shape and texture, micro-topography as well as roughness measurements[10]. Com-pared to a standard mechanical measuring device, it performs a non-contact measurement, leaving sample surfaces intact.
Fig. 1. Detailed view of the working system of the DDPS (Deep Drawing Process Simulator).
Fig. 2. Principle of white light profilometry. Source: Stil S.A., Aix-en-Provence, France.
Two chromatic sensors, with a measuring range of 350
m
m and 3 mm, were available in the laboratory. Their measurement performances are given inTable 1. For this type of sensors, the axial resolution and the reflection limit angle increase as the working range decreases. The reflection limit angle implies that when the angle between the sample surface and the optical ray is greater than the limit, measurement becomes impossible. This means that at the roughness scale, the sharper the asperity angle, the more difficult it is to recover the optical information.The scanning was carried out through a CHR-150 controller (Stil S.A.) connected to the profilometer. In order to improve the sensitivity of the sensor to reflected light, dark background measurement was systematically performed before the scanning measurement was taken.
3.2. Measuring requirements on die radius
The sample geometry is a right square prism of 70 mm length and 20 mm height, with one edge machined with a die radius (Rm) of 6 mm (Fig. 3). The active part of the sample is focused on the die radius. The arithmetic roughness (Ra) of the polished surface is 0.270.05
m
m, ranging from 0.14 to 0.25m
m depending on the steel grade and the location on the die-radius. This high surface quality combined with a reflective material (steel) may lead to the saturation of the optical sensor. Consequently, the high sensor amplitude (3 mm) is required to assess the spread of the wear damage on the whole active die-radius surface (from 01 to 651,Fig. 4). However, considering the technical specifications of each chromatic sensor at the shape sample scale, especially the reflec-tion limit angle, the die-radius must be divided into four sub-sections to be measured completely, from the entry to the exit of the die-radius (Fig. 4). Thus, four different cradles were adjusted to the required angular position corresponding to the minimum angle between the sample surface and the optical ray during the measurements. The die radius was fixed on a sample holder, where four flats were machined in order to locate the four sub-sections to investigate on the die-radius. The set was then placed in a swiveling cradle, which was positioned according to the die radius sub-section to be measured (Fig. 5a). Stop screws, fixed on the power-driven table of the profilometer, ensured that the die radius was always in the same position under the optical sensor (Fig. 5b).
3.3. Topographic and profilometric measurement procedure Topographic measurements were performed with the chro-matic sensor with the largest measuring range (3 mm), on the four die radius sub-sections. The scanning areas were 80 mm in length and 3 mm wide, in order to cover respectively a part of the sample holder (which constitutes a reference position) and an overlapping area between the maps of two adjacent sub-sections. In order to optimize the scanning duration, a lateral resolution of 25
m
m, a scanning speed of 1 mm/s, and a high sampling fre-quency (1000 Hz) were selected. The raw surface topographies were analyzed using a dedicated software (AltiMap). The first step was to extract the area of interest corresponding only to the die-radius (excluding the sample holder parts), in order to reduce the surface maps to 65 mm " 1.8 mm to 2.2 mm (the width depend-ing on the sub-section under consideration). The unmeasured points corresponding to sensor saturation were interpolated byTable 1
Measuring performances of the chromatic sensors used with the extended field confocal microscope. Measuring range Working distance (mm) Axial (Z) resolution (nm) Lateral resolution (lm) Precision (lm) Reflection limit angle (1) 350mm 12 10 4 0.1 30 3 mm 28 100 10 1 15
Fig. 3. Geometry and dimensions of the DDPS die radius sample.
Fig. 4. Definition of four sub-sections on the die radius cross-section for non-destructive investigations.
considering their neighboring points, and the cylindrical shape of the die-radius was suppressed by a polynomial function (degree 5). The standard 3D parameters (Sa, Sq, St, etc.) were calculated on the ‘‘flattened’’ topographies. The polar graph of textural direc-tions was calculated, in order to assess the spatial isotropy or directionality of the die-radius surface texture, measured through the Str spatial parameter. This texture aspect ratio, theoretically ranging between 0 and 1, indicated a strong uniform texture aspect in all directions when Str40.5, and a strong directional structure when Stro0.3. The 3D topographies also provided information on the spread of the damage on the die radius, and made it possible to locate the most worn areas.
In order to access precise quantitative damage measurements, profilometric measurements were performed on the die radius perpendicular to the strip sliding direction, using the 350
m
m chromatic sensor and a fairly low sampling frequency (100 Hz). Three profiles of 72.5 mm length, crossing the die radius in the longitudinal direction from the sample-holder parts and spaced 0.5 mm from each other, were recorded for each sub-section of the die radius (Fig. 6). The profiles used were much longer than the sliding part on the die radius (which is around 60 mm), in order to retrieve an unworn reference surface on the die radius after the cycle. The lateral resolution (X) of the profiles was 1m
m, for a measuring speed of 1 mm/s. Each raw profile was analyzed to extract the region of interest corresponding to the die radius solely, and then the profile was straightened using theleast-squares method. The reference line, from where the adhesion and ploughing areas were measured, is the mean plane of the unworn zone (Fig. 7).
3.4. Wear criteria definitions
The standard roughness parameters calculated by the dedicated software did not provide enough precise information about the abrasive and adhesive damage on the die radius surface. For this reason, we defined four new quantitative wear criteria, calculated from the straightened raw profiles measured on the die radius.
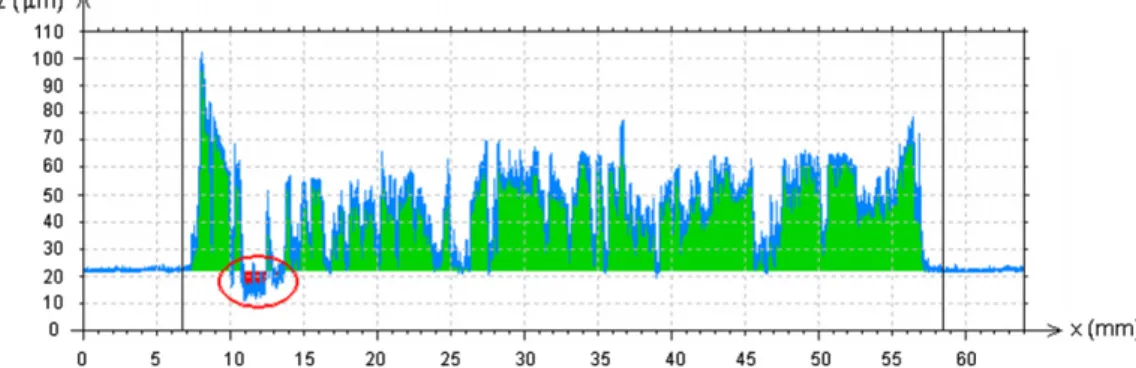
3.4.1. Transfer wear area (Stm) and regularity (Trm) criteria In order to quantify the adhesive wear on the die radius, the total area (Stt) and maximal height (Htmax) of the transfer layer were determined on each profile (Fig. 8).
The transfer wear area criterion Stm, expressed in
m
m2/mm, is defined as the mean value of the total transferred area (Stt) of the nprofiles p acquired on the die radius, related to the length (Lp) of the worn part of the straighten profile:Stm¼
Xn p ¼ 1
Sttsp=ðnLpÞ ð1Þ
For each profile, the regularity of the transfer layer (Tr) is calculated as the ratio of the total area of the transfer layer (Stt) to the product of the maximal height (Htmax) of the transfer layer by the length (Lp) of the worn part of the straighten profile (Fig. 8):
Tr ¼ Stt=ðHtmaxLpÞ ð2Þ
Th is a dimensionless value ranging from 0 to 1, and is independent of the mean thickness of the transfer layer. The more the transferred layer is homogeneous and continuous, the higher is the Tr (the maximal theoretical value 1 can never be reached, because of the roughness of the transfer layer). Con-versely, a heterogeneous and scattered transferred layer gives a low value (near zero).
The transfer wear regularity criterion (Trm) is then calculated as the mean value of the transfer regularity of the n profiles p
Fig. 6. Location of the profile measurements on the die radius (three profiles per sub-section).
Fig. 7. Definition of the reference line as the mean plane of the unworn zone on the profile, to quantify the adhesive and abrasive wear areas (transfer layer is green and material loss is red). (For interpretation of the references to color in this figure legend, the reader is referred to the web version of this article.)
Fig. 10. Classification of die radius steel grades vs. adhesive and abrasive wear damage after of the 5000 cycles: transfer area Stm(a) and material loss area Sum(b) criteria.
Fig. 9. Determination of the regularity of the material loss on the straightened profile: Ur¼Stu/(LpPumax)¼0.580.
acquired on the die radius: Trm¼
Xn p ¼ 1
Thp=n ð3Þ
3.4.2. Material loss area (Sum) and regularity (Urm) criteria In order to quantify the abrasive wear on the die radius, the total area (Sut) and maximal depth (Pumax) of the material loss were determined on each profile (Fig. 9).
The material loss area criterion Sum, expressed in
m
m2/mm, is defined as the mean value of the total area of material loss (Sut) of the n profiles p acquired on the die radius, related to the length (Lp) of the worn part of the straighten profile:Sum¼
Xn p ¼ 1
Sutp=ðnLpÞ ð4Þ
For each profile, the dimensionless regularity of the material loss (Ur) is defined as the ratio of the total area of the material loss (Sut) to the product of the maximal depth (Pumax) of the material loss by the length (Lp) of the worn part of the straighten profile (Fig. 9):
Ur ¼ Sut=ðPumaxLpÞ ð5Þ
The material loss regularity criterion (Urm) is then calculated as the mean value of the material loss regularity of the n profiles p acquired on the die radius:
Urm¼
Xn p ¼ 1
Uhp=n: ð6Þ
4. Results and discussion
4.1. Tool classification based on wear criteria
The transfer and material-loss wear criteria Stmand Stu were used to quantify the wear at the die radius surface, and to classify the tools in terms of adhesive and abrasive wear damage. InFig. 10, the three steel grades are compared after 5000 cycles. At the end of the first cycling campaign, SG1 and SG3 die radii present approxi-mately the same level of adhesive wear at their surface, whereas SG2 is less damaged (Fig. 10a). In contrast, Fig. 10b shows that SG2 presents the highest propensity to abrasive wear, and SG3 is the lowest. Stmand Sumwere calculated on the three first sub-sections 1–3, excluding sub-section 4 on which no significant damage was observed. Although Stmand Sumcriteria are average values calcu-lated from nine profiles, the standard deviations are not indicated in
Fig. 10. This is because the adhesive wear is highly localized at the entry of the contact on the die radius (at the boundary between sub-sections 1 and 2), as illustrated in the topographies (Fig. 11). Therefore, Sttand Sutvalues are scattered, and the standard devia-tions are not representative of the main results. In the next paragraph, a study of the reproducibility of these criteria will be presented and discussed.
A more detailed analysis of the tribological behavior and wear damage mechanisms is reported in[13].
4.2. Repeatability of wear damage criterion measurements The repeatability of the wear-damage criterion measurements was evaluated on the three die radii after 2000 cycles (at the end of the second campaign). Five series of profilometric measure-ments, spaced in time, were performed by the same operator using the same measurement device with the same optical sensor (intra-laboratory reproducibility). Before each series of measure-ments, the profilometer was reinitialized, and the power-driven table and the positioning system of the sample-holder refitted.
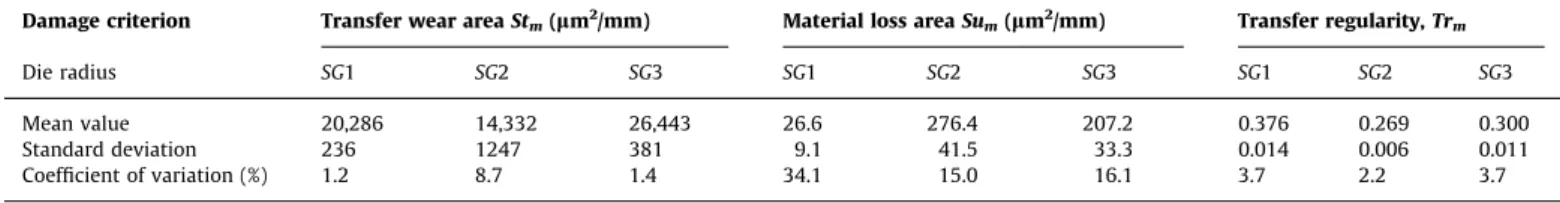
The statistical dispersion results of Stm, Sumand Trmcriteria are given inTable 2, for the three steel die radii. The coefficient of variation (CV) of the mean values characterizes the relative dispersion of a statistical series:
CV ¼
s
X" 100 ð7Þ
It is generally considered that when CVo10%, there is little scattering of the population and the sample can be considered homogeneous; otherwise, the population is dispersed. For Stmand Trm criteria, CV ranges between 0.9% and 8%, and between 2.1% and 3.7%, respectively. These particularly low values attest to the good repeatability of the transfer wear area and regularity measurements. For the material loss area Sum, CV ranges from 14.5% to 34.2%.Fig. 12indicates that the coefficient of variation calculated from our Stmand Sumcriteria measurements is strongly dependent on the quantity of wear loss or transfer (expressed here by equivalent thickness eeq): the lower the eeq, the higher the CV. On this curve, the minimal equivalent thickness from which the measurements are statistically reliable (i.e. for CVr10%) is 3
m
m. The higher variability for the Sum criterion can thus be explained by the relatively small amount of material loss (max-imal depth of a few micrometers) generated on the tools in the applied test conditions, which, in addition, is highly localized onTable 2
Statistical dispersion calculated from five series of measurements of the wear criteria Stm, Sumand Trm, for the three steel die radii.
Damage criterion Transfer wear area Stm(lm2/mm) Material loss area Sum(lm2/mm) Transfer regularity, Trm
Die radius SG1 SG2 SG3 SG1 SG2 SG3 SG1 SG2 SG3
Mean value 20,286 14,332 26,443 26.6 276.4 207.2 0.376 0.269 0.300
Standard deviation 236 1247 381 9.1 41.5 33.3 0.014 0.006 0.011
Coefficient of variation (%) 1.2 8.7 1.4 34.1 15.0 16.1 3.7 2.2 3.7
Fig. 12. Relationship between the coefficient of variation CV and the equivalent thickness of material transfer or material loss eequ..
the die radii, as shown in Fig. 13. Therefore, given the low abrasive wear observed on the tool surface under the applied wear-test conditions, the material loss regularity (Ur) was not investigated in this study.
It can thus be concluded that our measurement methodology is reliable when the wear damage (material transfer or material loss) is consistent enough, i.e. when the equivalent thickness of material transfer or loss is higher than 3
m
m.4.3. Reliability of the wear test
The two test campaigns, performed in the same operating conditions, contained interruptions at two identical numbers of
cycles (1000 and 2000 cycles). This allowed the reliability of the wear test and measurement to be verified.
As previously concluded from the repeatability study of the profilometric measurement and processing (Section 4.2), the repro-ducibility of the test is better for the transfer criterion (Stm) compared to the material loss criterion (Stu). In Fig. 14, one can see that the Stmvalues exhibit a particularly strong reproducibility, except for the test on the SG1 tool at 1000 cycles. A mean difference of 37.5% and 6%, respectively, is obtained at 1000 cycles and 2000 cycles. The reproducibility of the transfer regularity criterion (Trm) is also very strong, with a mean difference of 12% and 19%, respec-tively, at 1000 cycles and 2000 cycles (Fig. 15). The maximal difference reaches 33% for the SG2 tool, on which the transfer layer is smaller than that for SG1 and SG2 steels.
Fig. 13. Profile showing the small depth and localized spread of material loss on the SG1 die radius after 2000 cycles.
Fig. 14. Reproducibility of the transfer area criterion (Stm) for both cycling tests, after 1000 cycles (a) and 2000 cycles (b).
As shown in Fig. 16, the Stu criterion exhibits a higher difference between the two tests. It should mostly be attributed to the negligible amount of material loss (compared to material transfer) measured on the investigated tools, as explained in the previous paragraph. Moreover, the thermo-mechanical history of
the tools was not exactly identical during the two campaigns. Indeed, the second test campaign was interrupted more often before 1000 cycles, which does not allow the tool to reach a stable thermal regime. This could explain the higher differences observed inFigs. 14a and16a.
Fig. 16. Reproducibility of the material-loss area criterion (Sum) for both cycling tests, after 1000 cycles (a) and 2000 cycles (b).
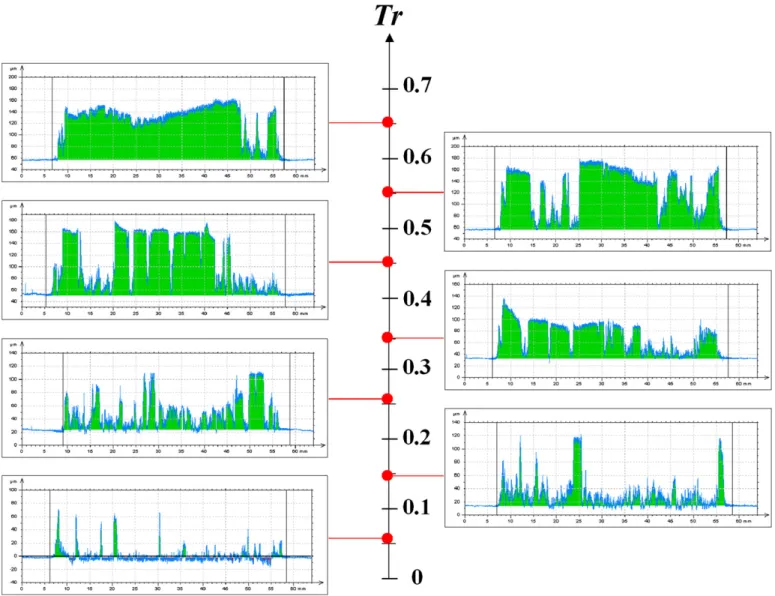
Fig. 17. Ability of the regularity criterion to discriminate between various morphologies of the transfer layer, from a homogeneous and continuous layer (Tr¼0.65) to a heterogeneous and scattered layer (Tr¼0.056).
Given the mechanical complexity of the DDPS device, the consistency of the wear damage criteria between the two test campaigns attests to the very high reliability of our wear-test simulator. In addition, the reproducibility of the wear damage criteria calculated from profilometric measurements demon-strates the strength of our measurement methodology.
4.4. Representativeness of regularity criterion
The degree of regularity of the transfer layer (Tr) measured on our specimens varies from 0.05 to almost 0.7. As shown inFig. 17, this parameter allows fine differentiation of the morphology of the transfer layer, from a compact and homogeneous layer to a scattered and heterogeneous one. It must be remembered, however, that Tr is calculated on the straightened raw profiles, which contain both long wavelength (shape) and short wavelength (roughness) information. So, Tr reflects not only the compactness of the layer, but also its scattered aspect. Therefore, the Tr value is affected by the presence of sharp peaks, which most probably represent local heterogeneity or, more rarely, measurement noise. Although this phenomenon was not very pronounced in our samples, a sensitivity study was carried out to
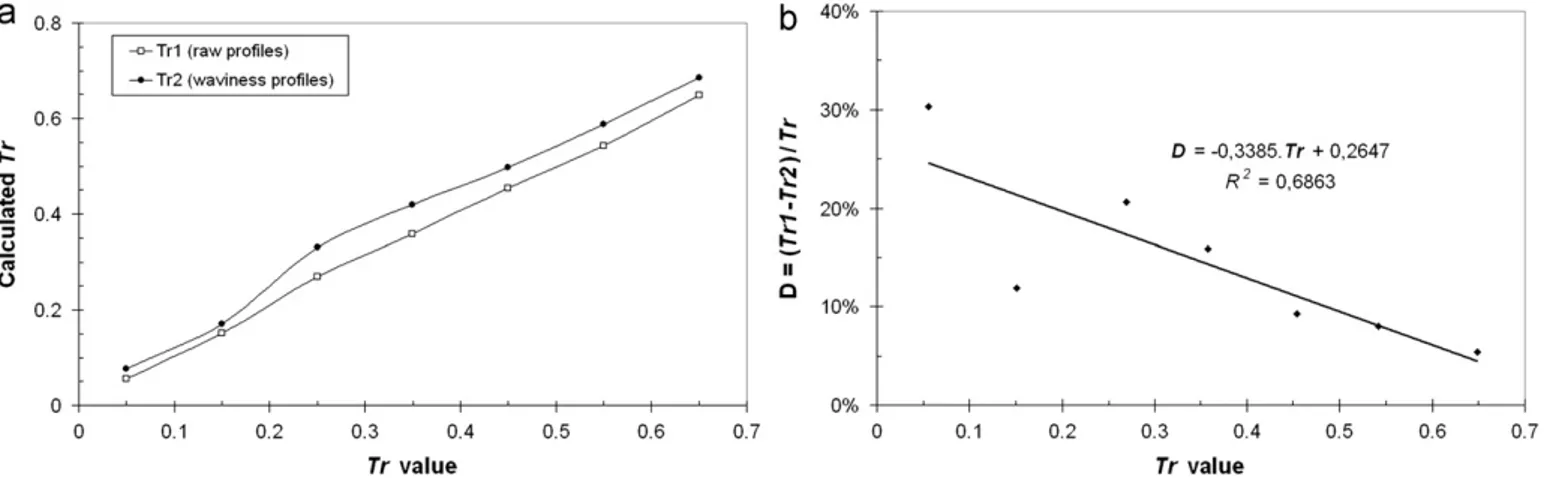
assess its effects on the Tr value. For this purpose, the raw profiles were filtered with the appropriate cut-off length, to eliminate the micro-roughness information. On the resulting waviness profiles, the maximal height of the transfer layer is lower, therefore increasing the calculated Tr value (Fig. 18). The results indicate that Tr values calculated from waviness profiles are 5–30% higher than that with the first method (Fig. 19a), and that this difference decreases when Tr increases (Fig. 19b). However, this does not change the classification of the transfer layers illustrated inFig. 17.
5. Conclusion
In this work, a methodology has been developed to quantify the adhesive and abrasive wear damage generated by the sliding at high temperature of a pre-alloyed Al–Si coated High Strength Steel strip on a die radius. Wear tests were carried out with a deep drawing simulator device, to characterize the wear behavior of three different steel grades used for the tool (die radius). Profilo-metric and topographic measurements, using a white-light con-focal microscope, were performed after each test interruption. Because of the complexity of the die radius shape and the lack of
Fig. 18. Sensitivity to noise of the transfer regularity: (a) Tr calculated on the raw profile of the transfer layer and (b) variant of calculation of Tr on the waviness profile (on which the micro-roughness parts have been filtered).
Fig. 19. Comparison of the transfer regularity values calculated from raw profiles (Tr1) and waviness profiles (Tr2) on the transfer layers shown inFig. 17(a), and evolution of D [¼(Tr2&Tr1)/Tr] vs. Tr value (b).
pertinent normalized parameters to quantify adhesive and abra-sive wear damage, new criteria have been defined and used to classify the wear behavior of the steel grades. The results show that both the wear test and the measurement methodology are reproducible, and reliable enough to classify the tool samples investigated in this study.
The measurement procedure and the associated wear criteria could be used in other applications dealing with revolution samples. For example, transfer criteria could be appropriated to characterize oxide scales or surface coatings, and material loss criteria to assess corroded or damaged surfaces.
Acknowledgments
This work was carried out within the context of the study on wear mechanisms of tool steel grades in hot stamping of Usi-bor1500Ps, in collaboration with ArcelorMittal Global Research & Development Montataire.
References
[1] Wood RJK, Jones TF. Investigations of sand–water induced erosive wear of AISI 304L stainless steel pipes by pilot-scale and laboratory-scale testing. Wear 2003;255:206–18.
[2] Dubourg L, Pelletier H, Vaissi!ere D, Hlawka F, Cornet A. Mechanical char-acterisation of laser surface alloyed aluminium–copper systems. Wear 2002;253: 1077–85.
[3] Shi W, Dong H, Bell T. Tribological behaviour and microscopic wear mechanisms of UHMWPE sliding against thermal oxidation-treated Ti6Al4V. Materials Science and Engineering A 2000;291(1–2):27–36.
[4] Micele L, Palombarini G, Guicciardi S, Silvestroni L. Tribological behaviour and wear resistance of a SiC–MoSi2composite dry sliding against Al2O3. Wear
2010;269:368–75.
[5] Barrau O, Boher C, Gras R, Rezai-Aria F. Analysis of the friction and wear behaviour of hot work tool steel for forging. Wear 2003;255(7–12): 1444–54.
[6] Buj Corral I, Vivancos Calvet T, Coba Salcedo M. Use of roughness probability parameters to quantify the material removed in plateau-honing. Interna-tional Journal of Machine Tools and Manufacture 2010;50(7):621–9. [7] Las Casas EB, Bastos FS, Godoy GCD, Buono VTL. Wear and surface roughness
characterization using profilometry. Tribology International 2008;41:1232–6. [8] Gara L, Zou Q, Sangeorzan BP, Barber GC, McCormick HE, Mekari MH. Wear measurement of the cylinder liner of a single cylinder diesel engine using a replication method. Wear 2010;268:558–64.
[9] Kumar R, Kumar S, Prakash B, Sethuramia A. Assessment of engine linear wear from bearing area curves. Wear 2000;239:282–6.
[10] Theocharopoulos A, Zou L, Hill R, Cattell M. Wear quantification of human enamel and dental glass-ceramics using white light profilometry. Wear 2010;269:930–6.
[11] Boher C, Attaf D, Penazzi L, Levaillant C. Wear behaviour on the radius portion of a die in deep-drawing: identification, localisation and evolution of the surface damage. Wear 2005;259:1097–108.
[12] Dessain C, Hein Ph, Wilsius J, Penazzi L, Boher C, Weikerts J. Experimental investigation of friction and wear in hot stamping of USIBOR 1500P. In: Proceedings of the 1st international conference on hot sheet metal forming of high-performance steel CHS2. GRIPS’ sparkling world of steel, vol. 1 ; 2008. p. 217–27.
[13] Le Roux S, Boher C, Penazzi L, Dessain C, Tavernier B. Experimental investigation of the tribological behavior and wear mechanisms of tool steel grades in hot stamping of a high strength boron steel. Wear, in preparation.