HAL Id: hal-03016342
https://hal.archives-ouvertes.fr/hal-03016342
Submitted on 20 Nov 2020HAL is a multi-disciplinary open access archive for the deposit and dissemination of sci-entific research documents, whether they are pub-lished or not. The documents may come from teaching and research institutions in France or abroad, or from public or private research centers.
L’archive ouverte pluridisciplinaire HAL, est destinée au dépôt et à la diffusion de documents scientifiques de niveau recherche, publiés ou non, émanant des établissements d’enseignement et de recherche français ou étrangers, des laboratoires publics ou privés.
Multi-scale 1H benchtop NMR analysis for milk analysis
Alper Soyler, Sevil Cikrikci, Cagri Cavdaroglu, Dylan Bouillaud, Jonathan
Farjon, Patrick Giraudeau, Mecit H.Oztop
To cite this version:
Alper Soyler, Sevil Cikrikci, Cagri Cavdaroglu, Dylan Bouillaud, Jonathan Farjon, et al.. Multi-scale 1H benchtop NMR analysis for milk analysis. LWT - Food Science and Technology, Elsevier, 2020, �10.1016/j.lwt.2020.110557�. �hal-03016342�
Journal Pre-proof
Multi-scale Benchtop 1H NMR Spectroscopy for Milk Analysis
Alper Soyler, Sevil Cikrikci, Cagri Cavdaroglu, Dylan Bouillaud, Jonathan Farjon, Patrick Giraudeau, Mecit H. Oztop
PII: S0023-6438(20)31545-0
DOI: https://doi.org/10.1016/j.lwt.2020.110557
Reference: YFSTL 110557
To appear in: LWT - Food Science and Technology
Received Date: 15 July 2020 Revised Date: 30 September 2020 Accepted Date: 8 November 2020
Please cite this article as: Soyler, A., Cikrikci, S., Cavdaroglu, C., Bouillaud, D., Farjon, J., Giraudeau, P., Oztop, M.H., Multi-scale Benchtop 1H NMR Spectroscopy for Milk Analysis, LWT - Food Science and Technology, https://doi.org/10.1016/j.lwt.2020.110557.
This is a PDF file of an article that has undergone enhancements after acceptance, such as the addition of a cover page and metadata, and formatting for readability, but it is not yet the definitive version of record. This version will undergo additional copyediting, typesetting and review before it is published in its final form, but we are providing this version to give early visibility of the article. Please note that, during the production process, errors may be discovered which could affect the content, and all legal disclaimers that apply to the journal pertain.
Credit Author Statement
− The study is a part of the PhD dissertation of Dr. Alper Soyler − Dr. Farjon and Mr. Bouillaud helped Dr. Soyler in the experiments.
− Dr. Cikrikci helped to arrange the data and Mr. Çavdaroğlu conducted and wrote the statistical analysis.
− Dr. Oztop and Dr. Giraudeau were the advisors of the study.
1
Multi-scale Benchtop 1H NMR Spectroscopy for Milk Analysis
1 2
Alper Soyler1, Sevil Cikrikci2, Cagri Cavdaroglu3, Dylan Bouillaud4, Jonathan Farjon4, Patrick
3
Giraudeau4*, Mecit H. Oztop1*
4 5
1Department of Food Engineering, Middle East Technical University, Ankara, Turkey
6
2Department of Food Engineering, Konya Food and Agriculture University, Konya, Turkey
7
3Department of Food Engineering, Izmir Institute of Technology, Izmir, Turkey
8
4Université de Nantes, CNRS, CEISAM UMR 6230, Nantes, France
9 10 Corresponding Authors*: Dr. Mecit Oztop Phone : + 90 312 210 5634 Fax : + 90 312 219 2767 E-mail : mecit@metu.edu.tr Dr. Patrick Giraudeau E-mail: patrick.giraudeau@univ-nantes.fr Phone: + 33 251125709 Fax: + 33 251125712 11 12 13 14 15 16 17 18 19 20 21 22 23 24 25 26 27 28 29
Journal Pre-proof
2
ABSTRACT
30
Benchtop NMR systems offers various advantages such as being easy to use, not requiring
31
constant maintenance and being available at affordable prices. In this study, multiple aspects
32
of benchtop NMR spectroscopy were explored to analyse milk in an industrial context, either
33
regarding the quality of production or regarding the differentiation of the final product. The
34
first part focuses on the production conditions of lactose hydrolysis in milk and quantitative
35
online NMR spectroscopy was adapted to follow lactose hydrolysis in milk in continuous flow
36
mode. The second part focuses on differentiating milk samples having different properties. 36
37
milk samples from France and Turkey were analysed and glycerol, fat and sugar contents were
38
measured from the NMR spectra. Combination of spectroscopic data with a proposed
39
Artificial Neural Network model enabled to classify milk of different origins and different
40
properties. This study shows that benchtop NMR spectroscopy is a versatile non-destructive
41
control method that can help controlling milk quality both during and after production.
42 43 44 45 46 47 48
Keywords: Benchtop NMR spectroscopy; milk; lactose hydrolysis; classification; flow NMR;
49
artificial neural network (ANN)
50
51
52
53
3
INTRODUCTION
54
Milk is a unique product including significant amounts of nutrients such as calcium, proteins
55
and vitamins (Dutra Rosolen, Gennari, Volpato, & Volken De Souza, 2015). It can be
56
considered as the ‘magic liquid’ due to its rich and various composition and confirmed
57
benefits on the newborns. In this context, accessible analytical tools are crucial to ensure the
58
quality of milk, both to optimize the production processes and after production to ensure its
59
characteristic properties.
60
The first focus of this paper is about the production stage, on the example of the potential
61
production of lactose-free milk. One of the milk constituents, lactose (aka milk sugar) is a
62
disaccharide composed of glucose and galactose that are linked by a β-1,4 glycosidic
63
bond(Dong & Zhong, 2019). However, lactose found in the milk or milk products cause
64
digestion problems in some part of the population. The absence of the digestive enzyme
65
lactase which is also known as ‘lactose intolerance’ is the reason of this problem. Significant
66
amount of world population suffers from lactose intolerance thus demand for lactose free
67
products is getting increasing attention (Churakova et al., 2019). Lactose free milk is produced
68
by the pre-digestion of the lactose in milk with the addition of the lactase enzyme. Controlling
69
the production of lactose-free milk during its production has a major industrial impact. There
70
exist many different techniques recognized by analytical standard agencies to determine the
71
lactose content of milk, such as polarimetry, mid-infrared detection, gravimetry, differential
72
pH, enzymatic methods detecting either the glucose or galactose moiety of lactose and HPLC
73
(Churakova et al., 2019). Each of these methods has its own advantages and disadvantages, but
74
to our knowledge none of them have the ability to monitor the hydrolysis process online in the
75
continuous mode. Therefore, developing new online tools for controlling this reaction is of
76
major importance for the milk industry.
77
On the other hand, the differentiation of milk products not only regarding the sugar type
78
(lactose free or not) but also according to the other parameters such as process, origin, fat
79
4
content, etc. requires considerable attention especially considering the regulatory
80
specifications and quality of the milk. In recent years, several studies have focused on
81
discriminating the products coming from different farming systems, animals or feeding
82
strategies, origin etc. (Bergamaschi, Cipolat-Gotet, Cecchinato, Schiavon, & Bittante, 2020).
83
Traditional methods like chromatographic techniques or sensory analyses might require highly
84
skilled operators and they could not be easily adapted to online monitoring. Moreover, they
85
could be time consuming and expensive. Easy, quick to use, minimum chemical requiring
86
methods have always been on the interest of manufacturers for ensuring the quality and
87
authenticity.
88
Nuclear magnetic resonance (NMR) spectroscopy, is a powerful, fingerprint tool for the
89
simultaneous identification and quantification of compounds in complex mixtures
90
(Monakhova, Kuballa, Leitz, Andlauer, & Lachenmeier, 2012). It is recognized as a valuable
91
tool for food analysis enabling not only the characterization of food matrices in terms of
92
authenticity and quality but also identification of counterfeits (Sobolev et al., 2019). Also,
93
studies of 1H NMR-based metabolomics to get metabolite profiles during storage (Jansson et
94
al., 2014) or to analyze heritability of individual milk metabolites (Buitenhuis et al., 2013) in
95
animal based products have been explored (Bertram, 2018). However, most of the NMR
96
spectroscopy instruments work at high field (1H frequencies >300 MHz) and requires a
97
massive dedicated place with specific installation and trained staff as well as a substantial
98
investment cost and expensive cryogenic fluids for maintenance (Bouillaud, Farjon,
99
Gonçalves, & Giraudeau, 2019). To overcome such limitations, benchtop systems capable of
100
conducting spectroscopy experiments have been developed (Perlo et al., 2005). These systems
101
have been successfully used to monitor authenticity in some kind of foods such as in coffee
102
(Defernez et al., 2017) and in meat (Jakes et al., 2015). Furthermore, thanks to their compact
103
character, NMR spectroscopy can easily be used for online monitoring under flow conditions
104
(Anderssen & McCarney, 2020; Bouillaud, Heredia, et al., 2019; Knox, Parkinson, Stone, &
105
Warren, 2019; Rönnols, Danieli, Freichels, & Aldaeus, 2020; Soyler, Bouillaud, Farjon,
106
5
Giraudeau, & Oztop, 2020), which makes them ideal candidates for the online control of food
107
production processes. For instance, benchtop NMR spectroscopy has been used to monitor
108
continuous processes such as enzymatic hydrolysis of marine by-products (Anderssen &
109
McCarney, 2020), sucrose hydrolysis (Soyler et al., 2020), in vivo monitoring of lipid
110
accumulation in microalgae (Bouillaud et al., 2020) and lignin analysis (Rönnols et al., 2020).
111
However it is important to note that implementing NMR spectroscopy in a flow system is
112
challenging and can introduce additional complexity relative to static samples (Knox et al.,
113
2019). The impact of flow rate on signal intensities should be investigated carefully and the
114
parameters should be set accordingly (Soyler et al., 2020).
115
To our knowledge, this will be 1st study where milk will be investigated by using a bench top
116
NMR spectroscopy system from different aspects. We have explored the versatility of
117
benchtop NMR on milk samples for two different purposes. In the first part of the study,
118
benchtop NMR spectroscopy was utilized in conditions mimicking the online control of
119
lactose hydrolysis in milk and lactose hydrolysis was monitored first in a model system, then
120
in a milk sample -with no need for deuterated solvents through the use of a tailored solvent
121
suppression pulse sequence (Gouilleux, Charrier, Akoka, & Giraudeau, 2017a). Kinetic
122
analysis of the reaction was also performed. In the second part, 36 milk samples from Turkey
123
and France; having different fat and sugar contents; production styles (conventional vs
124
organic) were analysed by NMR spectroscopy together with multivariate approaches to assess
125
the potential of benchtop NMR as a differentiation tool.
126
MATERIALS AND METHODS
127
Materials
128
Lactose in the form of D-(+)-Lactose monohydrate was purchased from Fluka BioChemika,
129
Switzerland. Lactase enzyme (Maxilact® LGi 5000) for lactose hydrolysis was supplied from
130
DSM, (Heerlen, The Netherlands). D-(+)-Glucose, D-(+)-Galactose, imidazole and
3-131
(Trimethylsilyl) propionic-2,2,3,3-d4 acid (TSP) were provided from Sigma-Aldrich Co. (St.
132
6
Louis, MO, USA). HPLC grade water from a water purification system (Nanopure Infinity,
133
Barnstead International, IA) was used for the preparation of the solutions. For the lactose
134
hydrolysis experiments in milk, a UHT whole milk (Lactel, France) bought from a grocery
135
store in France was used.
136
For the second part of the study, 36 different samples of milk (different cow milks: whole
137
milk, organic whole milk, low-fat milk, lactose-free milk and goat milk) were purchased from
138
local Turkish and French supermarkets. Information on the milk samples are given in Table 1.
139
Sample Preparations
140
For online monitoring analysis, hydrolysis reactions were performed both for a model system
141
and on a milk sample. As the model solution, a solution of glucose, galactose and lactose was
142
used. 5% (w/w) glucose, galactose and lactose solutions were prepared separately by
143
dissolving in non-deuterated HPLC grade water in a 50 mL tube. TSP was used as the internal
144
standard.
145
For milk differentiation experiments, 0.5% (w/w) imidazole was added to the 36 milk samples
146
(Table 1) as the internal reference for NMR measurements since TSP was masked with the
147
peaks of the fats present in the milk. Imidazole had 1H chemical shifts of 7.26 ppm and 8.11
148
ppm. All the samples were stirred for 5 min for complete dissolution of imidazole in the milk.
149
Afterwards, the samples were transferred into 5 mm NMR tubes and stored in the dark and
150
refrigerated before analysis to prevent spoilage.
151
NMR Spectroscopy
152
NMR spectroscopy experiments were performed on a benchtop spectrometer operating at a 43
153
MHz 1H frequency with a compact permanent magnet based on the Halbach design (Magritek
154
Spinsolve, Wellington , NZ) (E. Danieli, Perlo, Blümich, & Casanova, 2013; Ernesto Danieli,
155
Perlo, Blümich, & Casanova, 2010). The spectrometer was equipped with a gradient coil along
156
the B0 axis in the transverse plane of the NMR tube that could produce a maximum field
157
gradient of 0.16 T.m-1 and also had an external lock system which allowed the use of
non-158
7
deuterated solvents. The experiments were performed at 29 °C since this was the temperature
159
at which the magnet stability was optimal. Since deuterated solvents were not used, an
160
experiment to suppress the water signal was used, based on a WET-180-NOESY (Gouilleux,
161
Charrier, Akoka, & Giraudeau, 2017b). This pulse sequence provides an optimal solvent
162
suppression for small molecules on a benchtop spectrometer, leading to a lower and narrower
163
water signal with a clean phase with a minimal impact on nearby peaks.
164
An inversion recovery sequence was used for measuring longitudinal relaxation times T1 using
165
an inversion time range of 0.1-10,000 ms with 15 points.
166
The 1D 1H spectra were obtained with 64 scans for a total experiment time of 6 min for model
167
lactose solution hydrolysis and 7 min for milk hydrolysis and ‘milk differentiation’
168
experiments. The 90o pulse angle was achieved by a pulse length of 6.7 µs at 0 dB. The FIDs
169
were recorded with 16 K points, a dwell time of 200 µs, and a repetition time of 6 s for model
170
lactose solution and 7 s for milk, corresponding to 5 times the longest T1 in the sample to
171
ensure quantitative conditions. 1D data were processed with MestReNova. To align all the
172
spectra correctly, TSP was used to calibrate the chemical shift axis at 0 ppm for the hydrolysis
173
experiments. For milk spectra, the signal of imidazole at 7.26 ppm was used as the chemical
174
shift reference. All spectra were processed with a 0.2 Hz exponential apodization, an
175
automatic phase correction and an automatic baseline correction via a Whittaker smoother
176
algorithm. Manual phase correction and manual baseline correction were also performed in
177
addition to the automatic corrections. Relevant peak integrals were calculated by integration
178
with the MestReNova software. Deconvolution tools were also evaluated but yielded a slightly
179
lower performance than integration, probably due to the non-ideal line shapes.
180
Lactose hydrolysis in continuous flow system
181
For on-line monitoring, the system included a glass flow cell with 5 mm outer diameter, a
182
peristaltic pump (Reglo Digital, Ismatec, Wertheim, Germany) and PEEK tubing. A heating
183
plate (RCT Basic, IKA-Werke GmbH & Co. KG, Staufen, Germany) was added to the system
184
8
to control the temperature of the hydrolysis reaction.
185
NMR signal is very sensitive to the flow rates as the signal becomes broader and the resolution
186
decreases with increasing flow rates. The approach followed in a previous study(Soyler et al.,
187
2020) was used to determine the optimal flow rate of 0.5 mL/min.
188
Differentiation milk samples
189
Experiments were performed in 5 mm NMR tubes in static mode. For the quantitative analysis,
190
lactose, glycerol and fat contents were determined from the spectra as will be shown later.
191
Considering the factors given in Table 1 (country (TR/FR), milk type (Goat/Cow), production
192
style (Conventional/Organic), processing (UHT/Pasteurized), fat and sugar content), Analysis
193
of Variance (ANOVA), was conducted on the responses of glycerol; lactose and fat contents to
194
see if any of the responses showed differences with milk type. If significant difference was
195
detected, means were compared by the Tukey test (p < 0.05) using MINITAB (Version 19,
196
Coventry, U.K) software.
197
In addition, to obtain some grouping info for the given data set, an Artificial Neural Networks
198
(ANN) model was developed by using NMR spectra results. Artificial Neural Networks
199
(ANN) model is a nonlinear mathematical model with the capability of developing meaningful
200
relationships between input and output variables through a learning process (Zheng et al.,
201
2011). The function and organization of the human brain gave inspiration to its function and
202
structure (Bila et al., 1999). The mathematical model designed to classify milk samples with
203
respect to their fat and sugar contents, milk source, production and processing type was based
204
on nonlinear ANNs. These intelligent algorithms have been used to link chemical information
205
coming from 36 milk samples with milk type to achieve a potential tool for accurate
206
differentiation and quality control.
207
ANN model was implemented with the ‘neural net package’ (Version 1.44.2) in R (Stefan
208
Fritsch, Frauke Guenther, Marvin N. Wright, Marc Suling, & Sebastian M. Mueller, 2019).
209
For training (calibration), 2/3 of the data were used and 1/3 was separated to test the model
210
9
(external validation). In order to obtain the best score, ANN model was trained using different
211
number of neurons between 2 to 15 in the hidden layers. ANN model yielded possible
212
classifications of the samples and possibility ratios. R2cal was used to investigate the prediction
213
ability of the trained ANN model and R2pred for external validation. Error values were stated as
214
root mean square error of calibration (RMSEC) and root mean square error of prediction
215
(RMSEP). R2 values should be close to 1 while error values should be low to obtain a robust
216
prediction model (Uncu & Ozen, 2019). Optimal number of learning steps was selected
217
according to the minimum root means square error cross validation (RMSECV) value for the
218
calibration dataset. A value for R2 between 0.50 and 0.65 can be used for discrimination
219
between high and low concentrations. A value for R2 between 0.66 and 0.81 shows
220
approximate quantitative predictions., R2 between 0.82 and 0.90 are considered as good
221
prediction and above 0.91 are excellent (Saeys, Mouazen, & Ramon, 2005). Categorical
222
variables were used as binary data, while numeric data was used for normalization and scaling.
223
RESULTS and DISCUSSION
224
I. Lactose hydrolysis in continuous flow system
225
1D solvent suppression enhanced NMR Spectra
226
At first, 1D 1H NMR experiments were carried out with a water signal suppression pulse
227
sequence on model solutions of isolated compounds to identify the peaks which could be used
228
to monitor the lactose hydrolysis reactions. Fig. 1 shows the stacked spectra of glucose,
229
galactose and lactose alone. Due to low magnetic field, the spectra of the sugars were highly
230
overlapped. The suppressed water peak was observed at 4.9 ppm. As can be seen in Fig. 1,
231
alpha anomeric proton peaks of glucose, galactose and lactose are overlapped at 5.3 ppm.
232
Although beta anomeric proton peaks of glucose and galactose are masked by the water peak,
233
the beta anomeric proton peak of lactose is seen as a distinctive peak at 4.4 ppm. Despite the
234
fact that it is difficult to integrate only alpha lactose site due to alpha glucose and galactose
235
signal overlap, it is still possible to monitor the lactose hydrolysis with the isolated beta
236
anomeric signal. Moreover, anomeric ratio between alpha and beta anomers is constant during
237
10
the monitoring therefore it is reliable to follow the beta anomeric site along the course of the
238
hydrolysis.
239
240
Online Monitoring and Kinetic Modelling of Lactose Hydrolysis in the Model System
241
Lactose when hydrolyzed yields glucose and galactose as seen below.
242
243 244
For model lactose solution hydrolysis, a 5% lactose solution was hydrolyzed with 20 µL
245
lactase enzyme. The NMR spectra were obtained at 6 min intervals for 240 min (Fig. 2a). The
246
consumption of lactose can be seen from ß-lactose peaks (Fig 2b).
247
Concentrations of lactose for each time point were calculated using Equation 1. The number of
248
protons contributing to the signal was 9 for TSP, and 3 for imidazole.
249
= /
/ . (Eq.1)
250
C, and MW were the concentrations in mg/g, the molecular weight. REF referred to the
251
internal reference. A and N, denoted the integral area in a fully relaxed 1H NMR spectrum and
252
the number of hydrogens contributing to the signals. Hydrolysis experiments were repeated
253
three times and the change on the average concentrations of lactose from the experiments were
254
plotted as a function of time in Fig. 3.
255
Lactose data were fitted to Equation 2 (R2>0.99) and the average rate constant was found as
256 k=1.66*10-2 min-1 at 29°C. 257 = (Eq. 2) 258
Journal Pre-proof
11
Lactose Hydrolysis in Milk
259
Based on the good repeatability of the model lactose solution hydrolysis, milk was also
260
hydrolyzed with 20 µL of enzyme. Milk is a much more complex fluid than the model lactose
261
solution. The major constituents of milk are water, fat, proteins and lactose. Milk also contains
262
trace amounts of vitamins, minerals, organic acids, enzymes. Therefore, 1D 1H NMR spectrum
263
of milk was quite different than the model lactose solution (Fig. 4a). The NMR spectra were
264
obtained at each 7 min for 280 min. As seen in Fig. 4b, the consumption of lactose was
265
followed using the peak of ß-lactose. The average rate constant from the fractional conversion
266
model yield a value of 1.52x10⁻² min-1 at 29°C which was consistent with the previous study of
267
Panesar (2007) where it was found as 1.56x10⁻² min-1 at 30 oC (Fig. 5).
268
Results of this part showed that lactose hydrolysis can be controlled online in a continuous
269
mode successfully by using benchtop NMR spectroscopy, thus the method has high potential
270
to be adapted for industrial processes. For lactose free milk production, it should be ensured
271
that residual lactose amounts are within the legal limits for that product category. This can
272
further be confirmed by other high-resolution spectroscopic techniques.
273
II. Differentiation of Milk Samples by Benchtop 1H-NMR Profiling and
274
Chemometrics
275
In this part of the study, 36 milk samples of which the properties have been listed in Table 1
276
were analyzed. A sample spectrum of milk was given in Figure 4a. As seen in the spectrum,
277
there were broad fat peaks between 0.5 – 2.5 ppm. For the differentiation experiment of the
278
samples, integral area of glycerol, lactose and fat peak were used. The imidazole peak integral
279
area was used for the normalization of other peaks. The normalized integral areas are given in
280
Table 2. Lactose-free milks (LFM(T/F)) were found to have no lactose and half-fat milks
281
(HFM(T/F)) had nearly half fat content compared to whole milk samples.
282 283
12
Glycerol peak was observed next to ß-lactose peak between 4.0 – 4.25 ppm. When the
284
glycerol contents were compared, Turkish and French milks were found to be significantly
285
different from each other; glycerol contents of French milks being higher (p<0.05).
286
Two reasons could suggest for the presence of glycerol in the milk. Firstly, glycerol is used for
287
the treatment of ketosis which is a metabolic disease caused by the negative energy balance
288
during lactation (JOHNSON, 1954). And secondly, glycerol is used in the feed as an energy
289
source. Expansion of the biodiesel industry decreased the availability of corn for animal feed
290
and increased its prices. Therefore, glycerol which is also a by-product of the biodiesel
291
industry has started to be used as an energy source for cows (Carvalho, Schmelz-Roberts,
292
White, Doane, & Donkin, 2011). The energy concentration of glycerol (1.98-2.29 Mcal/kg) is
293
almost equal to corn starch (Schröder & Südekum, 1999). And inclusion of that in the diet was
294
eventually observed in the milk.
295
According to ANOVA results, only the fat and sugar status of the milk were found to be
296
significant for fat and lactose contents (p<0.05). Production type, country and processing were
297
found to be insignificant on lactose and fat content (p>0.05).
298
Artificial Neural Network (ANN) Model
299
As stated before, ANN was used as the multivariate approach for classification of the different
300
milk samples based on the outputs of the NMR spectra. The most commonly used quantitative
301
prediction multivariate technique is Partial Least Square Regression (PLSR), which is mostly
302
used to analyse spectroscopic data, especially FTIR. However, ANN was found to show much
303
better differentiative prediction ability as compared to other classification models
(Efenberger-304
Szmechtyk, Nowak, & Kregiel, 2018). This is explained with several reasons. ANNs learn
305
relationship between the input variables and the output values through successive trainings and
306
the non-linear technique allows model to fit the data better. Analysis is noise insensitive which
307
provides accurate prediction in the presence of noisy data (Berrueta, Alonso-Salces, &
308
Heberger, 2007). There has been several studies on foods which show that ANN is superior to
309
13
PLSR in prediction (Panagou, Mohareb, Argyri, Bessant, & Nychas, 2011; Perai, Moghaddam,
310
Asadpour, Bahrampour, & Mansoori, 2010; Vasquez et al., 2018).
311
In this work, ANN model has been designed and optimized to discriminate milk samples
312
according to their glycerol, lactose and fat peak areas obtained from the 1D NMR spectra. The
313
mathematical tool employed six categorical parameters (country, fat content, sugar content,
314
milk source, production type and processing type) as variables to accurately classify the milk
315
samples.
316
RMSECV values of the model were used to determine ruggedness of the model. The
317
breakpoint in the RMSECV vs. iteration number (step) plot were identified as the number of
318
iteration (step) parameter for the analyses. Following such an approach prevented
319
overtraining of the model. Since the RMSECV values are usually an integral part of the ANN
320
analysis, they were not saved thus not reported in the model. Feedforward supervised method
321
was used for training ANN model with 5 neurons and 2 neurons in the two hidden layers.
322
Multilayer feedforward neural network diagrams are also given in the supplement. RMSEC
323
value was obtained as 0.017 and R2cal was 0.997. When external validation data was fitted to
324
model, RMSEP was observed as 0.128 and R2pred was 0.819 and these values indicated good
325
prediction. Each sample was correctly classified in the cross validation (24/24), while one of
326
the 12 samples was misclassified in the external validation set (Fig. 6). These results showed
327
that glycerol, fat and lactose contents, supplied with information such as production type,
328
processing method, milk source and analysed with ANN, could be used to locate the origin
329
(geography) of milk.
330
ANN was also used to differentiate organic milk samples from conventional milks samples,
331
and pasteurized milk samples from UHT processed milk samples. For classification of organic
332
and conventional samples, RMSEC value was obtained as 0.121 and R2cal was 0.893. When
333
external validation data was fitted to model, RMSEP was observed as 0.232 and R2pred was
334
0.419. Although R2pred was relatively low, 0.42 is adequate for discrimination between distinct
335
classes. Prediction ability of model according to samples’ production type was 24 out of 24 for
336
14
calibration set and 9 out of 12 for validation set. In the validation set, two organic samples
337
were misclassified as conventional and one sample was misclassified as organic.
338
Same ANN parameters were used to classify pasteurized milk samples and UHT processed
339
milk samples. RMSEC for calibration set was 0.018 and RMSEP for prediction was 0.153. R2
340
for calibration was obtained as 0.999 while R2 for prediction was 0.851. Each sample in
341
calibration set and pasteurized samples in validation set were classified correctly while two of
342
UHT processed milk samples in validation set were misclassified. R2 for prediction value
343
showed that model was good enough for prediction.
344
In summary, the ANN model was successfully used to predict origins of milk samples,
345
production type and process type. For all parameters evaluated in the study, the maximum
346
number of incorrect matches was 2 which was a good indicator for the strong classification
347
ability of the model. These results confirmed the existence of a relationship between the six
348
categorical parameters and three main components in the classification of milks, leading to
349
potential design of an objective evaluating method for classification of diverse milk samples.
350
The model supported potential use of benchtop NMR spectra for differentiating milk samples
351
and provided input for a more comprehensive authentication study.
352
CONCLUSION
353
Milk is a very valuable food for the human being. Ensuring its quality and authenticity is
354
significant. In this study, multiple aspects of benchtop NMR spectroscopy have been evaluated
355
to investigate its potential as a multi-scale control tool at different stages of milk production.
356
The first part of the study focused on the online monitoring of lactose hydrolysis in milk.
357
Enzymatic hydrolysis of lactose was successfully followed and a kinetic model was obtained
358
in agreement with previous studies. In the second part, milk samples that have different
359
properties were examined. Glycerol, fat, sugar content of the milks was obtained from the
360
NMR spectra and an Artificial Neural Network (ANN) model was developed to seek for
361
classifications based on the production, processing type, milk source and geographic origin.
362
The developed model supported the potential use of benchtop NMR spectra for differentiating
363
15
milk samples. Overall, it was shown that even for a complex fluid like milk, benchtop NMR
364
spectroscopy provides valuable information and the technique after a full analytical validation
365
that is out of the scope of this proof-of-concept study has the potential to be used in industry
366
for monitoring production, quality control and authenticity determination (but on larger
367
sample set).
368
Funding: Alper Soyler got funding from Short Term Scientific Mission (STSM) program
369
under COST Action CA15209 EURELAX – European Network on NMR Relaxometry
370
(http://www.cost.eu/COST_Actions/ca/CA15209) to conduct experiments at the University of
371
Nantes. Authors from Nantes acknowledge support from the Corsaire metabolomics core
372
facility (Biogenouest). J.F. acknowledges Sandrine Bouchet for a continuous essential
373
assistance. Middle East Technical University, Scientific Research Projects Coordination Unit
374
with grant # BAP-07-02-2017-004-077 is also acknowledged.
375
REFERENCES
376
Anderssen, K. E., & McCarney, E. R. (2020). Online monitoring of enzymatic hydrolysis of
377
marine by-products using benchtop nuclear magnetic resonance spectroscopy. Food
378
Control, 112(September 2019), 107053. https://doi.org/10.1016/j.foodcont.2019.107053
379
Bergamaschi, M., Cipolat-Gotet, C., Cecchinato, A., Schiavon, S., & Bittante, G. (2020).
380
Chemometric authentication of farming systems of origin of food (milk and ripened
381
cheese) using infrared spectra, fatty acid profiles, flavor fingerprints, and sensory
382
descriptions. Food Chemistry. https://doi.org/10.1016/j.foodchem.2019.125480
383
Berrueta, L. A., Alonso-Salces, R. M., & Heberger, K. (2007). Supervised pattern recognition
384
in food analysis. Journal of Chromatography A, 1158(1–2), 196–214.
385
https://doi.org/10.1016/j.chroma.2007.05.024
386
Bertram, H. C. (2018). NMR-Based Metabolomics: Quality and Authenticity of Milk and
387
Meat. In Modern Magnetic Resonance (pp. 1–13). Springer.
388
Bila, S., Harkouss, Y., Ibrahim, M., Rousset, J., N’Goya, E., Baillargeat, D., … Guillon, P.
389
(1999). Accurate wavelet neural-network-based model for electromagnetic optimization
390
16
of microwave circuits. International Journal of RF and Microwave Computer-Aided
391
Engineering.
https://doi.org/10.1002/(SICI)1099-047X(199905)9:3<297::AID-392
MMCE13>3.0.CO;2-W
393
Bouillaud, D., Drouin, D., Charrier, B., Jacquemmoz, C., Farjon, J., Giraudeau, P., &
394
Gonçalves, O. (2020). Using benchtop NMR spectroscopy as an online non-invasive in
395
vivo lipid sensor for microalgae cultivated in photobioreactors. Process Biochemistry,
396
93(January), 63–68. https://doi.org/10.1016/j.procbio.2020.03.016
397
Bouillaud, D., Farjon, J., Gonçalves, O., & Giraudeau, P. (2019). Benchtop NMR for the
398
monitoring of bioprocesses. Magnetic Resonance in Chemistry, 57(10), 794–804.
399
https://doi.org/10.1002/mrc.4821
400
Bouillaud, D., Heredia, V., Castaing-Cordier, T., Drouin, D., Charrier, B., Gonçalves, O., …
401
Giraudeau, P. (2019). Benchtop flow NMR spectroscopy as an online device for the in
402
vivo monitoring of lipid accumulation in microalgae. Algal Research, 43(July), 101624.
403
https://doi.org/10.1016/j.algal.2019.101624
404
Buitenhuis, A. J., Sundekilde, U. K., Poulsen, N. A., Bertram, H. C., Larsen, L. B., &
405
Sørensen, P. (2013). Estimation of genetic parameters and detection of quantitative trait
406
loci for metabolites in Danish Holstein milk. Journal of Dairy Science.
407
https://doi.org/10.3168/jds.2012-5914
408
Carvalho, E. R., Schmelz-Roberts, N. S., White, H. M., Doane, P. H., & Donkin, S. S. (2011).
409
Replacing corn with glycerol in diets for transition dairy cows. Journal of Dairy Science.
410
https://doi.org/10.3168/jds.2010-3581
411
Churakova, E., Peri, K., Vis, J. S., Smith, D. W., Beam, J. M., Vijverberg, M. P., … Winter, R.
412
T. (2019). Accurate analysis of residual lactose in low-lactose milk: Comparing a variety
413
of analytical techniques. International Dairy Journal, 96, 126–131.
414
https://doi.org/10.1016/j.idairyj.2019.02.020
415
Danieli, E., Perlo, J., Blümich, B., & Casanova, F. (2013). Highly stable and finely tuned
416
magnetic fields generated by permanent magnet assemblies. Physical Review Letters.
417
https://doi.org/10.1103/PhysRevLett.110.180801
418
17
Danieli, Ernesto, Perlo, J., Blümich, B., & Casanova, F. (2010). Small magnets for portable
419
NMR spectrometers. Angewandte Chemie - International Edition.
420
https://doi.org/10.1002/anie.201000221
421
Defernez, M., Wren, E., Watson, A. D., Gunning, Y., Colquhoun, I. J., Le Gall, G., …
422
Kemsley, E. K. (2017). Low-field 1H NMR spectroscopy for distinguishing between
423
arabica and robusta ground roast coffees. Food Chemistry.
424
https://doi.org/10.1016/j.foodchem.2016.08.028
425
Dong, L., & Zhong, Q. (2019). Dispersible Biopolymer Particles Loaded with Lactase as a
426
Potential Delivery System to Control Lactose Hydrolysis in Milk. Journal of
427
Agricultural and Food Chemistry, 67(23), 6559–6568.
428
https://doi.org/10.1021/acs.jafc.9b01546
429
Dutra Rosolen, M., Gennari, A., Volpato, G., & Volken De Souza, C. F. (2015). Lactose
430
Hydrolysis in Milk and Dairy Whey Using Microbial β-Galactosidases. Enzyme
431
Research, 2015. https://doi.org/10.1155/2015/806240
432
Efenberger-Szmechtyk, M., Nowak, A., & Kregiel, D. (2018). Implementation of
433
chemometrics in quality evaluation of food and beverages. Critical Reviews In Food
434
Science and Nutrition, 58(10), 1747–1766.
435
https://doi.org/10.1080/10408398.2016.1276883
436
Gouilleux, B., Charrier, B., Akoka, S., & Giraudeau, P. (2017a). Gradient-based solvent
437
suppression methods on a benchtop spectrometer. Magnetic Resonance in Chemistry.
438
https://doi.org/10.1002/mrc.4493
439
Gouilleux, B., Charrier, B., Akoka, S., & Giraudeau, P. (2017b). Gradient-based solvent
440
suppression methods on a benchtop spectrometer. Magnetic Resonance in Chemistry.
441
https://doi.org/10.1002/mrc.4493
442
Jakes, W., Gerdova, A., Defernez, M., Watson, A. D., McCallum, C., Limer, E., … Kemsley,
443
E. K. (2015). Authentication of beef versus horse meat using 60 MHz 1H NMR
444
spectroscopy. Food Chemistry. https://doi.org/10.1016/j.foodchem.2014.11.110
445
Jansson, T., Jensen, H. B., Sundekilde, U. K., Clausen, M. R., Eggers, N., Larsen, L. B., …
446
18
Bertram, H. C. (2014). Chemical and proteolysis-derived changes during long-term
447
storage of lactose-hydrolyzed ultrahigh-temperature (UHT) milk. Journal of Agricultural
448
and Food Chemistry. https://doi.org/10.1021/jf504104q
449
Johnson, R. B. (1954). The treatment of ketosis with glycerol and propylene glycol. The
450
Cornell Veterinarian.
451
Knox, S. T., Parkinson, S., Stone, R., & Warren, N. J. (2019). Benchtop flow-NMR for rapid
452
online monitoring of RAFT and free radical polymerisation in batch and continuous
453
reactors. Polymer Chemistry, 10(35), 4774–4778. https://doi.org/10.1039/c9py00982e
454
Monakhova, Y. B., Kuballa, T., Leitz, J., Andlauer, C., & Lachenmeier, D. W. (2012). NMR
455
spectroscopy as a screening tool to validate nutrition labeling of milk, lactose-free milk,
456
and milk substitutes based on soy and grains. Dairy Science and Technology, 92(2), 109–
457
120. https://doi.org/10.1007/s13594-011-0050-5
458
Panagou, E. Z., Mohareb, F. R., Argyri, A. A., Bessant, C. M., & Nychas, G.-J. E. (2011). A
459
comparison of artificial neural networks and partial least squares modelling for the rapid
460
detection of the microbial spoilage of beef fillets based on Fourier transform infrared
461
spectral fingerprints. FOOD MICROBIOLOGY, 28(4, SI), 782–790.
462
https://doi.org/10.1016/j.fm.2010.05.014
463
Perai, A. H., Moghaddam, H. N., Asadpour, S., Bahrampour, J., & Mansoori, G. (2010). A
464
comparison of artificial neural networks with other statistical approaches for the
465
prediction of true metabolizable energy of meat and bone meal. Poultry Science, 89(7),
466
1562–1568. https://doi.org/10.3382/ps.2010-00639
467
Perlo, J., Demas, V., Casanova, F., Meriles, C. A., Reimer, J., Pines, A., & Blu, B. (2005).
468
High-Resolution NMR Spectroscopy with a Portable Single-Sided Sensor, (May).
469
https://doi.org/10.1126/science.1108944
470
Rönnols, J., Danieli, E., Freichels, H., & Aldaeus, F. (2020). Lignin analysis with benchtop
471
NMR spectroscopy. Holzforschung, 74(2), 226–231.
https://doi.org/10.1515/hf-2018-472
0282
473
Saeys, W., Mouazen, A. M., & Ramon, H. (2005). Potential for onsite and online analysis of
474
19
pig manure using visible and near infrared reflectance spectroscopy. Biosystems
475
Engineering, 91(4), 393–402. https://doi.org/10.1016/j.biosystemseng.2005.05.001
476
Schröder, A., & Südekum, K.-H. (1999). Glycerol as a by-product of biodiesel production in
477
diets for ruminants. New Horizons for an Old Crop. Proc. 10th Int. Rapeseed Congr.
478
Sobolev, A. P., Thomas, F., Donarski, J., Ingallina, C., Circi, S., Cesare Marincola, F., …
479
Mannina, L. (2019). Use of NMR applications to tackle future food fraud issues. Trends
480
in Food Science and Technology, 91(March 2018), 347–353.
481
https://doi.org/10.1016/j.tifs.2019.07.035
482
Soyler, A., Bouillaud, D., Farjon, J., Giraudeau, P., & Oztop, M. H. (2020). Real-time
483
benchtop NMR spectroscopy for the online monitoring of sucrose hydrolysis. LWT.
484
https://doi.org/10.1016/j.lwt.2019.108832
485
Stefan Fritsch, Frauke Guenther, Marvin N. Wright, Marc Suling, & Sebastian M. Mueller.
486
(2019). Package “neuralnet” Training of Neural Networks, 1–15.
487
Uncu, O., & Ozen, B. (2019). A comparative study of mid-infrared, UV-Visible and
488
fluorescence spectroscopy in combination with chemometrics for the detection of
489
adulteration of fresh olive oils with old olive oils. Food Control, 105, 209–218.
490
https://doi.org/10.1016/j.foodcont.2019.06.013
491
Vasquez, N., Magan, C., Oblitas, J., Chuquizuta, T., Avila-George, H., & Castro, W. (2018).
492
Comparison between artificial neural network and partial least squares regression models
493
for hardness modeling during the ripening process of Swiss-type cheese using spectral
494
profiles. Journal of Food Engineering, 219, 8–15.
495
https://doi.org/10.1016/j.jfoodeng.2017.09.008
496
Zheng, H., Jiang, L., Lou, H., Hu, Y., Kong, X., & Lu, H. (2011). Application of Artificial
497
Neural Network (ANN) and Partial Least-Squares Regression (PLSR) to predict the
498
changes of anthocyanins, ascorbic acid, total phenols, flavonoids, and antioxidant
499
activity during storage of red bayberry juice based on fractal ana. Journal of Agricultural
500
and Food Chemistry, 59(2), 592–600. https://doi.org/10.1021/jf1032476
501
502
20 503 504 505 506 507 508 509 510 511 512 513 Figure Captions 514
Figure 1. Stacked spectra of glucose, galactose and lactose
515
Figure 2. a) Full superimposed spectra of lactose hydrolysis of model lactose solution b)
ß-516
lactose region
517
Figure 3. Hydrolysis of lactose for the model system
518
Figure 4. 1D 1H NMR spectrum of milk with the assignment for its main constituents (a)
519
Superimposed spectra of lactose hydrolysis in milk (b)
520
Figure 5. Hydrolysis of lactose in a real milk sample
521
Figure 6 The confusion matrices for training dataset (left) and test dataset (right).
522
523
524
525
21 526 527 528 529 530 531 532 533 534 535 TABLES 536
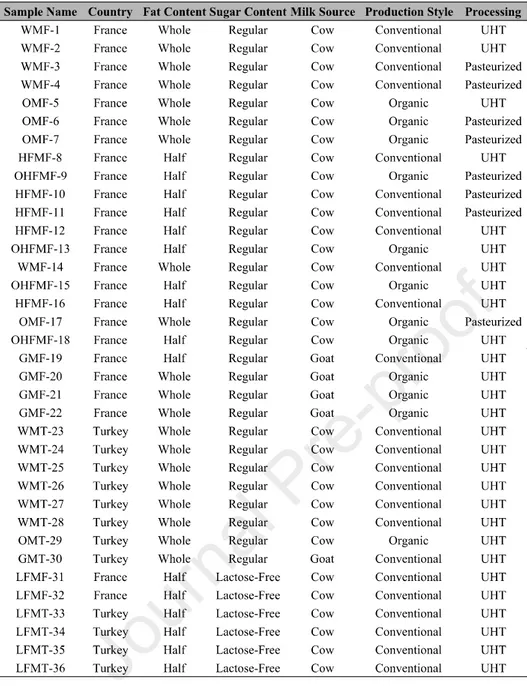
Table 1 Milk samples used in the study
537
22 538 539 540 541 542 543
Table 2. Integral areas of glycerol, lactose and fat NMR peaks of analysed milks, normalized
544
to the imidazole signal.
545
23 546 547 548 549 550 551 552 553 554 555 556 557
Journal Pre-proof
24 558 559 Fig. 1 560 561 562 563 564 565 566 567 568 569 570 571 572
Journal Pre-proof
25 573 574 Fig. 2 575 576 577 a b
Journal Pre-proof
26 578 579 580 581 582 583 Fig. 3 584 585 586 587
Journal Pre-proof
27 588 589 590 591 592 Fig 4. 593 a b
Journal Pre-proof
28 594 595 596 597 598 599 600 601 602 603 604 605 606 607 608 609 610 Fig. 5 611
Journal Pre-proof
29 612 613 Fig. 6 614 615 616
Journal Pre-proof
Sample Name Country Fat Content Sugar Content Milk Source Production Style Processing
WMF-1 France Whole Regular Cow Conventional UHT WMF-2 France Whole Regular Cow Conventional UHT WMF-3 France Whole Regular Cow Conventional Pasteurized WMF-4 France Whole Regular Cow Conventional Pasteurized
OMF-5 France Whole Regular Cow Organic UHT
OMF-6 France Whole Regular Cow Organic Pasteurized OMF-7 France Whole Regular Cow Organic Pasteurized HFMF-8 France Half Regular Cow Conventional UHT OHFMF-9 France Half Regular Cow Organic Pasteurized
HFMF-10 France Half Regular Cow Conventional Pasteurized HFMF-11 France Half Regular Cow Conventional Pasteurized HFMF-12 France Half Regular Cow Conventional UHT
OHFMF-13 France Half Regular Cow Organic UHT
WMF-14 France Whole Regular Cow Conventional UHT
OHFMF-15 France Half Regular Cow Organic UHT
HFMF-16 France Half Regular Cow Conventional UHT OMF-17 France Whole Regular Cow Organic Pasteurized
OHFMF-18 France Half Regular Cow Organic UHT
GMF-19 France Half Regular Goat Conventional UHT GMF-20 France Whole Regular Goat Organic UHT GMF-21 France Whole Regular Goat Organic UHT GMF-22 France Whole Regular Goat Organic UHT WMT-23 Turkey Whole Regular Cow Conventional UHT WMT-24 Turkey Whole Regular Cow Conventional UHT WMT-25 Turkey Whole Regular Cow Conventional UHT WMT-26 Turkey Whole Regular Cow Conventional UHT WMT-27 Turkey Whole Regular Cow Conventional UHT WMT-28 Turkey Whole Regular Cow Conventional UHT
OMT-29 Turkey Whole Regular Cow Organic UHT
GMT-30 Turkey Whole Regular Goat Conventional UHT LFMF-31 France Half Lactose-Free Cow Conventional UHT LFMF-32 France Half Lactose-Free Cow Conventional UHT LFMT-33 Turkey Half Lactose-Free Cow Conventional UHT LFMT-34 Turkey Half Lactose-Free Cow Conventional UHT LFMT-35 Turkey Half Lactose-Free Cow Conventional UHT LFMT-36 Turkey Half Lactose-Free Cow Conventional UHT
Sample
Name Glycerol Lactose Fat
Sample
Name Glycerol Lactose Fat
WMF-1 1.126 ± 0.0003 18.023± 0.0108 40.585± 0.0209 GMF-19 0.723 ± 0.0006 20.1 ± 0.0301 27.899 ± 0.0089 WMF-2 1.204 ± 0.0037 21.068 ± 0.0582 49.632 ± 0.1252 GMF-20 0.749 ± 0.0004 17.719 ± 0.0146 47.585 ± 0.0178 WMF-3 0.845 ± 0.0005 18.416 ± 0.0047 44.177 ± 0.0169 GMF-21 0.841 ± 0.0017 20.372 ± 0.0191 46.935 ± 0.0752 WMF-4 1.022 ± 0.0019 21.37 ± 0.0097 49.785 ± 0.0029 GMF-22 1.006 ± 0.0012 18.727 ± 0.0215 52.168 ± 0.0439 OMF-5 1.006 ± 0.0001 18.631 ± 0.0031 47.615 ± 0.0068 WMT-23 0.863 ± 0.0006 19.08 ± 0.0208 44.018 ± 0.0429 OMF-6 1.043 ± 0.0003 20.927 ± 0.0033 55.941 ± 0.0076 WMT-24 1.007 ± 0.0024 19.483 ± 0.0295 48.226 ± 0.0474 OMF-7 0.576 ± 0.0010 19.352 ± 0.0090 48.897 ± 0.0210 WMT-25 0.279 ± 0.0020 22.412 ± 0.0668 45.022 ± 0.0609 HFMF-8 0.687 ± 0.0008 20.311 ± 0.0015 25.845 ± 0.0284 WMT-26 0.428 ± 0.0010 18.615 ± 0.0257 41.632 ± 0.0496 OHFMF-9 0.275 ± 0.0002 19.461 ± 0.0211 20.38 ± 0.0286 WMT-27 0.772 ± 0.0004 18.911 ± 0.0092 44.755 ± 0.0124 HFMF-10 0.472 ± 0.0004 20.384 ± 0.0047 25.257 ± 0.0235 WMT-28 0.23 ± 0.0006 19.651 ± 0.0275 44.747 ± 0.0299 HFMF-11 0.195 ± 0.0012 22.737 ± 0.0488 24.772 ± 0.0430 OMT-29 0.175 ± 0.0005 22.332 ± 0.0176 46.65 ± 0.0544 HFMF-12 0.55 ± 0.0004 22.638 ± 0.0188 25.964 ± 0.0748 GMT-30 0.163 ± 0.0012 19.955 ± 0.0248 44.893 ± 0.0698 OHFMF-13 0.7 ± 0.0015 23.062 ± 0.0313 28.13 ± 0.0998 LFMF-31 0.436 ± 0.0014 0 24.89 ± 0.0947 WMF-14 0.956 ± 0.0007 21.808 ± 0.0065 57.543 ± 0.0135 LFMF-32 0.123 ± 0.0004 0 24.288 ± 0.0186 OHFMF-15 0.522 ± 0.0009 18.763 ± 0.0165 22.294 ± 0.0364 LFMT-33 0.412 ± 0.0016 0 22.52 ± 0.0412 HFMF-16 0.502 ± 0.0052 18.866 ± 0.04292 22.594 ± 0.1573 LFMT-34 0.297 ± 0.0009 0 23.29 ± 0.01711 OMF-17 0.817 ± 0.0007 22.858 ± 0.0236 57.398 ± 0.0498 LFMT-35 0.373 ± 0.0006 0 20.793 ± 0.0204
Highlights
o Multiple aspects of benchtop NMR spectroscopy were used to analyze milk. o Benchtop system was adapted to follow lactose hydrolysis in milk in flow mode. o Combination of spectroscopic and multivariate approaches enabled to classify milk. o Benchtop NMR spectroscopy was shown as a method to control and ensure milk quality.
Declaration of Interest
All authors declare no conflict of interest.
Publication has been approved by all individual participants.