Université de Montréal
The French Canadian founder population:
lessons and insights for genetic epidemiological research
par Héloïse Gauvin
Département de médecine sociale et préventive École de Santé publique
Thèse présentée à l’École de Santé Publique
en vue de l’obtention du grade de Philosophiae Doctor (PhD) en Santé Publique
option Épidémiologie
Université de Montréal
Faculté des études supérieures et postdoctorales
Cette thèse intitulée :
The French Canadian founder population:
lessons and insights for genetic epidemiological research
présentée par : Héloïse Gauvin
a été évaluée par un jury composé des personnes suivantes :
Dr. Anne-Marie Laberge, président-rapporteur Dr. Philip Awadalla, directeur de recherche Dr. Marie-Pierre Dubé, codirectrice de recherche
Dr. Marie-Élise Parent, membre de jury Dr. Marc Tremblay, examinateur externe Dr. Guillaume Lettre, représentant du doyen de la FES
Résumé
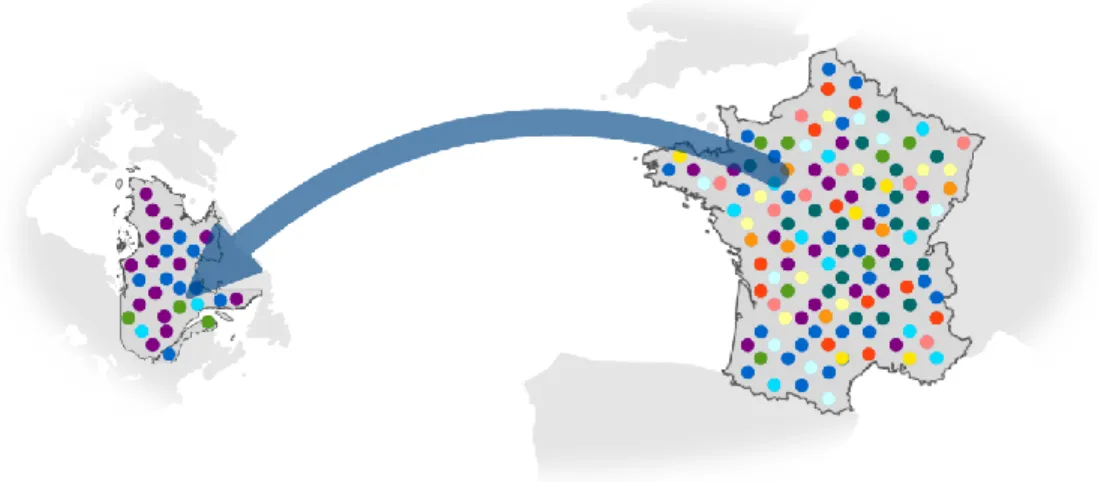
La population canadienne-française a une histoire démographique unique faisant d’elle une population d’intérêt pour l’épidémiologie et la génétique. Cette thèse vise à mettre en valeur les caractéristiques de la population québécoise qui peuvent être utilisées afin d’améliorer la conception et l’analyse d’études d’épidémiologie génétique. Dans un premier temps, nous profitons de la présence d’information généalogique détaillée concernant les Canadiens français pour estimer leur degré d’apparentement et le comparer au degré d’apparentement génétique. L’apparentement génétique calculé à partir du partage génétique identique par ascendance est corrélé à l’apparentement généalogique, ce qui démontre l'utilité de la détection des segments identiques par ascendance pour capturer l’apparentement complexe, impliquant entre autres de la consanguinité. Les conclusions de cette première étude pourront guider l'interprétation des résultats dans d’autres populations ne disposant pas d’information généalogique. Dans un deuxième temps, afin de tirer profit pleinement du potentiel des généalogies canadienne-françaises profondes, bien conservées et quasi complètes, nous présentons le package R GENLIB, développé pour étudier de grands ensembles de données généalogiques. Nous étudions également le partage identique par ascendance à l’aide de simulations et nous mettons en évidence le fait que la structure des populations régionales peut faciliter l'identification de fondateurs importants, qui auraient pu introduire des mutations pathologiques, ce qui ouvre la porte à la prévention et au dépistage de maladies héréditaires liées à certains fondateurs. Finalement, puisque nous savons que les Canadiens français ont accumulé des segments homozygotes, à cause de la présence de consanguinité lointaine, nous estimons la consanguinité chez les individus canadiens-français et nous étudions son impact sur plusieurs traits de santé. Nous montrons comment la dépression endogamique influence des traits complexes tels que la grandeur et des traits hématologiques. Nos résultats ne sont que quelques exemples de ce que nous pouvons apprendre de la population canadienne-française. Ils nous aideront à mieux comprendre les caractéristiques des autres populations de même qu’ils pourront aider la recherche en épidémiologie génétique au sein de la population
Mots-clés : Population canadienne-française, épidémiologie génétique, partage identique par ascendance, analyse généalogique, génétique des populations, consanguinité lointaine, dépression endogamique.
Abstract
The French Canadian founder population has a demographic history that makes it an important population for epidemiology and genetics. This work aims to explain what features can be used to improve the design and analysis of genetic epidemiological studies in the Quebec population. First we take advantage of the presence of extended genealogical records among French Canadians to estimate relatedness from those records and compare it to the genetic kinship. The kinship based on identical-by-descent sharing correlates well with the genealogical kinship, further demonstrating the usefulness of genomic identical-by-descent detection to capture complex relatedness involving inbreeding and our findings can guide the interpretation of results in other population without genealogical data. Second to optimally exploit the full potential of these well preserved, exhaustive and detailed French Canadian genealogical data we present the GENLIB R package developed to study large genealogies. We also investigate identical-by-descent sharing with simulations and highlight the fact that regional population structure can facilitate the identification of notable founders that could have introduced disease mutations, opening the door to prevention and screening of founder-related diseases. Third, knowing that French Canadians have accumulated segments of homozygous genotypes, as a result of inbreeding due to distant ancestors, we estimate the inbreeding in French Canadian individuals and investigate its impact on multiple health traits. We show how inbreeding depression influences complex traits such as height and blood-related traits. Those results are a few examples of what we can learn from the French Canadian population and will help to gain insight on other populations’ characteristics as well as help the genetic epidemiological research within the French Canadian population.
Keywords : French Canadian population, genetic epidemiology, identical-by-descent sharing, genealogical analysis, population genetics, distant consanguinity, inbreeding depression.
Table of Contents
RÉSUMÉ III
ABSTRACT V
TABLE OF CONTENTS VI
LIST OF TABLES XI
LIST OF FIGURES XII
ABBREVIATIONS AND ACRONYMS XIII
ACKNOWLEDGMENTS XVI
CHAPTER 1: INTRODUCTION 1
1.1. Genetic epidemiology 2
1.1.1. Historical perspectives 2
1.1.2. Advantages and limitations of genome-wide association studies 4
1.1.3. Past successes and future directions 6
1.2. Founder populations 9
1.2.1. Their advantages 9
1.2.2. Challenges 13
1.2.3. Examples 15
1.3. French Canadian founder population 18
1.3.1. A brief history of the peopling of Quebec 18
1.3.2. Genetic profile of the French Canadian population 25
1.3.4. CARTaGENE overview 31
1.4. Relatedness 33
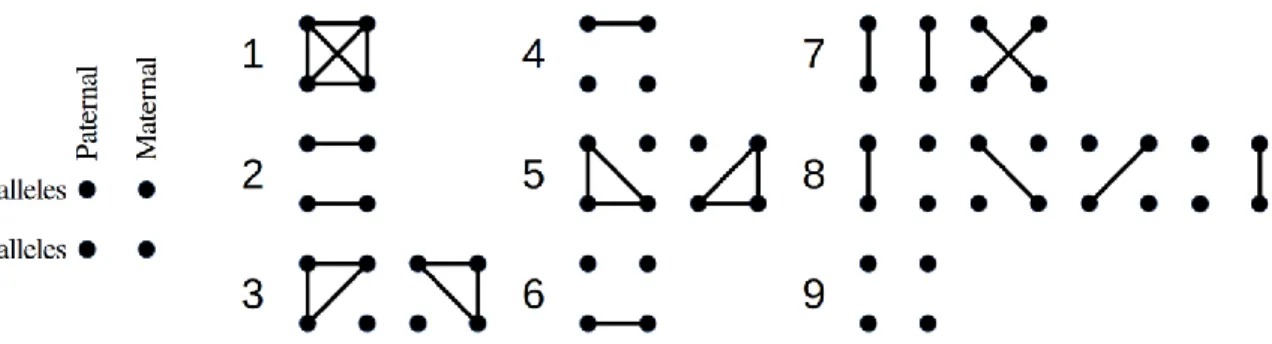
1.4.1. Theoretical expectations 33
1.4.2. Identical-by-descent and observed sharing 35
1.4.3. The case of inbreeding 40
1.5. Research questions and thesis outline 42
CHAPTER 2: GENOME-WIDE PATTERNS OF IDENTITY-BY-DESCENT SHARING IN
THE FRENCH CANADIAN FOUNDER POPULATION 45
Authors’ contribution 46
Acknowledgements 46
Abstract 47
Introduction 48
Material and Methods 52
Study population 52
Genotyping and quality control 52
Genealogical data and associated measures 53
Genomic IBD sharing 54
Statistical analysis 55
Results 56
Genealogical description 56
Comparison of different IBD sharing detection methods 58
Genealogical measures versus inferred IBD sharing 60
Discussion 66
Supplementary Figures and Tables 69
CHAPTER 3: GENLIB: AN R PACKAGE FOR THE ANALYSIS OF GENEALOGICAL DATA 76 Authors’ contribution 77 Acknowledgements 77 Abstract 78 Background 80 Implementation 82 Overview 82 Functions implemented 82
Datasets and simulations 87
Results 88
Description of genealogical data using GENLIB 88
Gene-dropping simulations using GENLIB 92
Discussion 97
Conclusions 99
Supplementary Figures and Tables 100
CHAPTER 4: DISTANT INBREEDING AMONG FRENCH CANADIANS AND
ASSOCIATIONS WITH HEALTH-RELATED TRAITS 109
Acknowledgements 110
Abstract 111
Introduction 112
Materials and methods 115
Participants and phenotyping 115
Genotyping 116
Population genetics 116
ROH detection 117
Inbreeding depression analysis 117
Results 118
Capturing individuals of French Canadian ancestry 118
Homozygosity 121
Association between inbreeding and traits 122
Discussion 125
Supplementary Figures and Tables 129
CHAPTER 5: DISCUSSION 136
5.1. Summary and discussion of main findings 137
5.1.1. Family relationships and genetics 137
5.1.2. Strengths and limitations of the studies 140
5.2. Future perspectives 145
5.2.1. Identical-by-descent sharing 145
5.2.2. Genealogical information 146
REFERENCES 153
List of Tables
Table 1.1 Population isolates 16
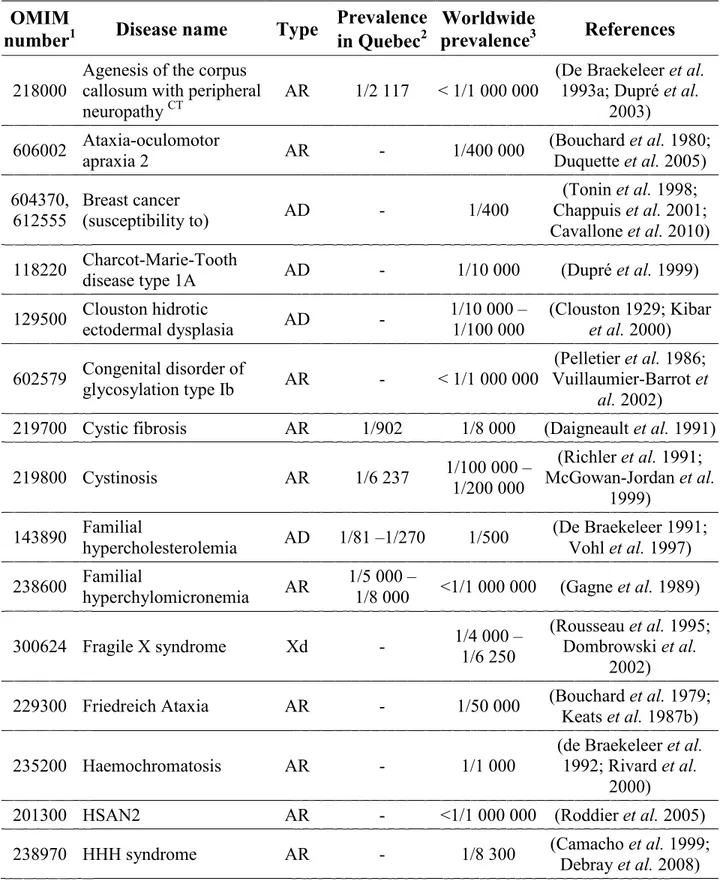
Table 1.2 Examples of inherited diseases found in the French Canadian
population 26
Table 2.1 Pearson’s correlation coefficients between total length of IBD sharing and kinship coefficients for each population and each
method 59
Table 2.2 List of the 109 HapMap CEU samples used 72
Table 2.3 IBD inference methods used and options (default or not) specified
for each one 73
Table 2.4 Runtime comparison for the different IBD inference methods 74
Table 3.1 Overview of GENLIB functions 83
Table 3.2 Formulas of genealogical measures in GENLIB 85
Table 3.3 Selected segments shared IBD by two pairs of individuals 94 Table 4.1 Descriptive statistics for number of ROHs and proportion of
genome covered by ROHs (FROH) 121
Table 4.2 Analysis of the association of the proportion of genome covered by
ROHs (FROH) and various phenotypes 123
Table 4.3 Summary statistics for all phenotypes in French Canadians 132
List of Figures
Figure 1.1 Founder effect 9
Figure 1.2 Map of the regions of Québec 19
Figure 1.3 The fifteen identity states grouped in nine condensed states 34
Figure 1.4 Identical-by-descent transmission 36
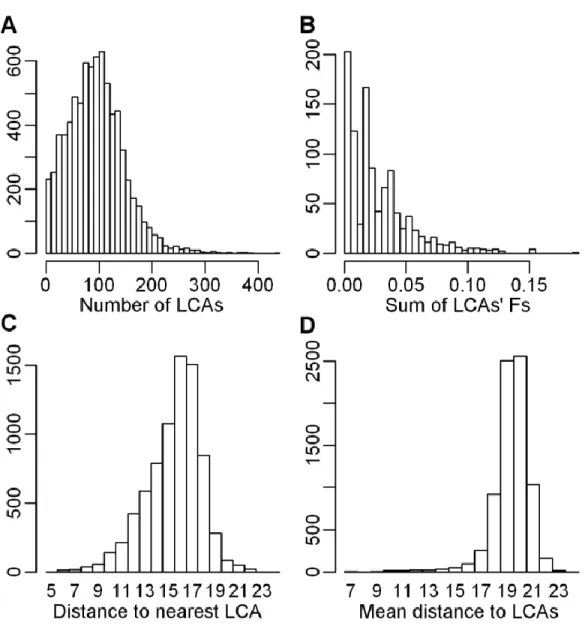
Figure 2.1 Distributions of genealogical characteristics 57
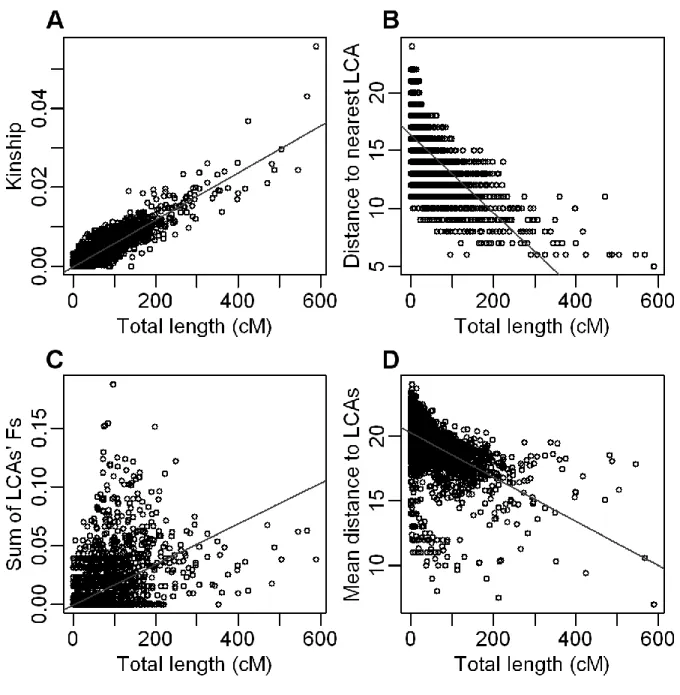
Figure 2.2 IBD sharing and genealogical characteristics 61
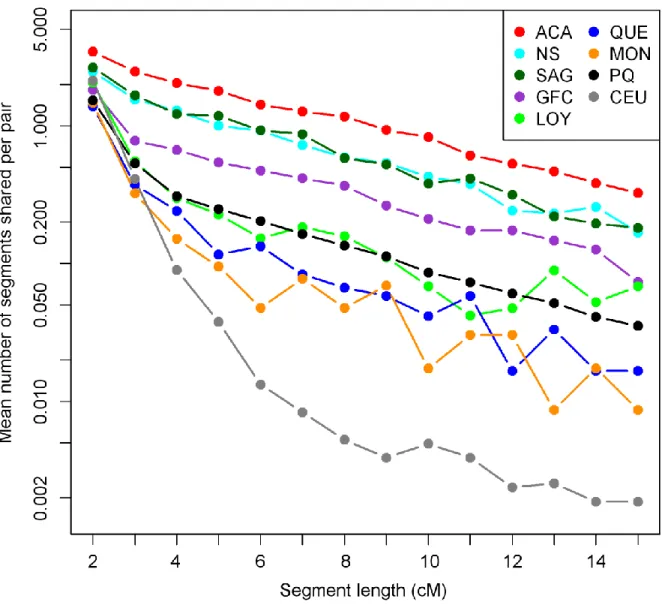
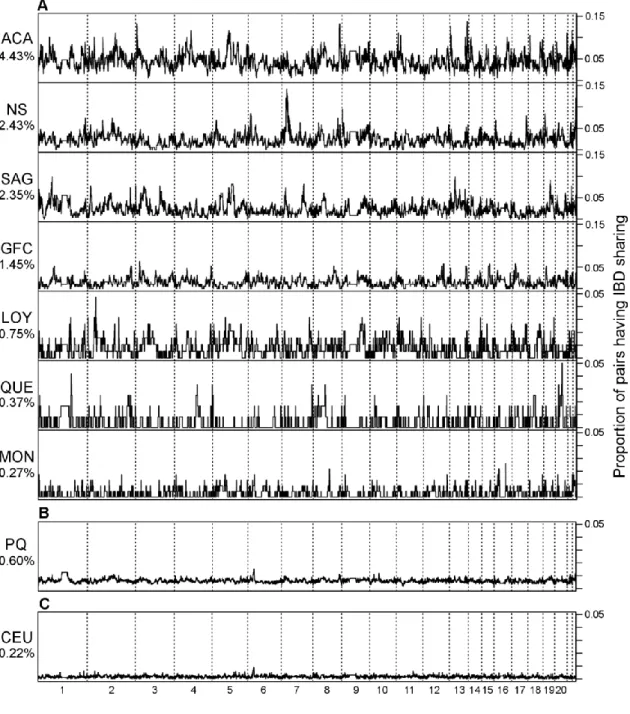
Figure 2.3 Pairwise IBD sharing in each population 63
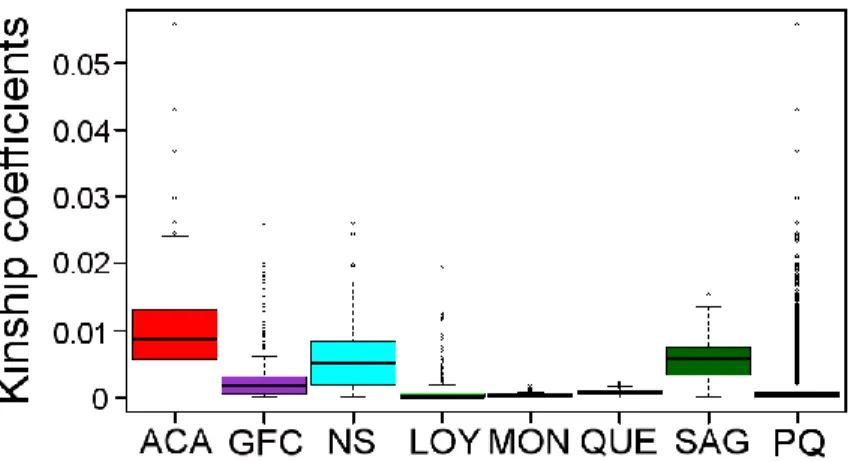
Figure 2.4 Genome-wide patterns of IBD sharing in each population 65 Figure 2.5 Boxplot of genealogical kinship coefficients for each population 69 Figure 2.6 Scatterplots of total length of IBD sharing versus kinship
coefficients for the whole sample 70
Figure 2.7 IBD sharing and inbreeding 71
Figure 3.1 Completeness and implex indices for the Quebec genealogical
corpus 88
Figure 3.2 Cumulative genetic contribution of founders for each population 91 Figure 3.3 Estimated probabilities of sharing one allele IBD versus ancestors’
genetic contributions 93
Figure 3.4 Estimated probabilities of IBD sharing for a segment versus one
allele 95
Figure 3.5 Genealogy of a highly inbred individual 100
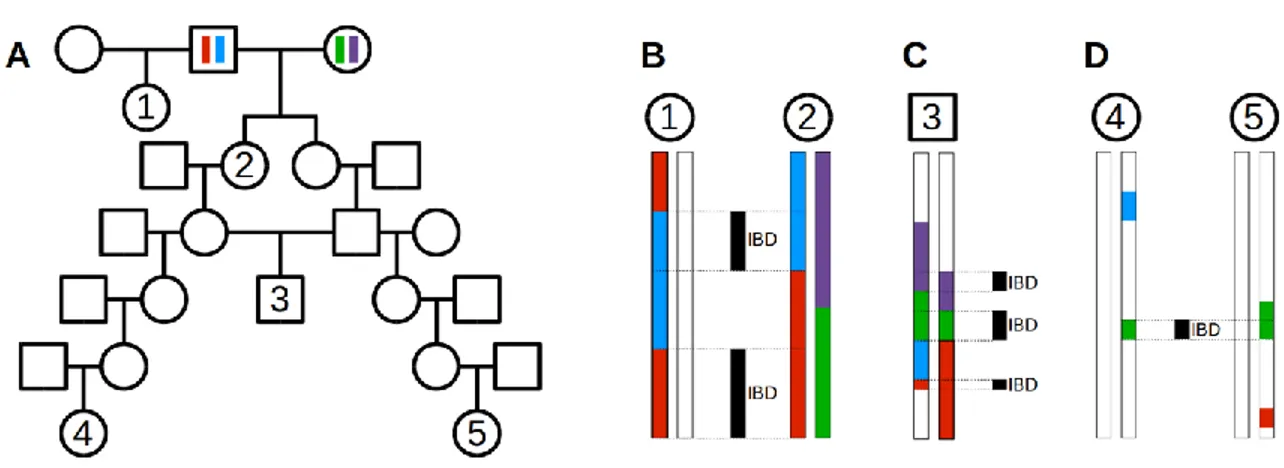
Figure 3.6 Genealogical example showing different types of common
ancestors 101
Figure 4.1 PCA on individuals of European descent 119
Figure 4.2 Population tree 120
Figure 4.3 PCAs on all individuals 129
Figure 4.4 PCA on genotypes from individuals having a European descent 130 Figure 4.5 PCA on genotypes from French Canadians individuals 131
Abbreviations and Acronyms
ACA : Acadian populationAD : Autosomal dominant ADNmt : Mitochondrial inheritance AFR : Africa
AME : America
ANRIL : Antisense non-coding RNA in the 9p21 locus
AR : Autosomal recessive BMI : Body mass index BP : Blood pressure
BRCA1 : Breast cancer gene 1 (or 2)
CaG : CARTaGENE CEPH : Centre d’Étude du
Polymorphisme Humain CEU : HapMap population from
Utah residents with Northern and Western European ancestry
cM : centiMorgan CSASIA : Central South Asia CVD : Cardiovascular diseases
CYP2C9 : Cytochrome P450 2C9 gene
dbSNP : National Center for
Biotechnology SNP database DNA : Deoxyribonucleic acid DNK : Do not know
EASIA : East Asia
EURO : Europe
FC : French Canadian
FEV1 : Forced expiratory volume in one second
FROH : Proportion of genome covered by runs of homozygosity FRQS : Quebec Health Research Fund Fs : Sum of LCAs’ inbreeding
coefficients
FVC : Forced vital capacity GFC : Gaspesian French Canadian
population
GWAS : Genome-wide association study
HBA1c : Glycated haemoglobin HBD : Homozygous-by-descent HDL : High-density lipoprotein hg19 : Human genome version 19 HHH :
Hyperornithinemia- hyperammonemia-homocitrullinuria
HLA : Human leukocyte antigen HMM : Hidden Markov model HSAN2 : Hereditary sensory and
autonomic neuropathy type 2 HWE : Hardy-Weinberg equilibrium IBD : Identical-by-descent
ID : Identification number IMPQ : Infrastructure intégrée des
microdonnées historiques de la population québécoise
kb : Kilobase
LCA : Lowest common ancestor LD : Linkage disequilibrium LDL : Low-density lipoprotein LOY : Loyalist population MAF : Minor allele frequency MB : Megabase
MCH : Mean corpuscular haemoglobin MCHC : Mean corpuscular
haemoglobin concentration MCMC : Markov Chain Monte Carlo MCV : Mean corpuscular volume MEDNIK : Mental retardation,
enteropathy, deafness, peripheral neuropathy, ichthyosis, and keratoderma MENA : Middle East and North Africa Mix : Admixed individuals from
different continental populations
MON : Montreal population
MRCA : Most recent common ancestor NCBI : National Center for
Biotechnology Information NGS : Next-generation sequencing NS : North Shore population
OMIM : Online Mendelian Inheritance in Man
PC : Principal component
PCA : Principal component analysis PCA-CP : Principal component analysis on coancestry (chunk count) matrix
PCAgeno : Principal component analysis on genotypic data
PCSK9 : Proprotein convertase
subtilisin/kexin type 9 (gene) PQ : Whole sample from the
Province of Quebec.
QUE : Quebec City area population RCDW : Red cell distribution width RMGA : Réseau de Médecine
Génétique Appliquée
RNA : Ribonucleic acid RNAseq : RNA sequencing ROH : Run of homozygosity SAG : Saguenay-Lac-St-Jean
population
SD : Standard deviation SNP : Single nucleotide
polymorphism
VKORC1 : Vitamin K epoxide reductase
complex subunit 1 gene WBC : White blood cells Xd : X-linked dominant
Acknowledgments
I would first like to thank Marie-Hélène Roy-Gagnon, my initial supervisor, for agreeing to take me as her PhD student. I felt from the very beginning that she trusted me fully, and introduced me to a number of interesting areas of research in genetics. Even after she left, she continued to provide advice and guidance.
On equal footing, I want to thank my advisor, Philip Awadalla, for letting me subsequently join his awesome lab. He offered me a wonderful opportunity. By his side, I have learned immensely about genetics and science as well as what makes a good scientist.
It was a great pleasure to work with the amazing members of the Awadalla lab, both past and present. Thanks to Vanessa Bruat, Jean-Christophe Grenier, Alan Hodgkinson, Armande Ang Houle, Julie Hussin, Youssef Idaghdour, Jean-Philippe Goulet, Jacklyn Quinlan, Marie-Julie Favé, Thibault de Malliard, Elias Gbeha, Mélanie Capredon, Mawussé Agbessi and Élodie Hip-Ki. Thank you for the lunches we shared, the encouragements you liberally handed out, the technical assistance you always offered and the general we had.
During my PhD years, I was also fortunate enough to meet Damian Labuda. Thanks for all the discussions and help. I also worked with people from his lab. Claudia Moreau and Jean-François Lefebvre, it was great to meet you along the way and I enjoyed working with you. I would also like to express my gratitude to Marie-Pierre Dubé, my co-supervisor, who provided encouragement, support and guidance.
I would also like to thank the Centre de recherche de Sainte-Justine. The staff is very welcoming to all students and offers valuable support. Special thanks to Sandy Lalonde, Dominika Kozubska, Alida Hounyovi and Cristina Pulciani.
My PhD would also not have been possible without the incredible BALSAC population database. Therefore I want to thank all the people who work there, especially Hélène Vézina and all those who set up this resource. Furthermore, I need to thank all participants who got
involved in the CARTaGENE Project. They are involved in a biobank which will contribute I am sure to great scientific discoveries: it has already started to. Thank you also to all the CARTaGENE team.
Moreover, I would like to express my gratitude to the administrative staff at the Public Health School: Monique Lespérance and Angélique DeChatigny. Thank you so much!
I am very thankful to all those who took time to comment my work or give insights on writing in English. Thanks also once more to the people who reviewed my papers.
I am deeply grateful to the members of my PhD jury for taking time out of their busy schedules to review this thesis.
During my doctoral studies, my research was supported by a variety of funding bodies. I want to thank the Fondation du CHU Sainte-Justine and the Fondation des Étoiles for their scholarships, as well as the Réseau de médecine génétique appliquée (RMGA) for the Louis-Dallaire fellowship. I also gratefully acknowledge the support I received from the Faculté des études supérieures et postdoctorales and from the Département de médecine sociale et préventive at Université de Montréal.
A special thanks to all the ladies who have been an inspiration to me: Marie Léger-St-Jean, Sarah Landry, Jacklyn Quinlan, Julie Hussin, Marie-Pierre Dallaire, Marie-Hélène Roy-Gagnon and super maxi-mom!
Enfin, je tiens à remercier mes amis, ma famille et belle-famille pour leurs encouragements. Merci!
Merci maman pour tout le soutien pendant mes années d’étudiante, je t’aime.
1.1.
Genetic epidemiology
1.1.1. Historical perspectives
A hundred and fifty years ago Mendel established his principles of heredity, which dictate how genetic material is passed on. A century later, innovative molecular techniques revealed much more on genes and their structure and shed light on the high amount of variation existing between each individual’s unique DNA sequence. Meanwhile the field of epidemiology, which began with the study of infectious diseases, slowly broadened its area of research to environmental factors, such as nutrition and air pollution. Eventually epidemiology developed up to a certain point where it became clear that genetic factors are important in the etiology and biology of diseases showing some degree of familial aggregation (Lilienfeld 1961). Environmental factors may also explain a part of the aggregation and need to be considered together with genetic factors.
Let’s take as an example the Framingham heart study (Dawber et al. 1951). This long-term and still on-going study takes place in the town of Framingham, Massachusetts and was set up in 1948 to investigate cardiovascular diseases (CVD). This vast project contributed to the growth of epidemiology itself and now with its third generation of participants, Framingham study scientists are expanding their research to include the role of genetic factors (Jaquish 2007).
The alliance and interaction of genetics and epidemiology resulted in a new discipline called genetic epidemiology. This discipline is commonly defined as the study of genetic factors, their interaction and joint action with environmental factors, which are all leading to different distributions of disease in human populations, with the ultimate goal of control and disease prevention (Khoury et al. 1993; Thomas 2004). Genetic epidemiology initially started with recommendations for epidemiological studies to investigate the potential influence of genetic factors in the etiology of a disease (Neel and Schull 1954). This was quickly followed by the first discoveries of genetically defined groups (e.g. blood groups (Clarke et al. 1956))
associated to specific diseases. Genetic epidemiologists then outlined a basic process to study the genetic determinants of diseases. We will review the steps involved in this traditional research process in the next two paragraphs.
The traditional research process in genetic epidemiology begins with the description of disease risks varying among populations leading to the assumption that the disease is either related to the environment or to genetics or both. By looking more closely at the disease distribution it can be assessed whether familial aggregation occurs, meaning that the disease tends to occur more within families than in unrelated individuals. If familial aggregation is found, the next step is the segregation analysis, which is an approach used to study families with affected members to identify the most likely pattern of inheritance for the disease under study.
After the identification of the transmission model, individuals of interest are genotyped for known genetic markers and used in linkage analysis to attempt to pinpoint markers, which are almost all the time inherited by individuals having the disease, i.e. markers linked to the disease, and not or rarely inherited by disease-free individuals (Dawn Teare and Barrett 2005). In the end this step narrows down the search and finds roughly the disease gene location. Here the notion of recombination rate concerning the distance between markers is important. During meiosis, loci located closer together on a chromosome are more likely to be transmitted together. The more distant two loci are, the more likely it is that recombination will occur and separate them. Therefore the recombination rate between genetic markers along a chromosome and a disease gene provides information on its location. The following step is to fine map the disease gene since areas potentially containing disease genes identified through linkage are large. For this step we can take advantage of linkage disequilibrium (LD), which is a tendency for some alleles at linked loci to be associated with each other more than expected by chance, creating haplotypes (Palmer and Cardon 2005). Haplotypes are combinations of alleles at multiple linked loci that are transmitted together as they are found on a single chromosome. Affected individuals sharing overlapping segments of haplotypes can help localize the disease gene. Ultimately, sequencing a region to identify variants present in cases and absent in controls might be necessary to uncover causal variants or at least to
done with regards to disease risk of the various mutation and possible interaction with age, sex or environmental factors.
The last two decades have seen many technological advances, which led to additional research tools and a broadening of the traditional genetic epidemiological research steps. Indeed, today’s studies are not only relying on heritability within families and are now frequently carried out in cohorts of seemingly unrelated individuals having a disease, including relatively more complex diseases (polygenic) as opposed to Mendelian or monogenic diseases. Recent technological developments have broadened the scope of research approaches from family-based to population-family-based approaches such as genome-wide association studies (GWASes), which consist of scanning the whole genome looking for any variation associated with a disease or trait.
1.1.2. Advantages and limitations of genome-wide association
studies
The sequencing of the human genome (International Human Genome Sequencing Consortium 2004), the HapMap project (The International HapMap Consortium 2005), which is a great catalogue of human haplotypes from around the world, and the advent of different databases listing genetic variants, such as the National Center for Biotechnology SNP database (dbSNP) (Sherry et al. 2001), allowed the realization of large-scale genotyping studies involving a large number of individuals.
GWAS is a popular large-scale population study approach, which has multiple advantages. Unlike candidate gene studies, a GWAS scans the whole genome with no a priori hypothesis regarding potential genes of interest and this unbiased approach offers a greater potential to make truly novel discoveries (Donnelly 2008). For example, new pathways were identified with GWASes providing further knowledge on mechanisms involved in the etiology of diseases and having direct clinical relevance (Visscher et al. 2012). GWASes rely on meiotic recombination events that have occurred in the history of a sampled population, as opposed to
meiotic events assessed in family studies by linkage analysis. As such, a region with a significant signal of association will be smaller at a genomic scale as compared to those found by linkage, which can facilitate the detection of the actual causal gene and mutation. Also, GWASes enable the discovery of genes with small effect sizes on disease risk, which are more difficult to track in linkage studies and are by definition more likely to contribute to common disorders than to familial ones. Indeed according to the now famous hypothesis that led to the popularity of GWASes, the “common disease, common variation” hypothesis, common allelic variation would account for a significant proportion of genetic variance in common disease susceptibility (Lander 1996; Schork et al. 2009).
The success of GWASes depends on the power to detect those associations between genetic variants and traits. Many factors influence this power, including the frequency of the risk genotype, the increase in disease risk associated with this risk genotype (relative-risk), the strength of the relation between the marker tested and the actual disease genotype, the sample size, the disease prevalence, the genetic heterogeneity of the sampled population, the accuracy of the genotyping technology used and the accuracy of the phenotype definition (or in the case of a quantitative trait its appropriate measurement) (Hattersley and McCarthy 2005; McCarthy
et al. 2008). Very large sample sizes can be required to reach a reasonable power. This has
favoured the formation of international collaborative consortia to aid recruitment of participants (Hattersley and McCarthy 2005).
In addition to the importance of having sufficient power, we have to consider a few limitations of GWASes. The most important one is probably that GWASes, as well as other genetic association studies, detect associations, which are not necessarily causal relationships (Cordell and Clayton 2005). As mentioned above, the large study sample size required can also be a limitation, especially if recruiting participants with a well-measured or homogeneous phenotype is difficult. Similarly the need for replication of results in independent samples in different populations, to increase evidence that the association is not an artefact due to uncontrolled variables, is also a major limitation. GWASes are interesting since they can detect associations with genetic variants having small effect but as a trade-off it typically
trait. Additionally, despite their large size, GWASes are typically less powered for rare variants (frequency < 5 %). Finally, GWASes identify location rather than gene and sometimes the variants found associated with a trait are far from coding regions or found in genes not thought to be related to the trait. However, this last drawback can also be worthy since new genetic variation and biological mechanisms can be disclosed.
In general GWASes will use genetic information from single nucleotide polymorphisms (SNP) arrays. This technology involves arrays of SNPs, which assay the most frequent form of variations in the genome. SNPs may or may not have functional consequences. Initially, arrays could type a few thousand SNPs and now, more recent ones type over 2 million variants (see (LaFramboise 2009) for more details). Generating such a large amount of information for every individual in large cohorts yields large amount of data to manage, which comes with some potential difficulties. Properly storing, managing and processing all this information have become increasingly challenging thereby parallel technological advances have addressed these challenges with the development of infrastructure and analysis pipelines.
1.1.3. Past successes and future directions
Genetic association studies led to an overwhelming number of discoveries. For example, within the framework of GWASes, over 15 000 SNPs were found associated to a disease (Welter et al. 2014). In the next section we review some of the most noteworthy discoveries.
For CVD the most famous genetic discovery is still the association of chromosome 9p21 to coronary artery disease and myocardial infarction (Samani and Schunkert 2008). Multiple studies reported at the same time an association for the same locus on chromosome 9 and in addition to being replicated in different ethnic groups, the effect of the locus was unaffected by traditional cardiovascular risk factors. The particular interest in this locus also comes from the fact that it is mostly deprived of coding genes and located in a region, which is well known in cancer genetics (Cunnington et al. 2010). The closest protein coding genes are about 100 kilobases (kb) away from the most strongly associated SNP and it was found that in fact the region of association is overlapped by a non-protein-coding RNA gene, called ANRIL
(Pasmant et al. 2007). Disease associated variants of the 9p21 region are highly correlated with ANRIL expression and this may suggest a modulation role in disease susceptibility (Cunnington et al. 2010). However it still remains unclear how 9p21 influences cardiovascular risks (Patel et al. 2014; Hannou et al. 2015).
Also related to CVD, the PCSK9 gene has an important physiological role in cholesterol metabolism (Lambert et al. 2012). Different mutations on the gene were found to be associated with low-density lipoprotein (LDL) cholesterol levels. Both loss-of-function or gain-of-function mutations modify the availability of LDL receptor, which degrades LDL in a cyclic process and have a great impact on the levels of LDL cholesterol (Abifadel et al. 2003; Cohen et al. 2005, 2006). Since CVD are the leading cause of death in the world (World Health Organization 2015) and since PCSK9 is recognized as a major factor influencing cardiovascular health, there is a growing amount of studies dedicated to potentials therapies targeting PCSK9 (Awan et al. 2014; Dadu and Ballantyne 2014; Weinreich and Frishman 2014).
Genetic epidemiology also contributed considerably to advances in cancer research. Identification of breast cancer genes, through linkage analysis of families with cases of early-onset breast cancer (Hall et al. 1990) and confirmation that mutations on those genes were implicated in development of breast and ovarian cancer (Miki et al. 1994), opened the door to extensive efforts to characterize the genetic component of this cancer.
Along with the decreasing price of genotyping, the size of GWASes has correspondingly increased and the trend went on to creating larger and larger consortia. To facilitate research work, in the 2000s, a number of population-based biobanks were implemented and some established epidemiological studies redefined their mandates to include genetic aspects of diseases (Swede et al. 2007). Biobanks with vast sources of phenotypic information in addition to lifestyle, environment and other exposures assessment are great resources to perform research and to eventually translate genetic discoveries into clinical practice. They are also beneficial to epidemiological research in general, as data collection is often prospective
most important population-based projects for now include UK Biobank with over 500 000 individuals recruited (Allen et al. 2012), Iceland’s deCODE program with more than half of the 300 000 inhabitants population recruited (deCODE Genetics Inc. 2015), China Kadoorie Biobank with over half a million participants (Chen et al. 2011) and CARTaGENE project in the Quebec province with 40 000 participants (Awadalla et al. 2013; CARTaGENE 2015). Further details on CARTaGENE are presented in the section 1.3.4. (p.31).
Research approaches were also modified with the advent of next generation sequencing (NGS), which is producing tons of sequencing reads concurrently since the sequencing process was improved to be parallelized. Sequencing reads provide information on various types of genetic variation and SNPs called from them are largely free of ascertainment bias, thus providing a better picture of rare variations. Structural genetic variation such as copy-number variation is one type of variation drawing important research attention as it is purported to modulate gene expression and disease phenotype (Weischenfeldt et al. 2013).
1.2.
Founder populations
1.2.1. Their advantages
Founder populations are populations that descend from a small number of founders, who left one area to settle in another and were isolated for some reasons, which can be linguistic, political, religious, social or geographic (Diamond and Rotter 1987). There has long been interest in these populations for genetic studies (MCKUSICK et al. 1964; Nevanlinna 1972; Skre 1975; Morgan et al. 1980) since they have numerous advantages compared to fully outbred populations with substantial admixture.
First, since the number of founders is limited when a new population is created, the amount of genetic variation carried is also limited and represents only a fraction of the genetic variation present in the entire population where the founders originated (see Figure 1.1). The founder effect and the population bottleneck are terms frequently used interchangeably however they
Figure 1.1 Founder effect
A non-random sample of the original population composed of multiple genetic members is isolated from the rest, thus a new gene pool with reduced genetic variation as compared to the original population is created.
are two slightly different concepts. The population bottleneck is a quick and sharp reduction in the size of a population due to a drastic event, which can also lead to a loss of genetic variation, while the founder effect concept puts emphasis on the loss of genetic variation caused by the creation of a distinct population. Founders will contribute only with their own genetic makeup to their offspring and so on for the next generations. Few new variants will appear, but the low mutation rate in humans (Conrad et al. 2011), and the isolation, or limited migration, will tend to reduce genetic variability. In some cases, this means that for a single disease or phenotype that may be caused by multiple different alleles, only some of these will be found in the founders (Shifman and Darvasi 2001; McClellan and King 2010). For example in the case of breast and ovarian cancer, over 2 000 variants in the genes BRCA1 and BRCA2 have been identified worldwide but only about 20 variants segregate among French Canadians (FC) and 3 mutations account for most of the FC breast cancers (Cavallone et al. 2010; Petrucelli et al. 2013). The potential reduced genetic heterogeneity also translates into a higher power to detect genetic variants. In other words it is easier to detect variants linked to a disease if instead of having dozens of those variants in a population you have only a few variants. This is true for simple Mendelian diseases but we can assume founder populations also have smaller sets of risk alleles involved in common diseases (Wright et al. 1999).
Another advantage of isolated founder populations stems from the fact that they often have experienced a rapid expansion, driving rare alleles to higher frequencies. Genetic drift, which is the change in the allelic frequency in a population due to random sampling at each generation, will act predominantly when the population is small (Masel 2011). Rare variants will not be the only variants influenced. Highly frequent variants can also become fixed, meaning every genome will have the same version of it, and some variants may also be lost. Of course, the increased frequency of some rare variants explains the increased prevalence of a number of recessive disorders in isolated founder populations, in which case, their discovery is facilitated (Puffenberger 2003). Note that recessive inheritance means that the mutated gene has to be transmitted by both the mother and the father in order for the child to have two copies of the mutation and to be affected by the disease. Recruitment of cases can also be facilitated when the disease prevalence is higher. Discovery of genetic factors is even more facilitated if the population also tends to have large kindreds, such as the Amish population,
which will also increase the odds of recruiting individuals with the exact same disorder (MCKUSICK et al. 1964).
Another advantage of founder populations is the relative homogeneous environment. Differences in diet, life habits, infectious agents, and sanitary conditions can be minimized for some isolated populations, therefore reducing environmental noise in a research framework. Since some isolated population also tend to be more geographically stable, i.e. not prone to move outside the community, this can also facilitate longitudinal and offspring studies.
Small population size also tends to translate into more inbreeding, which happens when related individuals are mating. More inbreeding means that recessive genes will be more likely to occur in a homozygous pattern, resulting in more recessive diseases and an opportunity to map these genes more efficiently. Also inbreeding translates into fewer generations separating randomly selected individuals (average time to the most recent common ancestor is smaller) and thus there are less recombination events between them (Shifman and Darvasi 2001). The lower recombination leads to greater correlation between segregating variants, i.e. the genetic units that are polymorphic within the population. Typically this means that more distant variants will tend to be inherited more often together, increasing the linkage disequilibrium (LD) between those variants (Shifman and Darvasi 2001). Patterns of LD depend on where recombination occurs and how genetic material is transmitted. Increased LD is advantageous to map disease variants. Indeed, when a region is well characterized, i.e. how its variants are linked to each other, and has a disease variant in high LD with other variants, these variants can be targeted instead of the disease variant itself (de la Chapelle and Wright 1998). In essence, this corresponds to a compromise between the extremely large segregating segments typical of linkage studies, and the very small shared segments typical of population-based GWASes.
Beyond LD blocks, the increased degree of relatedness found among individuals within isolated populations leads to the development and identification of large chromosomal segments. Patients afflicted by a disease in an isolated population will tend to share common
detect such genes. Haplotype mapping can also give clues on the founder origin and on the time a mutation was introduced (Kibar et al. 2000; Yotova et al. 2005; Vézina et al. 2005a). When those haplotypes are inherited from a common ancestor (and consequently the same), they are called identical-by-descent (IBD) segments. Haplotypes and IBD segments are closely related concepts (see section 1.4.2 on p.35 for more details). Similarly runs of homozygosity (ROH) refer to regions of the genome where both chromosomal segments, inherited from the mother and the father, are identical. This may happen in situations where parents are more closely related. Homozygosity can also be used to map disease markers, especially in the case of recessive disorder (Lander and Botstein 1987; Bernard et al. 2010). The more inbred or closed a population, the higher the frequency of those long homozygous stretches, which will also contribute to facilitate genetic research in isolated populations.
Genetic epidemiological research can be more challenging when a lot of the data is missing or when the density of the genotypes is too sparse. Again, the genetic features of isolated populations (increased genetic homogeneity, increased LD and more shared tracts) can help with the imputation of genotypes and hence minimize the missing data problem (Marchini et
al. 2007). Genetic imputation is a technique allowing one to infer unobserved genotypes (Li et al. 2009). Statistical imputation is also useful when merging data coming from different
genotyping platforms that did not target the same variants.
One last major advantage of founder or isolated populations that deserves mention is that good genealogical record keeping is often available. There is substantial value to having reliable demographic history along with well curated extended genealogical data for the conduct of genetic research. The best known examples are Mormons with the Utah Population Database (Skolnick 1980), Icelanders with the Icelandic Genealogy Database (Tulinius 2011) and French Canadians with the BALSAC population database (Bouchard et al. 1989; BALSAC 2014a). These rich data, which are complementary to genetic information, represent an outstanding opportunity for research in several fields (Laberge 1969; Laberge et al. 2005a; Moreau et al. 2011). Information from genealogies can, for example, provide input on origin of genetic material, help to interpret modern population structure and to estimate time of gene flow events (Larmuseau et al. 2013a).
1.2.2. Challenges
There are numerous benefits that stem from the study of isolated population, and this has led to such populations attracting substantial interest from the genetic community (Peltonen et al. 2000). In the last decade, there has been renewed interest for isolated populations in part for rare variants studies recently possible through sequencing and also because of increasing computing resources allowing to build and to analyze large datasets, including large genealogical datasets (Holm et al. 2011). However, studying isolated founder populations is not challenge-free. First, reaching these populations is not always easy. In some instances, educational and linguistic barriers are present, or distrust of science can be encountered (MCKUSICK et al. 1964). In the specific case of Amish, the concern raised by the frequency of different rare disease led a doctor, Holmes Morton, to found in 1989 a non profit clinic devoted to the care, treatment and investigation of the genetic disorders afflicting the community of Lancaster County (Rosenblatt 2013). This kind of involvement in the community contributed to improving the education of Amish people about their specificity and raised their awareness on various health issues.
Also, not all populations have genealogical records of suitable quality and size amenable to research purposes. Input errors, when the information is digitized, may arise but quality controls and good management practices are usually set up especially when funded organizations oversee these operations (Bouchard et al. 1989; Cannon Albright 2008). However if the primary information is incorrect, errors cannot be avoided. For example, non-paternity or non-maternity events are one possible scenario, which can lead to mistakes. Assuming that non-maternity events are probably much less frequent than non-paternity events frequency estimation focused mainly on the last ones. Estimates of non-paternity events typically vary around 1-2% (Weir et al. 2006; Strassmann et al. 2012; Larmuseau et al. 2013b).
People from founder populations tend to be related to each other in many different ways, sometimes through inbreeding loops, which may complicate traditional segregation and
Depending on genetic information availability, tracking of IBD segments can be an option to link individuals among relatives. IBD segments are a straightforward way to focus on the actual realized genetic sharing, as opposed to sharing expected from genealogical links, between individuals known to be related. Relatedness among sampled individuals can also induce bias in conventional association studies assuming independence and specialized tests are needed to account for known and unknown relationships between individuals (Yu et al. 2006; Sillanpää 2011).
As mentioned in the previous section, genetic drift is more likely to influence the distribution of allele frequencies in smaller populations, resulting in genetic variations specific to some populations and an increasing populations differentiation (Casals et al. 2013). An increase in the frequency of certain genetic variants may facilitate the detection of their association with a disease, but the scope of discovery and the genetic effect size may be reduced. In addition, the identification of disease variants specific to an isolated population may not be directly generalizable to other populations.
Another issue raised by the study of isolated populations relates to the selection of variants typically used on genotyping SNP arrays. Common genotyping platforms include SNPs that were discovered using sequencing technologies in different samples. These discovery panels are thus issued from genetic variations found in different populations of different sizes and the selected SNPs included in the platforms are not selected at random and may not necessarily be geographically representative (Wakeley et al. 2001; Clark et al. 2005). As a result, genotyping chips are typically biased towards common variants. This phenomenon is called ascertainment bias and can distort, among others, measures of population differentiation (Albrechtsen et al. 2010b). This means that, to some extent, common genotyping platforms may not be the best suited platforms to quantify and describe the genetic diversity in all populations. However alternative techniques such as sequencing can overcome this problem or correction techniques can be applied to infer measures of population differentiation (Albrechtsen et al. 2010b).
Finally ethical and social concerns need to be considered when working with isolated populations. How and what information is disclosed in publications is important for example
to avoid risks of collective stigmatisation, which can create damages that could eventually impair future participation to research studies (Bouchard 2004; Lavery et al. 2007). However, as stated earlier, educating participants about the potential risks, usefulness and benefits of their involvement as well as educating researchers about good communication practices offers a simple way to address this issue (Mascalzoni et al. 2010). There are also confidentiality and privacy issues that could be more difficult to manage in particular when genealogy data is linked to health records (Lavery et al. 2007; Mascalzoni et al. 2010). Note that most of these concerns and solutions also apply to non-isolated populations.
1.2.3. Examples
Some founder populations are better known than others as they have been more extensively studied. Table 1.1 (p.16) presents a wide number of founder, isolated and genetically differentiated populations. Comparing these populations help to understand differences among founder populations regarding 1) the genetic consequences of a bottleneck, 2) the demographic history, and 3) the cultural and environment features (Peltonen et al. 2000). Each population listed has a unique genetic background and contributed to our understanding of recessives diseases.
Note that other populations, with suspected founder effect or isolation, were not included in this list, either because documentation is lacking or the population did experience a considerable degree of admixture over time (the Cuban population for example (Cruz 2013)). As such, the table is not intended to present an exhaustive list (for more examples see also (Arcos-Burgos and Muenke 2002; Rudan 2006; Venken and Del-Favero 2007; Kristiansson et
Table 1.1 Population isolates Population name, location History Time of settlement Isolation Initial number of founders Today's population size References Afrikaners, South Africa
Immigrants of Dutch origin settled in the
Cape and later have spread inland. 1652
Religious and linguistic ~ 1 000 ~3 000 000 (Diamond and Rotter 1987; Jenkins 1990) Amish, North-East USA
Anabaptists from Switzerland settled initially in 3 counties, no admixture,
closed population, high fertility rate. 1714-1727 Religious ~ 200 ~290 000
(MCKUSICK et
al. 1964)
Ashkenazi Jewish, Various locations
Jews moved from Alps to Rhineland ~9th century, moved to Eastern Europe ~12th century and then to Americas and Israel during 19-20th centuries. Had variable endogamy throughout history.
Not applicable Religious and linguistic Unknown ~10 000 000 (Ostrer 2001)
Finnish, Finland
Two early migration waves. Long term isolation. In the 16th century, migration from south and west coastal areas to north and eastern part of the country started creating sub-isolates. End of 17th century, famine and epidemics occurred followed by a rapid population size expansion.
~ 4 000 years
ago geographical Mostly small number Probably ~5 000 000
(Peltonen et al. 1999; Kere
2001)
French Canadians, Quebec, Canada
French immigration until 1759, migration within the Quebec province creating several founder events and rapid expansion of the population
1608 Religious and linguistic ~ 8 500 ~6 400 000 See section 1.3.1, p.18
Hutterites, Northern USA and
Western Canada
Founders settled in 3 endogamous
colonies, which have maintained separate identities and have high fertility rate
1875 Distinct geographic clusters, religious barriers ~ 440 ~30 000 (Hostetler 1985; Abney et al. 2002)
Population name, location History Time of settlement Isolation Initial number of founders Today's population size References Icelanders,
Iceland Few immigration, multiple bottlenecks ~ 900 Insularity
A few thousand Norwegian Vikings ~320 000 (Gulcher and Stefansson 1998; Tulinius 2011) Mennonite North-East USA
Anabaptists from Switzerland settled in USA and population size increased over 150 years. From the end of the 18th century, multiple religious schisms led to splits of the population and
bottlenecks. 1707-1757 Religious 3 000 – 5 000 immigrated to America ~390 000 (Puffenberger 2003) Mormons, Utah, USA
Immigrants having mostly a British or Scandinavian ancestry settled in Salt Lake City and colonized the area. They have very high fertility rate.
~ 1847 Religious ~30 000 ~1 750 000 (Jorde 1982; Slattery and Kerber 1993) Newfoundlander Newfoundland, Canada
English Protestant and Roman Catholic Irish settlers, few new immigrants leading to homogeneous sub-populations. ~ 1610 Insularity, coastal outports ~ 20 000 (in 1760) ~525 000 (Rahman et al. 2003) Sardinians, Sardinia, Italy
Low population density until 1700, many sub-populations (microgeographic heterogeneity) ~ 10 000 years ago Insularity, geographical position, mountainous area
unknown ~1 600 000 (Calò et al. 2008)
Note: Some populations labelled under the same religious name are separate groups that do not necessarily share common ancestry (like Dutch-German and Swiss-German Mennonite (Orton et al. 2008)).
1.3.
French Canadian founder population
1.3.1. A brief history of the peopling of Quebec
The study of the Quebec population is interesting because of its history, thus this section summarizes how La Belle Province was colonized. However, note that this is only a brief summary with a particular focus on elements and regions that are key to understand the history of FC participants in the Quebec Reference Panel and CARTaGENE, the two cohorts used in the context of this thesis.
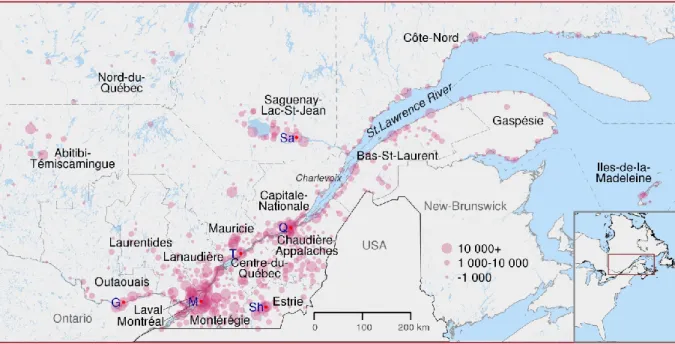
The first French settlers founded Quebec City in 1608. Peopling was slow at the beginning essentially driven by the needs of fur trade (Charbonneau et al. 2000). Two other permanent settlements, Trois-Rivières and Montreal, were established respectively in 1634 and 1642 (see Figure 1.2, p.19). French immigration was coming from different parts of France but mainly the northwest departments and Paris region (Vézina et al. 2005b). This immigration has led about 8 000 settlers to leave descendants in the colony (Charbonneau et al. 2000). In fact, during the following period population increased mainly through reproduction. Specifically in the 18th century, the growth rate was so high that the population was doubling about every 30 years (Charbonneau et al. 2000). This growth rate was not even affected by the British Conquest in 1759 (Charbonneau et al. 2000). At that time the population was spread along both sides of the St. Lawrence River and comprised over 70 000 inhabitants (Charbonneau et
al. 2000).
East of Quebec City, the peopling of the Charlevoix region started in 1675 and took place in coastal lowlands (Jetté et al. 1991). The region was relatively isolated due to surrounding mountains. The vast majority of the Charlevoix founders transited through another region of the colony before settling there and more than half of them were relatives (Jetté et al. 1991). At the beginning of the 19th century, the small region underwent some demographic pressure, migration to estuary heights began, towards inland, and overall there was an emigration flow
Figure 1.2 Map of the regions of Québec
Inhabited cities and villages are represented by pink dots sized according to the number of inhabitants in 2015. Dashed lines show present regions' boundaries. Red dots indicates some important cities : G Gatineau; M Montreal; Q Quebec City; Sa Saguenay; Sh Sherbooke; T Trois-Rivières.
out of the region leading to the settlement of Saguenay-Lac-St-Jean (referred as Saguenay in the following text) which started in 1838. Moreover, immigration to Saguenay was often carried out by members of the same families (Gauvreau et al. 1991). The rooting of these families in the region, their high fertility and their common origin contributed to shape the Saguenay population (Bouchard et al. 1988). After 1875, immigration to Saguenay was very low but the population size increased from about 5 000 in 1850, to 50 000 around 1900 and 250 000 in 1960 (Bouchard et al. 1988). The population size increase was due to natural growth; the birth rate was over 50 births per 1 000 people until 1930.
The North-Coast (Côte-Nord) region further north and east to Saguenay was under the same monopoly of the Hudson Bay Company for fur trade, as the Saguenay region, before a permanent coastline settlement began. Around 1830 we count some fur trading and fishing posts and less than a hundred persons living in the North-Coast all year long (Frenette 1996). Ending the monopoly led to an inflow of settlers interested in resource exploitation. People coming from Iles-de-la-Madeleine and Gaspesia settled in Minganie, the region including and facing Anticosti Island. Other parts of the region were populated with the establishment of sawmills and flour mills, the agricultural expansion, the development of the fisheries and mining (Frenette 1996). Incomers were from different parts of Quebec. The settlement of this large region was rather slow, in 1871 there is about 4 200 inhabitants excluding First Nations people. During the next 70 years, the population size had been multiplied by more than five (Frenette 1996).
All the way east, south of the St. Lawrence River, the Gaspé Peninsula has been frequented since the 16th century by seasonal fisherman mainly from Brittany, Normandy and the Basque country (Desjardins et al. 1999). French pioneers tried to establish the first permanent settlements in the mid-seventeenth century however, the efforts were hampered by many obstacles, such as underfunding, climate and war. It is only slightly before the British Conquest that settlers landed in permanently. After the Conquest, Gaspesia became a coveted territory. Fisheries as well as timber trade and shipbuilding industry finally developed. In addition to French, Gaspesia greeted Acadians, which were escaping deportation by the British (Bergeron et al. 2008). Acadians were also of French-descent but they did settle in 1604 in
another colony called Acadia (present-day Nova-Scotia, New-Brunswick and Prince-Edward-Island). A third important group, called Loyalists, also moved in Gaspesia. They were Anglo-American that wanted to remain loyal to the British Crown after the independence of the thirteen American colonies (Desjardins et al. 1999). These three groups tended to marry among themselves, which perpetuated until now their differences in terms of identity and genetic background (Vézina et al. 2014). Note also that Acadians populated other regions of Quebec and their integration with the local population varied. Gaspesia’s population size went from about 3 000 in 1800 up to 50 000 a century later and peaked to 105 000 in 1961 before some decline (Desjardins et al. 1999).
Trois-Rivières was founded in 1634, west of Quebec City. About 30 years later, the settlement
extended in the area partly due to the fur trade and in great proximity with the local First Nations (Hardy and Séguin 2008). The growth of the population of Mauricie was slow, counting about 4 000 inhabitants in 1760 (Hardy and Séguin 2008). Iron industry, farming and fur trading had been the initial drivers of development for the region and the commercial exploitation of forests started at the beginning of the 19th century. The strongest population growth in the region took place during the first half of the 20th century (Hardy and Séguin 2008).
Valued for its position as a gateway to the continent, the Montreal region eventually overshadowed the development of Trois-Rivières. Nonetheless, the beginnings of Montreal were slow and difficult; Iroquois, an important First Nations group, saw the settlers’ arrival in 1642 as a threat. With its hospital, its fort and a population of over 500 settlers in 1660, Montreal was finally gaining importance (Linteau 2007). Early in Montreal’s history, religious institutions occupied a large role, due among other things to the initial idea of a missionary settlement. In 1665, a French military intervention brought peace to the people of Montreal and opened the way for the expansion of fur trade. Montreal became the core of a commercial and political empire. The population grew less rapidly than in the St. Lawrence valley but was still over 4 000 in 1754 (Linteau 2007). After the British Conquest, English, Americans and Scottish immigrants took commercial control of the territory. In the 19th century, immigration
around Montreal was developing. The second half of the 19th century was dominated by the industrialization of the city. In 1852 there were almost 60 000 inhabitants (Fougères 2012). British immigration eventually slowed, rural exodus began and the city expanded. Around 1866, French Canadians were again the majority of the population and by the end of the 19th century they did make up 60% of the population (>325 000 in 1925) (Fougères 2012). Montreal was home to two distinct populations (one of French-descent and the other of British-descent), each having their own institutions, their own schools, churches, etc. In the 20th century, immigration from all over the world contributed to population growth in Montreal and by the end of the century, the city grew to about 3 million inhabitants, including suburban areas.
West of Montreal, the St. Lawrence River continues south towards the Great Lakes. Another river, the Ottawa River also called the travelers’ route, is located slightly up north and flows westward towards inland. Before 1800 Outaouais was a place of passage for the fur trade and was barely inhabited. After the Conquest, settlement started and the management of land dedicated to agriculture was established under the British system of townships (Blanchette 2009). Lands were used to attract Loyalists, English, Scottish and other immigrants. In 1800, the city of Hull (now part of Gatineau) was founded by an American, who came with his family. The region benefited from the rise of the lumber industry and the construction of the Rideau Canal, which started in 1820 on the other shore of the river in the future Canadian capital. In 1827 over 2 500 persons populated the region (Blanchette 2009). French Canadians were living alongside several other ethnic groups. Irish Catholics, among others, ensured that, with French Canadians, Catholicism became the main religion after 1840. In 1861 there were over 40 000 inhabitants and this number doubled 30 years later (Blanchette 2009). The late 19th century was characterized by the development of pulp and paper industry and by the time of the World War II, Outaouais was one of the most industrialized regions of the province (Blanchette 2009).
Throughout the 20th century, as in many industrialized countries, the rural exodus towards cities changed the demographic landscape of Quebec. In 1901, 40% of people were living in urban areas and it went up to 80% in 2001 (Piché and Le Bourdais 2003). Since 1965, the
population growth has decelerated mainly due to the drop of birth rate (Charbonneau 1973). The 20th century also saw the rise in immigration, which is increasingly diversified (Piché and Le Bourdais 2003).
Today the population of the Quebec province is mostly French speaking (overall close to 80%), except for some urban centers and the North populated by First Nations. Despite the British arrival with the Conquest in 1759, different factors prevented French Canadians to mingle with incomers. Language and religion were the most obvious factors of isolation. The Catholic composition of the French Canadian population favoured the Catholic Irish establishment over the Protestant branch (Grace 2003). Because they share the same religion Irish and French Canadians did mingle, resulting in the fact that about 20% of today’s French Canadian population has an Irish ancestor (Tremblay et al. 2008). However, the Irish contribution to the French Canadian genetic make-up remains very small, about less than 1% (Tremblay et al. 2008). In the same way, the genetic contribution from other immigrant groups remained weak (Vézina et al. 2005b; Bherer et al. 2011). A study based on genealogical information reports that about 89% of Quebec’s gene pool comes from French founders and almost 81% is derived from the French founders who arrived in the 17th century (Vézina et al. 2005b). French Canadians contributed to the growth of another population; between 600 000 and 800 000 French Canadians left Quebec for USA in 1840-1930 (Charbonneau 1973).
Note that we described the settlement of French people in Nouvelle France paying little attention to Aboriginal peoples who had already established themselves about 8 000 years ago in many regions (Frenette 1996; Desjardins et al. 1999). Although their influence has also shaped French Canadian history their genetic contribution to the population remained very small according to the latest studies (around 1%) (Vézina et al. 2012; Moreau et al. 2013).
The demographic history of Quebec during its early days is well known, thanks to the strong Catholic presence during colonization. The clergy and local authorities collected information about baptisms, marriages, burials in the Catholic population and also for converted individuals, e.g. some First Nations people (Charbonneau et al. 2000). In some cases, registers
information was very well kept and well preserved and the wealth of nominal sources, such as notarized certificates and censuses, allowed to fill in the gaps and to confirm some information (Légaré 1988). Thereby a first population database combining many of those sources of information was set up by the Research Program in Historical Demography from Université de
Montréal to cover all the population born in the St. Lawrence Valley under the French Regime
(Légaré 1988; PRDH-IGD 2015). The Early Quebec Population Register includes over 2 400 000 records of vital events (birth, marriages and death certificates) (Desjardins 1998; PRDH-IGD 2015). Another population database, called BALSAC, started a few years later, in the 70s, with the computerization of records for the Saguenay region (Bouchard and De Braekeleer 1991). Researchers worked to pair 660 000 baptism, marriage and burial records for the whole period after 1842, a work that was later extended to cover the entire population of the province of Quebec with marriage certificates (Bouchard and De Braekeleer 1991). Today the BALSAC population database includes a total of 3 million records, including all catholic marriage certificates from 1621 until 1965, related to nearly 5 million people and genealogical reconstruction is still ongoing (BALSAC 2014b). A new project is also on the way as both population databases are working on the integration and matching of the data under the aegis of the integrated infrastructure of historical microdata on the Quebecers population (IMPQ).
Such extended genealogies for a relatively geographically stable and semi-closed population are pretty rare and developing the analytical and computational tool to take advantage of this valuable information is essential. One use of these genealogical data, which has probably attracted the most attention, is the study of the distribution of rare disorders in Quebec. Understanding the demographic history of Quebec is essential to explain the distribution of diseases and the presence of population heterogeneity.