HAL Id: hal-00394378
https://hal.archives-ouvertes.fr/hal-00394378
Submitted on 17 Jul 2009
HAL is a multi-disciplinary open access archive for the deposit and dissemination of sci-entific research documents, whether they are pub-lished or not. The documents may come from teaching and research institutions in France or abroad, or from public or private research centers.
L’archive ouverte pluridisciplinaire HAL, est destinée au dépôt et à la diffusion de documents scientifiques de niveau recherche, publiés ou non, émanant des établissements d’enseignement et de recherche français ou étrangers, des laboratoires publics ou privés.
Study of Observer Variability in Modern Display
Colorimetry: Comparison of CIE 2006 Model and 10°
Standard Observer
Abhijit Sarkar, Laurent Blondé, Patrick Le Callet, Florent Autrusseau, Jürgen
Stauder, Patrick Morvan
To cite this version:
Abhijit Sarkar, Laurent Blondé, Patrick Le Callet, Florent Autrusseau, Jürgen Stauder, et al.. Study of Observer Variability in Modern Display Colorimetry: Comparison of CIE 2006 Model and 10° Standard Observer. 11th Congress of the International Colour Association (AIC), Oct 2009, Australia. 4 p. �hal-00394378�
STUDY OF OBSERVER VARIABILITY IN MODERN DISPLAY
COLORIMETRY: COMPARISON OF CIE 2006 MODEL AND 10°
STANDARD OBSERVER
Abhijit Sarkar
1,2, Laurent Blondé
1, Patrick Le Callet
2, Florent Autrusseau
2, Jürgen Stauder
1,
Patrick Morvan
11
Thomson Corporate Research, Rennes, France
2
IRCCyN-IVC, Polytech’ Nantes, University of Nantes, Nantes, France
ABSTRACT
This paper compares CIE 2006 model predictions and the 1964 10° standard colorimetric observer with the average observer data from three distinct subgroups of 47 Stiles-Burch observers formed on the basis of observer ages. For two of these subgroups, the long-wave sensitive (x-) color matching functions obtained from the CIE 2006 model did not accurately predict the intra-group average observer functions. In terms of display color perception, the prediction error is reflected in the longer wavelengths of the color spectrum. In contrast, the short-wave sensitive (z-) function of the 10° standard observer showed significant deviations from the intra-group average observer for all three subgroups.
Keywords: Color Vision, Cone Fundamental, Color Matching, Observer variability, Display Colorimetry
CONTACT
abhijit.sarkar@thomson.net
1. INTRODUCTION
In 2006, CIE’s (Commission Internationale de l’Eclairage) technical committee TC 1-36 published a report1 (described hereafter as CIE06) on the choice of a set of Color Matching Functions (CMF) and estimates of cone fundamentals for the normal observer for any field size between 1° and 10° and for an age between 20 and 80. The CIE06 model is largely based on the 1959 Stiles-Burch (S&B) 10° CMFs2.
A theoretical analysis of various aspects of CIE06 cone fundamentals from the perspective of display colorimetry was performed. In the first part of the analysis3, we showed that the peak-wavelength shift in the long wave- sensitive photopigment absorption spectra, excluded from CIE 2006 model but present in normal observers, is a significant contributor to observer variability in modern display colorimetry. This paper presents the second part of the analysis, addressing two key questions: i) Does CIE06 age parameter correspond to the real ages of 47 S&B observers?, and ii) If we consider a specific age group, which set of CMFs best represents the intra-group average of S&B observer data, those derived from CIE06 or the 1964 10° standard observer?
2. CIE06 AGE PARAMETER AND REAL OBSERVER AGES
We explored the possibility that predicted CIE06 functions that best match the real observer data may not always be obtained using real observer ages. This could possibly happen because of random observer variability, and/or because of the exclusion of one or more age-independent physiological
Fig 1: Age correspondence between CIE06 and 47 Stiles-Burch observers, actual observer age vs. CIE06 predicted age
factors in the CIE06 model3. We determined the CIE06 ages that resulted in the best predictions of individual S&B observer data. In this computation, we converted all S&B observer CMFs into corresponding cone fundamentals, using a 3x3 transformation matrix computed from the available average S&B observer CMFs and average S&B observer cone fundamentals1.
Two different methods were used, in which CIE06 age parameter values were computed separately for each observer’s three cone fundamentals. In the first method, correlation coefficients between the normalized cone
fundamentals for each S&B observer and those corresponding to all possible CIE06 age parameter values between 20 and 80 (a total of 61) were computed. For each S&B observer, the corresponding CIE age was the one yielding the highest correlation coefficient for a given cone fundamental. This process was repeated for all three cone fundamentals and for all 47 S&B observers.
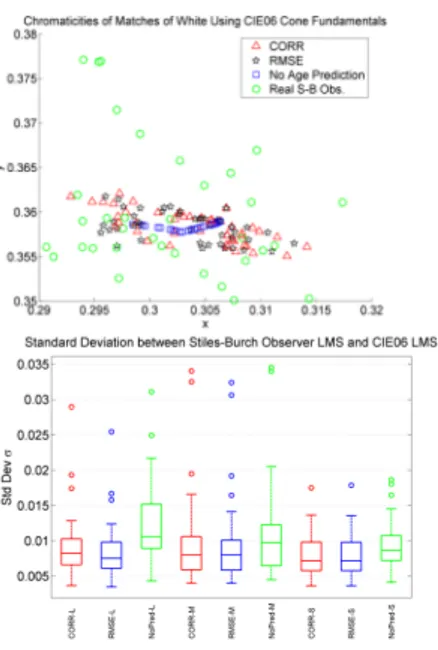
In the second method, the corresponding CIE06 age for each S&B observer was determined by minimizing the RMS errors between various CIE06 functions and real observer data. In fig 1, the actual ages of 47 S&B observers have been plotted against the CIE06 predicted ages obtained using the correlation coefficient (CORR) method. The second method (RMSE) produced very similar results. No direct correspondence exists between the real and predicted ages that can be explained through a mathematical function. However, with the correlation coefficient method, CIE06 predicted ages for 38 observers were within ±5 years of real observer age for at least one of the three CIE06 cone fundamentals. With the RMSE method, this was true for 34 observers. Fig 2 shows chromaticities of matches of equal-energy white computed with CMFs derived from CIE06 cone fundamentals for each S&B observer. CIE06 cone fundamentals were obtained by using corresponding ages from both methods (CORR and RMSE) as well as by using actual observer ages. Matches obtained with real observer cone fundamentals are also plotted. While CIE06 with age correspondence (with either method) yields greater observer variability than CIE06 with actual observer ages, it fails to explain all the variability in the real observer data, particularly in the y- direction. The standard deviation plot of the CIE06 cone fundamentals (averaged over all observers)
with respect to the real observer data are also shown in fig 2. Mean (central mark), as well as the 25th and 75th percentiles (dotted bars) of standard deviations are higher when age correspondence is ignored. The error is higher for L- than for M- or S-. In the rest of the analysis, we use the correlation coefficient method for age correspondence.
3. STILES-BURCH OBSERVER GROUPS
Out of 47 S&B observers, three age-groups were identified. Six observers with ages between 22 and 23 formed Group-1, ten observers with ages between 27 and 29 consisted Group-2 and another six observers with ages between 49 and 50 were placed in Group-3. In the rest of the analysis, these three observer groups were used. For each group, age
Fig 2: Chromaticities of matches of equal-energy white, computed using cone fundamentals from the 47 Stiles-Burch observer data and CIE06 predictions (top), and mean standard deviation of CIE06 cone fundamentals from the 47 Stiles-Burch observer data, with and without age correspondence (bottom)
Fig 3: Deviation of CIE06 and 10° Standard Observer x- CMF from average Stiles-Burch Observer for Group-1
correspondence for the average data were established by using the average S&B cone fundamentals for the group and CIE06 cone fundamentals for all possible ages.
4. COMPARING CIE06 MODEL PREDICTION AND 10° STANDARD OBSERVER WITH INTRA-GROUP
AVERAGE OBSERVER DATA
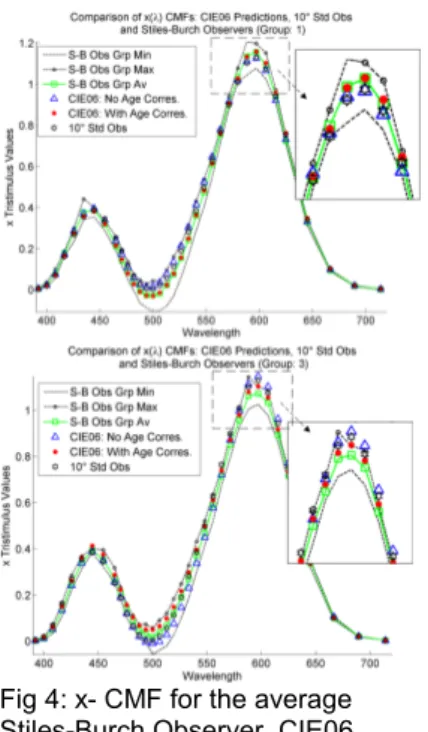
Due to the space constraint in this paper, we only show a few representative plots. Significant variations in x- CMF were observed between CIE06 model predictions and the 10° standard observer in case of Group 1 and 3. While CIE06 predictions worked well for the z- CMF, 10° standard observer showed significant error in all three groups. In general, for the y- CMF, the variations between the CMFs were not statistically
significant for any of the three groups. Fig 3 shows the log of wavelength-wise absolute difference of CIE06 predictions and 10° standard observer from the average S&B observer x- CMF for Group-1 (weighted by the same average). Difference of the 75th percentile of the group observer data from the average indicates the intra-group observer variability. For Group-1, the age correspondence method improves CIE06 prediction of x- CMF and is better than the 10° standard observer, which is also evident from fig 4. In general, CIE06 with no age
correspondence produces more or similar errors as the 10° standard observer for the x- CMF for Group-1 and 3. Cone fundamental plots show that in both cases, the average observer prediction error is more significant for the L- than for the M-. 5. DISPLAYS
In our analysis, we used four displays, two of which are included in this paper, and also described in the companion paper3. The first is a Sony BVM32 Cathode Ray Tube (CRT) reference studio display (hereafter referred to as Ref-CRT). The second is a Hewlett-Packard DreamColor Wide-Gamut Liquid Crystal Display with LED backlight (hereafter referred to as WG-LCD). Significant difference in the spectral power distributions of the two displays (fig 5) is likely to have different effects on observer variability. WG-LCD is
representative of modern wide- gamut displays with peaky primaries. 6. DISPLAY COLORIMETRY: WHICH SET OF CMFS IS BETTER?
In order to compare the results obtained by using various CMFs with respect to real observer data, chromaticities of color stimuli for a given display and a given set of CMFs must be computed. Note that display nonlinearity is not relevant for this simulation. As before3, 24-Colorchecker (CC) patches were used as the stimuli. XYZ tristimulus values of the CC patches were computed using 10° standard observer and D65. 3x3 primary tristimulus matrices of the two displays, computed from the measured XYZ values of the display primaries, were used to convert the XYZ of the CC patches to the
linearized RGB values corresponding to two displays. The product of the linearized RGB values and the spectral data of the display primaries gave the spectral power distributions of the CC patches for a given display. Finally, these spectral data were vectorially multiplied by a given set of 10° CMFs to obtain the XYZ tristimulus values for the CC patches, the given display and a given set of CMFs. CIELAB values were computed using these XYZ values and the XYZ of the white, computed using spectral power distribution of the display white and the CMFs under consideration.
Fig 4: x- CMF for the average Stiles-Burch Observer, CIE06 model predictions and 10° standard observer for Group 1 [top] and Group 3 [bottom]
Fig 5: Spectral Power Distribution of the two displays used in the analysis
In case of CIE06, the xyz CMFs were computed from various normal and modified 10° cone fundamentals. For this, as explained in the companion paper3, a 3x3 transformation matrix was computed using the 1964 10° x y z functions and average S&B cone fundamentals, which was used throughout the analysis. ∆E*00 values for the CC patches were computed separately for each
display, between any two sets of CMFs.
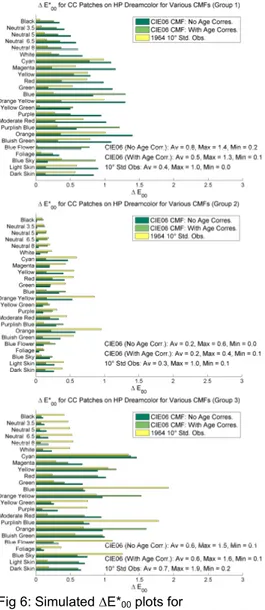
Fig 6 shows the color difference (∆E*00) values for CC patches simulated for WG-LCD, and computed
with CIE06 CMFs and 10° standard observer, with the intra-group average observer data as the reference. In case of Group-1, 10° standard observer performs better than the CIE06 model. The improvement with age correspondence is related to the x- function prediction error discussed earlier. For Group-1 and -3, while 10° standard observer produced relatively large errors in cyan/blue, arguably due to the poor match with the average observer in z- CMF, CIE06 model resulted in larger ∆E*00 values in the longer wavelengths of the color spectrum, mainly due to the x- CMF prediction
error. For Group-3, age correspondence method had no significant impact on ∆E*00 values for CIE06.
This indicates that in this case the x- CMF prediction error cannot be rectified by simply choosing different CIE06 age parameter values as model inputs. For Ref CRT, the difference between the CIE06 CMFs and the 10° standard observer was less apparent.
7. CONCLUSION
The long-wave sensitive (x-) color matching function derived from the CIE06 model did not accurately predict average Stiles-Burch observer data for two subgroups in the age ranges of 22-23 and 49-50. This could be due to random observer variability, but might also reflect the effect of at least one age-independent physiological factor not modeled in CIE063. The prediction error is reflected in the longer wavelengths of the color spectrum. On the other hand, the short-wave sensitive (z-) function of the 10° standard observer produced significant deviation with respect to the intra-group average observer for all three groups. Subject to further evaluation, the CIE06 model can provide the basis for the refinement of 10° standard observer.
ACKNOWLEDGMENT
We gratefully acknowledge Prof. Andrew Stockman, Dr. Boris Oicherman and Prof. Alexander Logvinenko for their assistance with the tabulation of Stiles-Burch dataset, and Prof. Stockman and Prof. Françoise Viénot for the valuable discussions on this topic.
REFERENCES
1. CIE, “Fundamental Chromaticity Diagram with
Physiological Axes – Part I”, CIE Technical Report, 170-1:2006, 2006.
2. W.S.Stiles and J.M. Burch, “N.P.L. colour-matching investigation: final report”, Optica Acta, Vol. 6, pp 1-26, 1959.
3. A. Sarkar et al., “Study of observer variability on modern display colorimetry: an analysis of CIE 2006 model”, Companion paper, 11th Congress of the International Colour Association (AIC), Sydney, Australia, 2009.
Fig 6: Simulated ∆E*00 plots for
ColorChecker patches shown on WG-LCD and computed for various CMFs
corresponding to Group-1 [top], -2 [middle] and -3 [bottom]