Titre:
Title:
Star scientists and their positions in the Canadian biotechnology network
Auteurs:
Authors: Andrea Schiffauerova et Catherine Beaudry
Date: 2011 Référence:
Citation:
Schiffauerova, Andrea et Beaudry, Catherine (2011). Star scientists and their
positions in the Canadian biotechnology network. Economics of Innovation and New Technology, 20(4), p. 343-366. doi:10.1080/10438591003696886
Document en libre accès dans PolyPublie
Open Access document in PolyPublie URL de PolyPublie:
PolyPublie URL: http://publications.polymtl.ca/2301/
Version: Version finale avant publication / Accepted versionRévisé par les pairs / Refereed Conditions d’utilisation:
Terms of Use: CC BY-NC-ND
Document publié chez l’éditeur commercial Document issued by the commercial publisher
Titre de la revue:
Journal Title: Economics of Innovation and New Technology Maison d’édition:
Publisher: Taylor & Francis URL officiel:
Official URL: http://dx.doi.org/10.1080/10438591003696886 Mention légale:
Legal notice:
This is an Accepted Manuscript of an article published by Taylor & Francis in Economics of Innovation and New Technology on 2011, available online:
http://www.tandfonline.com/10.1080/10438591003696886.
Ce fichier a été téléchargé à partir de PolyPublie, le dépôt institutionnel de Polytechnique Montréal
This file has been downloaded from PolyPublie, the institutional repository of Polytechnique Montréal
Star Scientists and their Positions in Canadian
Biotechnology Network
±Andrea Schiffauerova and Catherine Beaudry
Affiliations:Andrea Schiffauerova:
Concordia Institute for Information Systems Engineering, Concordia University, Canada
The author responsible for correspondence, reprints and proofs: Catherine Beaudry :
Département de mathématiques et de génie industriel, École Polytechnique de Montréal, C.P. 6079, succursale Centre-ville, Montréal (Québec) Canada, H3C
3A7 [email protected], tel. +1 (514) 340 4711 ext.3357
± Beaudry acknowledges financial support of the Social Science and Humanities Research Council of Canada. We
acknowledge helpful comments from Jorge Niosi and Nathalie de Marcellis-Warin as well as from the InnovaRisQ research team. We are grateful to Ahmad Barirani for the extraction program used in the data collection. None of these, however, are responsible for any remaining errors.
Abstract
This paper identifies the prominent inventors (star-scientists) in the Canadian biotechnology co-inventorship network by taking into consideration either only patent quantity or both patent quantity and quality. The paper studies the positions of these stars in the network structure and our results show that inventors with a higher number of patents assume more central positions in the network: they have more collaborators, enjoy better access to information and also have greater control over knowledge flows in the network. Nevertheless, their network positions do not have higher levels of local cliquishness, suggesting that a clustered local neighbourhood may not have any positive impact on a scientist’s innovative productivity. We also find that the majority of the stars play a knowledge gatekeeping role – nurturing clusters with knowledge originating outside. Finally, we examine and discuss the network dynamics and the role of these stars in the information transmission efficiency.
Keywords: star-scientists, innovation, patents, network structure, network dynamics, biotechnology
1. Introduction
There has been a growing recognition in the past years that top scientific individuals are a key driving force for the growth and innovation in biotechnology. The majority of scientists have very low productivity. Most of the scientific output is typically produced by the top 1% or 2% of scientists working in a specific area. The most productive scientists are generally called star scientists1: they only account for 0.8% of scientists, but are the authors of 17.3% of the published articles. Their productivity is thus almost 22 times higher than the average biotechnology scientist’s (Zucker and Darby, 1996b; Zucker et al., 1998a). The literature therefore often focuses on the scientific elite, their collaboration with the industry and the localized effects it creates.
The evidence shows that the relationship between the star scientists and firms is symbiotic, as it contributes to the success of both the stars and their scientific performance, and the success of the companies and their commercial objectives. Zucker et al. (1998a) explain that locally linked star scientists provide access to and information about discoveries and advice to the firm concerning their bioscience research. Their results show that collaborative research (evidenced by coauthored publications) has a significant positive effect on firm performance as measured by the number of products in development, number of products in market and employment growth. Moreover, they claim that the number of star-firm collaborations powerfully predicts success: for an average firm, five articles coauthored by academic stars and the firm’s scientists imply about five times more products in development, 3.5 more products on the market, and 860 more employees. However, Zucker and Darby (1996b) reported that the importance of the stars for the company is much lower in the later stages of the development when the new techniques have already diffused widely. Moreover, the cooperation of the company scientists with the star scientists outside their organization
1 Star scientists in biotechnology were defined by Zucker and Darby (1996b) as the scientists with more than 40 genetic sequence discoveries or 20 or more articles reporting genetic sequence discoveries by 1990.
is less desirable if the value of the research in question is high. Zucker et al. (1996) also relate the collaboration network structure in biotechnology to the value of the information in the underlying research project: the more valuable the information, the more likely the collaboration is confined to a single organization. As the expected value of research increases, star scientists are more likely to collaborate with scientists from their own organization. Diffusion of discoveries to other scientists decreases as the share of within-organization collaboration increases.
The positive effect of the collaboration between the stars and the companies is also reflected in the higher scientific productivity of the stars. Zucker and Darby (1996b) suggest that stars with commercial ties publish at higher rate before, during and after those ties. Furthermore, scientific articles by stars collaborating with or employed by firms have significantly higher rates of citation than articles written by pure academic stars or other articles written by the same stars before or after the collaboration. The authors show that the presence of just one more affiliated star approximately doubles the expected citations received by an article. The authors speculate that this could be due to the fact that star scientists receive more resources from biotechnology enterprises and also do the work that is more highly cited while working for or with a biotechnology firm. In addition, it is shown that the citations to star scientists increase for those who are more involved in commercialization by patenting. In other words, their research shows that the scientists with patents are generally more widely cited than the scientists without patents, and affiliated scientists are more cited than linked scientists who in turn are more cited than untied scientists. Zucker et al. (1998a) confirm these results, and in addition they argue that those stars affiliated with firms are also very different in their patenting activity compared to unaffiliated university stars. Their results show that 50% of affiliated stars have patented discoveries versus only 15.6% of the university stars. The patenting of discoveries by stars is an indication of expected commercial value of their discoveries.
The importance of geographic proximity and linkages between scientists and biotechnology firms are often explored in the literature. The creation of geographically bounded networks between university-based scientists and the companies is explained by Zucker et al. (1998a). Star scientists in biotechnology, who are initially typically employed by universities, appropriate much more benefits from their research than the employing university itself. If their research is potentially significantly successful, they create a spin-off company in order to appropriate the economic value of this research through entrepreneurial activity. These star scientists generally retain their university affiliations while involved in commercial applications within easy commuting distance of home or university, thus creating the localized effects of university research. The location of the star scientists was therefore found to be a principal determinant of the location of new biotechnology enterprises. Zucker and Brewer (1994), Zucker and Darby (1996a) and Zucker et al. (1998b) provided considerable evidence suggesting that the timing, location and the success of new biotechnology firms is primarily explained by the presence at a particular time and place of scientists who are actively contributing to the basic science.
The phenomenon of star scientists has not been studied in as much details in Canada. Zucker and Darby (1996b) found no evidence of substantial star involvement (star affiliated with or linked to a biotechnology company) by Canadian biotechnology stars. Moreover, according to their results Canada was indicated as the major loser of key talent in biotechnology by migration (together with Switzerland and United Kingdom). The Canadian losses presumably reflect the ease of mobility to the particularly attractive US market.
According to Queenton and Niosi (2003), however, Canadian biotechnology clusters are strongly related to high-class academic research and especially to the star scientists working in universities. Their study also highlights the importance of geographical proximity of star scientists for obtaining the venture capital, and for starting and growing the biotechnology firm.
It was confirmed that also in Canada many of the star scientists capitalise on their knowledge through firm start-ups. Niosi (2003) estimates that one third of Canadian biotechnology firms are university spin-offs.
This paper adds to the research on the biotechnology star scientists in Canada. We propose a new method of identification of the star scientists, which involves both the quantity and quality of the patents. Moreover, we adopt a network approach and look for the positions of the star scientists in a complex net of innovative collaborations. We find that the inventors with a higher number of patents assume more central positions in the network: they have more collaborators, they enjoy better access to information and they also have greater control over the knowledge flows in the network. However, we do not find similar correlation for the level of the local cliquishness, which suggests that being embedded in highly clustered local neighbourhood may not have any positive impact on innovative productivity of the individual scientist. Finally, we find that the majority of the star and QQ-star scientists are also gatekeepers – the inventors responsible for nurturing the clusters with the knowledge originating outside.
The paper is organised as follows: section 2 introduces the methodology and the data used in this study, section 3 presents several methods of identification of star scientists in Canadian biotechnology, section 4 studies the positions of these stars in the collaboration network and section 5 concludes.
2. Methodology
The patent database used for the empirical analysis is the United States Patents and Trademarks Office (USPTO) database. This is the only patent database which provides the
geographical location of the residence of each inventor. The use of the USPTO database instead of the CIPO may cause a certain bias in the data, which we consider minimal, since Canadian inventors usually patent both in Canada and in the US. The much larger and easily accessible American biotechnology market offers them a greater potential than the biotechnology market in Canada.
Biotechnology encompasses several different research technologies and several fields of application. We have opted to base our USPTO search strategy on the OECD definition of biotechnology, which is based on the group of carefully selected International Patent Codes (IPC)2. An automated extraction program was used to collect the required information3 from biotechnology patents. All biotechnology patents granted before March 31, 2007 are included. According to the above definition, there are around 100 000 biotechnology patents registered at the USPTO. We created a patent database, which contains all patents for which at least one inventor resides in Canada and which comprises 3550 patents. We used the concept of social network analysis to create connections between the inventors from the extracted patent information, and with the help of the social network analysis program PAJEK we constructed innovation networks. An analysis of these networks enabled us to calculate various properties describing the position of each inventor in the network. These proprieties will be addressed in section 4.
2 The OECD definition of biotechnology patents covers the following IPC classes: A01H1/00, A01H4/00,
A61K38/00, A61K39/00, A61K48/00, C02F3/34, C07G(11/00, 13/00, 15/00), C07K(4/00, 14/00, 16/00, 17/00, 19/00), C12M, C12N, C12P, C12Q, C12S, G01N27/327, G01N33/(53*, 54*, 55*, 57*, 68, 74, 76, 78, 88, 92).
3 Extracted information necessary for the research leading to this paper includes the patent number, the number of
We have created two different kinds of networks: First, the complete network, which includes all 4569 biotechnology inventors in our database which are listed as inventors or co-inventors on any patent issued in the period of 1976 and 2007. Here we have assumed that once inventors unite and collaborate on one patent they continue to be in contact afterwards and are able to exchange information acquired long after the patent had been granted. It usually takes about ten years for a human health biotechnology product to reach the market and we suppose that inventors collaborate on the project for a large proportion of this period. It has been suggested (Dahl and Pedersen, 2005) that the relationships among co-inventors persist even after the project has ended, because they often remain in social contact and continue sharing their knowledge. This allows us to disregard the time of collaboration and to consider all links among inventors in the network as active simultaneously. We are aware that this is a strong assumption, but it is necessary to take into consideration the fact that our network is composed of a number of disjoint network components4 that do not span the entire 31 years of the database (99% of the network
components are composed of a relatively small number of individuals and span quite short periods of time). The inventors within each component could thus be considered to be inter-connected during the whole span of the component.
Second, in order to track the evolution of the network positions of the star scientists over time we have created 16 subnetworks corresponding to five-year moving windows starting from 1986 and finishing in 2006 (see Figure 1). As Canadian biotechnology patenting in the period preceding the year of 1986 is rather sporadic we decided to start with the first year when more than 20 Canadian biotechnology patents were issued. In addition we did not include the year
4 A component is a part of a network which includes a maximum number of vertices which are all directly or
2007 as it is only partially covered in our database. Constructing the network for each year separately would alter the connectivity of the networks. Using only the patents granted in a given year would not capture the relationships created before and maintained through this particular year. We selected to work with the subnetworks created during the interval of five years since we assume that this is a minimum period length during which the relationship between any co-inventors who appeared together on one USPTO patent lasts and during which information and scientific knowledge could be actively exchanged. Five-year moving windows thus more accurately reflect the structure of a collaboration network.
3. Identification of the star scientists in Canadian biotechnology
The resulting complete network of Canadian biotechnology inventors includes 4569 vertices (representing inventors) and 9731 edges (representing collaborative relations5). Based on the
residences of inventors, we have identified 12 Canadian biotechnology clusters6: 20% of
inventors reside in the Toronto cluster, 15% in the Montreal cluster and 9% in the Vancouver one. Only a very small portion of inventors (around 3%) residing in Canada live outside the 12 defined clusters and around 29% of inventors in our sample reside outside the Canadian borders.
The main focus of this research concerns the most inventive of the Canadian biotechnology researchers – the star scientists. Zucker and Darby (1996) created the definition of the
5 Each collaborative relation (also called a collaborative link) represents a connection between a pair of inventors,
which involves one or more instances of co-invention of a biotechnology patent.
6 A cluster is defined in this study as a geographically continuous region active in biotechnology (as measured by the
biotechnology star scientists based on the number of genetic sequence discoveries or the number of articles reporting genetic sequence discoveries. Queenton and Niosi (2003), who searched for biotechnology stars in Canada, included the number of genetic sequence discoveries, the number of publications and the number of patents in their definitions. In this research we consider patents as the main discriminatory indicator. We defined the prominent researchers in our dataset based on patent quantity only, or based on both the quantity and quality simultaneously. Moreover, we included the examination of the most prominent researchers based on their record of forward citations in scientific articles.
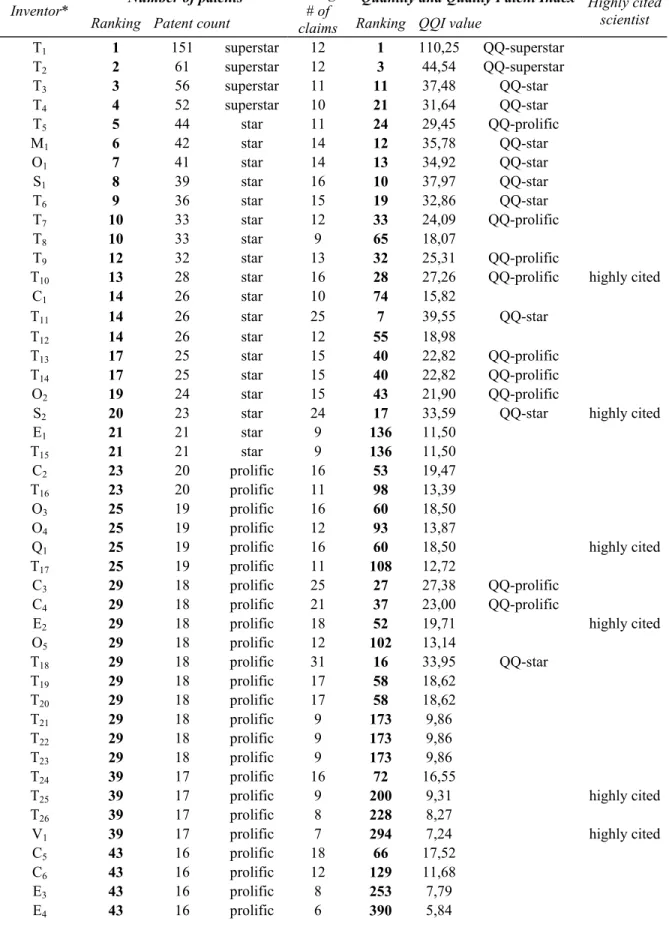
First, we considered using only the number of patents as a discriminatory indicator. The numbers of patents authored or co-authored by each inventor are displayed in Figure 1. It is evident that most inventive output is produced by only a small percentage of the most prolific inventors some of which are listed in Table 17. We define every inventor with more than 15
patents to be prolific; according to this classification, 51 prolific inventors in Canadian biotechnology are identified (which is around 1% of all inventors). Then among these, 22 inventors are considered to be star scientists, defined here as all the inventors with more than 20 patents. Four of the most prolific inventors have made a significantly greater contribution to the biotechnology innovation than other inventors and produced more than 50 patents. We shall call these individuals superstars. As an example, the most productive inventor in Canadian biotechnology has registered 151 patents. This is considerably more than any other researcher in the group (see Figure 1), we may be measuring a “lab director effect” here.
7 We have anonymised the list, the first letter represents the town of residence of the inventor and the digit subscript,
(Insert Figure 1 here)
During our research we have observed that there are great differences in patent quality, which we measured by the average number of the patent claims8. Table 1 shows that the most
prolific inventors do not necessarily register patents with the highest value. Therefore we have decided to incorporate patent quality as a second discriminatory factor when defining star scientists. We have created a Quantity and Quality Patent Index (QQ Index), which takes into consideration both patent counts and the mean patent value for each inventor:
* avg i i i avg N C QQI C = where
• QQIi value of the QQ Index indicator for inventor i;
• Ni number of patents at the USPTO invented by inventor i;
• avg average number of patent claims for all patents at the USPTO by inventor i;
i
C
• Cavg average number of patent claims for all inventors in the database.
8 Patent claims are a series of numbered expressions describing the invention in technical terms and defining the
extent of the protection conferred by a patent (the legal scope of the patent). A high number of patent claims is an indication that an innovation is broader and has a greater potential profitability. It has been frequently suggested and empirically demonstrated (see for example Tong and Frame, 1994) that the number of claims is significantly and consistently indicative of higher value patents. The conclusions of most of the papers on patent value reviewed by van Zeebroeck and van Pottelsberghe de la Potterie (2006) are supportive of the positive association of the number of claims with patent value. Lanjouw and Schankerman (2004) have suggested that specifically in biotechnology the number of claims is the most important indicator of patent quality. Nevertheless, the research of Gambardella et al. (2008) does not provide great support for this measure. They find that the overall impact of this and other commonly used indicators for patent quality is in fact very small and call upon the research community to explore new and better determinants of the economic value of patents. We are aware of how problematic the issue of a patent value is, however, the number of patent claims is, to our knowledge, the best possible measure to be used in this research at this point.
This indicator modifies the number of patents according to the gap between the average number of claims of a particular inventor and an average number of claims for all the inventors in the database. For an inventor which produces patents of an average value, this indicator should be equal to his number of patents, whereas the other inventors can improve or worsen their standing depending on the average quality of their patents. According to the QQ Index we define a QQ-prolific inventor as one with a minimal QQ Index value of 20 (there are 50 of such inventors, which again represent around 1% of all the inventors) and a QQ-star inventor as one with an index greater than 30 (22 of such star inventors). Three inventors with the highest value of QQ Index are called QQ-superstars. Table 1 shows that for the most prolific inventors, the picture has not changed dramatically, but is slightly modified. Many inventors in the database however had to give up their prominent positions and, on the other hand, many have substantially improved their ranking.
(Insert Table 1 here)
The third indicator which we used to find the prominent inventors is related to the more scholarly side of a researcher’s qualities. The number of forward citations to the researchers’ articles represents a scientist’s ability to contribute to knowledge development. ISI Web of
KnowledgeSM provides a tool to identify individuals that have made fundamental contributions to the advancement of science and technology in recent decades. It lists the most highly cited individuals within several broad subject categories for the period 1981-1999 (Later years are not currently available)9. The list includes only the researchers with a really extraordinary
9 As a consequence of the lack of the more current observations, older scientists with an extensive publication record probably have a better chance of being classified as star scientists because of the extensive observation
accomplishment, since it comprises less than 0.5% of all publishing researchers in the database. We have merged the data obtained from the list of highly cited scientists in biotechnology into our database of inventors. We have found that 28 of our inventors are also highly influential scientists and scholars as illustrated in the last column of Table 1.
Surprisingly, the three distinct indicators of the prominent inventors showed quite different results. This methodology has enabled us to identify 101 prominent inventors (95 of them from Canadian clusters).Only two (T10 and S2) scientists/inventors are however indicated as prominent
by all three measures, 24 inventors are considered to be prominent by two of the indicators, 18 of which are concurrently identified by both the number of patents and the QQ Index. The two measures are obviously much more correlated together than with the indicator of highly cited scientists. For example, two of the five existing superstars are also QQ-superstars and two others are QQ-stars. The remaining 75 inventors were identified as prominent by only one measure. Among them, one QQ-superstar scientist falls to the 57th rank if the patent value is not taken into
consideration and many other QQ-prolific inventors would occupy a rank as low as the 361st rank. The value of a patent hence seems to be an important discriminatory factor. Furthermore, some of the highly cited inventors reach even lower positions based on the other two indicators (as low as 1956thrank), since eight of the highly cited scientists have only one biotech patent at
the USPTO, while six of them appear as inventors only on two patents. Moreover, the fact that we found only 28 matching scientists in both lists suggests that there must also be many highly influential biotechnology researchers (as acknowledged by their citing colleagues) who never
period, whereas younger scientists who already belong to the very top of their class may still not be included because they have not yet accumulated enough publications and citations.
filed any patent application at the USPTO10. We assume that these highly cited scientists come
mostly from an academic environment, where the publication performance is more appreciated and more rewarding than impressive patent scores. The scientists with the most prolific publication record may thus often neglect patent application opportunities. A much less probable explanation is that these highly cited scientists simply patent their inventions at different patent offices (e.g. CIPO or EPO).
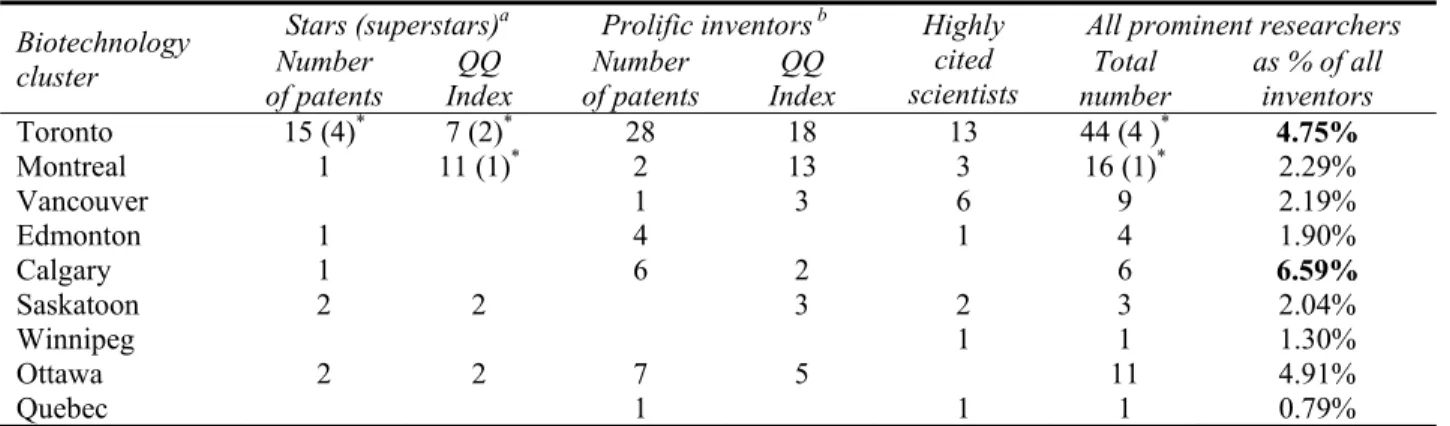
Table 2 presents the results per cluster by including all the discussed measures. Toronto is the leader in the number of prominent scientists in the cluster (44 scientists out of which 4 are superstars) while Montreal and Vancouver are far behind (16 and 9 scientists, respectively). In terms of sheer number of patents, Toronto excels (15 stars) but when the quality is taken into consideration, Montreal has in fact more QQ-star scientists who produce patents of high value than Toronto (11 stars compared to 7 stars). The Toronto cluster also houses the highest number of scientists with an outstanding citation record (12 scientists), whereas Montreal is lagging behind with only 3 highly cited scientists in the database. Vancouver’s record is more modest on all fronts (it has virtually no star and only 3 prolific scientists), except the indicator of highly cited researchers (with 6 such scientists). The small clusters of Kingston, Halifax and Sherbrooke do not enjoy the benefits of any prominent scientist.
(Insert Table 2 here)
10The difference in the publication and patent records has been already observed at the Japanese corporate scientists in the pharmaceutical industry (Furukawa and Goto, 2006). The most frequently publishing scientists did not apply for a considerably greater number of patents than other researchers in their companies, but they had a positive effect on the number of patent applications filed by their co-authors.
To conclude this section, we found it very fruitful to use the multi-indicator approach for the analysis of the prominent scientists. The picture became much more complete when we included the patent value in the equation instead of the sole patent count. We found that star scientists or highly prolific biotechnology inventors do not necessarily author or co-author patents of the highest value. By taking into consideration patent quality, the ranking of star and prolific inventors has changed. Not all prominent and highly cited researchers and scientists in biotechnology produce patents or register them at the USPTO, and for those that do, their patents are not of the highest value in terms of number of claims.
4. The position of the star and QQ-star scientists in the network
This section investigates the positions of the stars and QQ-stars in the Canadian biotechnology collaboration network. Moreover, we explore the level of overlapping of the prominent researchers and the gatekeepers, which are Canadian inventors who due to their strategic positions in the network enable the nurturing of clusters with fresh knowledge originating outside (Schiffauerova and Beaudry, 2009a).
4.1 Hypotheses
We expect to find evidence of the crucial role played by star scientists in biotechnology networks by occupying very central network positions. The central position in the network structure usually implies that star scientists are connected to a much larger number of inventors than others. Obviously, the identification of both the star or QQ-star scientists is directly related
to the number of patents they produced and thus we can certainly assume that the scientists with higher number of patents or higher QQ Index score will have a higher number of collaborators. Our first hypothesis can read as follows:
• Hypothesis H1a: The inventors with a higher patent production have more collaborators. • Hypothesis H1b: The inventors with a higher QQ Index have more collaborators.
Since the inventors with a higher number of patents are usually more central they are also much better interconnected in the complex net of interrelationships. The central network position of the star or QQ-star scientists enables them to reach all other inventors in the network faster, because the length of the shortest paths11 between them and other inventors is usually greatly reduced due to the numerous connections they have. As a consequence, the stars and QQ-stars are able to get a much improved access to knowledge in the network. This brings us to the second hypothesis:
• Hypothesis H2a: The inventors with a higher patent production enjoy better access to
information because of the reduced shortest paths to all the other inventors in the network.
• Hypothesis H2b: The inventors with a higher QQ Index enjoy better access to information
because of the reduced shortest paths to all the other inventors in the network.
We expect that the star and QQ-star inventors will also have more strategic positions in the network in terms of their ability to control the flow of information between other inventors. Their
11 The length of the shortest path depends on the number of intermediaries needed for an inventor to reach another
highly central positions enable them to act as intermediaries for the transfer of knowledge between many other inventors in the network. This increased flow of knowledge thus gives them a greater power over the knowledge distribution among others. The existence of the star and
QQ-star inventors is thus crucial for a great number of other inventors in the network and their
disappearance from the network would not only slow down the knowledge flow in the whole network by increasing the lengths of the shortest paths among many others, but it would also completely disconnect many inventors and thus highly limit their knowledge sources. Therefore we suppose that the inventors with a higher number of patents or QQ Index scores should have more strategic network positions and thus have control over a greater flow of information, hence the third hypothesis:
• Hypothesis H3a: The inventors with a higher patent production have control over a
greater amount of knowledge which passes through them.
• Hypothesis H3b: The inventors with a higher QQ Index have control over a greater
amount of knowledge which passes through them.
We also suppose that the local neighbourhood of the star and QQ-star inventors will be more cliquish12. The stars or QQ-stars have direct or indirect access to a larger number of other
innovators and we therefore assume that their local environment will be also more dense and cohesive. This should support friendship and trust-building, and thus facilitate collaboration between the innovators. We thus expect that this will also be a contributing factor to the success of the stars and QQ-stars, which leads to our fourth hypothesis:
12 Cliquishness refers to the likelihood that two inventors who are both connected to the same third inventor are also
• Hypothesis H4a: The inventors with a higher patent production are positioned in more
cliquish local neighbourhoods.
• Hypothesis H4b: The inventors with a higher QQ Index are positioned in more cliquish
local neighbourhoods.
We expect that star and QQ-star inventors will also play a crucial role in the nurturing of clusters with fresh knowledge originating outside. They have more collaborators and we suppose that many of these reside in different clusters or even countries. The abundant connections outside their own clusters should enable the stars and QQ-stars to serve as knowledge gatekeepers - as procurers of external knowledge for other inventors which collaborate less or focus on joint research within the same region. The star and QQ-star inventors will thus be among the few inventors who are responsible for the inflow of external information to the cluster and will also play much more important role in nurturing of clusters with fresh outside knowledge, which brings us to our fifth hypothesis.
• Hypothesis H5a: The inventors with a higher patent production play more important role
as gatekeepers for the clusters in which they reside.
• Hypothesis H5b: The inventors with a higher QQ Index play more important role as
gatekeepers for the clusters in which they reside.
Similarly, we assume that the importance of the star and QQ-star inventors as procurers of external knowledge for Canada will also be much higher than the importance of less prolific inventors. Now we are interested in the more general impact of inventors which import the external knowledge to other Canadian inventors and the importance of that knowledge for
Canada in terms of its contribution to the innovative potential. Our sixth hypothesis therefore proposes that the inventors with higher number of patents or higher QQ Index will also play much more important role as procurers of outside knowledge for Canada:
• Hypothesis H6a: The inventors with a higher patent production play more important role
as gatekeepers for Canada.
• Hypothesis H6b: The inventors with a higher QQ Index play more important role as
gatekeepers for Canada.
4.2 Methodology and results
In order to validate the above hypotheses we use the most common measure of correlation – the Pearson Product Moment Correlation, which reflects the degree of linear relationship between two variables. We calculate the correlation coefficients for each two variables for every hypothesis as explained in Table 3. Various indicators of the structural network properties13 are used as variables representing the attributes of the inventors’ positions: The number of collaborators of each inventor in H1 is calculated as the degree centrality, which measures the number of lines that are connected to each vertex. The closeness of the inventors to all other inventors in the network in H2 is measured by the closeness centrality of each vertex expressed as the number of other vertices divided by the sum of all distances between the vertex and all others. However, since closeness centrality is calculated only among the inventors who are directly or indirectly interconnected, it would be misleading to use this measure for all of them. The vertices in small components would show very high centralities, because all the inventors
13 For a more detailed description of the network properties (degree centrality, closeness centrality, betweenness
are close to each other, but it would not reveal much about their centrality in comparison with the inventors included in other components. We expect that the total correlation would then be greatly underestimated. Therefore, we include in the testing for H2 only the inventors who are interconnected in the largest network component. The amount of information which passes through each inventor in H3 is calculated with the betweenness centrality of each vertex, which measures the proportion of all shortest distances between pairs of other vertices that include this vertex. Average egocentric density, which is a fraction of all pairs of the immediate neighbours of a vertex that are also directly connected to each other, is used to measure the degree of local cliquishness for each inventor in H4. Finally, in hypotheses H5 and H6 we use the indices defined in Schiffauerova and Beaudry (2009a): Gatekeeper’s Importance Index for Cluster (GIcluster
Index) and Gatekeeper’s Importance Index for Canada (GICanada Index)14, each calculated for
every vertex in the network.
(Insert Table 3 here)
The resulting values of the correlation coefficients calculated in the complete network are shown in Table 4. Since for large samples it is usually easy to achieve significance of the 14 1000 1000 where: …
• …Gatekeeper`s Index of Importance for C n a for inventor • Gatekeeper`s Index of Importance for C uster for inventor l
a • …the number of inter-cluster links of the inventor ad
• …the sum of all inter-clus r links of the C-C group (which includes the inventor ) te
• …the sum of all the patents authored or co-authored by at least one inventor from the C-C group in ludes the inventor )
(which c
• …the sum of all the patents authored or co-authored by all the inventors in the cluster in which the resides
inventor
• … the sum of all the patents authore or co-authored by all the inventors residing in Canadian
sters d
clu
correlation, all of our correlation coefficients were found highly significant. The strength of the relationship was thus used to determine if the relationship explains very much or not.
(Insert Table 4 here)
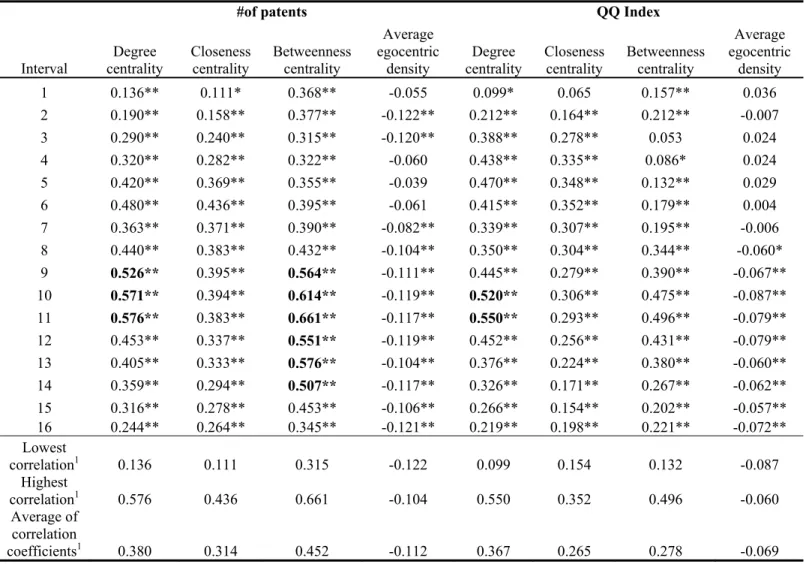
The resulting values of the correlation coefficients calculated in the 16 subnetworks are shown in Table 5. Since the sizes of the subnetworks are smaller than the size of the complete network, the significance (at the 0.01 or 0.05 levels) was not achieved for some of the results. For most of the results however the strength of the relationship could have been used for the hypotheses validation. The variables were considered uncorrelated if r < 0.1, weakly correlated if 0.1 < r < 0.3, moderately correlated if 0.3 < r < 0.5 and strongly correlated if 0.5 < r < 1.00.
(Insert Table 5 here)
The results for each hypothesis are summarized in Table 6 and Table 7. The correlations were found to be very strong in both hypotheses H1a and H1b when calculated in the complete network and moderately strong when calculated in the subnetworks. The correlations between these values were expected, since the number of collaborators of an inventor is usually related to the number of his patents. By every jointly created invention leading to a new patent the inventor usually also gains new collaborators (unless he continues to work always with the same group of inventors in all of his patents). Also the more central positions of the inventors with a higher number of patents (or higher QQ Index scores) were confirmed in both H2a and H2b and both
H3a and H3b, even though for H2b and H3b the relationship was found to be weak in most of the subnetworks We confirmed that the most important inventors in terms of patent counts and patent quality do play more important roles in the networks. They have a better ability to reach all the knowledge in the network due to the reduced length of the shortest paths to all other
inventors. Moreover, their positions are highly strategic, since they enable them to assume control over a great flow of information.
Hypotheses H4a and H4b were however confirmed neither in the complete network nor in the subnetworks. The inverse but extremely weak relationships between the number of patents or level of QQ Index and the level of the local cliquishness of an inventor were found to exist. This means that our assumption of dense and cohesive relationships supporting friendship and trust-building, thereby facilitating collaboration between the innovators and thus contributing to the innovativeness was not supported. The research carried out in the area of network cliquishness has also not been conclusive so far. On the one hand, Uzzi and Spiro (2004) and Schiling and Phelps (2007) show that high cliquishness in the networks enhances the system`s innovative performance. On the other hand, the empirical findings of Fleming et al. (2006) prove the negative impact of the higher degree of cliquishness in the network on the innovative productivity. The authors argue that there is an optimal degree of cliquishness that depends on a variety of factors. Cowan and Jonard (2003) identify both positive and negative effects of high cliquishness on knowledge growth. They argue that the net effect is determined by both the benefits from differentiated neighbourhoods (agents in various neighbourhoods highly differ) and the loss due to repetition (cliquishness duplicates transmissions). The very weak negative correlation we obtained makes us lean towards the view that there are negative effects of high cliquishness on knowledge growth. More empirical research is needed to clarify this relationship.
Finally, the two hypotheses related to the gatekeepers have mixed results. The importance of a gatekeeper as the procurer of external knowledge for the cluster in which he resides in H5a and
H5b proved to be only very weakly correlated to the number of patents or QQ Index; however the importance of gatekeeper for Canada was found to be either strongly (H6a) or moderately (H6b)
correlated. This is not surprising, since the number of patents or QQ Index are calculated globally as is the GICanada Index but GIcluster Index reflects only the local role of the intermediary
in his own cluster. His role could be very significant in certain smaller or medium-sized clusters, but at the same time quite negligible in terms of his contribution to the overall Canadian innovative potential. Due to the limitations of our data, the strength of these four relationships (H5a, H5b, H6a and H6b) was calculated only in the complete networks, but not in the subnetworks.
(Insert Table 6 here)
4.3 Are stars and QQ-stars also gatekeepers?
The next step involves the identification of the level of overlap between the star or QQ-star inventors and the gatekeepers as defined by Schiffauerova and Beaudry (2009a). Since the correlation between the patent counts or QQ Index and the Gatekeeper’s Index of Importance for
Canada is confirmed, we want to see how many of the stars or QQ-stars are also gatekeepers of
significant importance for Canada. Table shows absolute and relative numbers of the star,
QQ-star and highly cited scientists who belong to the five categories15 of inventors based on their
network positions and the level of the Gatekeeper’s Index of importance for Canada, as they were defined in Schiffauerova and Beaudry (2009a). Internal and external inventors do not participate in the transmission of external knowledge to the cluster, since they lack either the connection outside their cluster (internal inventors) or inside their cluster (external inventors). These inventors constitute the majority of inventors in all the clusters. The stars, QQ-star of
15 internal inventors (only intra-cluster collaborations), external inventors (only inter-cluster collaborations),
redundant intermediaries (intermediaries with betweenness = 0), gatekeepers (intermediaries with 0 ‹ GIcluster ‹ 0.001)
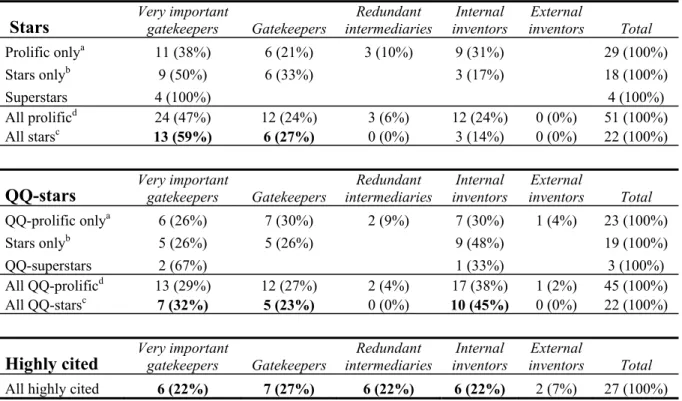
highly cited scientists are rarely external inventors, but around 14% of stars, 45% of QQ-stars and 22% of highly cited scientists are internal inventors who collaborate exclusively within their own cluster. Inventors which do maintain both intra-cluster and inter-cluster collaborations, but do not serve as indispensible intermediaries for other inventors are called redundant intermediaries. Such intermediaries bring redundant external knowledge to the cluster, since not only would their disappearance not reduce the amount of transmitted external knowledge but it would not even make the shortest path for that transmission longer. These inventors could be theoretically still quite productive and thus considered important creators of biotechnology innovation, but they are not essential as external knowledge procurers. As the results in Table 8 show, there are no stars or QQ-stars among the redundant intermediaries, but 22% of highly cited scientists belong to this inventor category. Gatekeepers are the intermediaries which do introduce non-redundant knowledge to the cluster and thereby contribute to the innovative potential of other inventors in Canada. The inventors with the top highest scores of GICanada
Index are called here very important gatekeepers. The table shows that 86% of all star inventors
are gatekeepers (27% are gatekeepers and 59% are very important gatekeepers), 55% of all
QQ-stars are gatekeepers (23% are gatekeepers and 33% are very important gatekeepers) and 49% of
all the highly cited scientists are gatekeepers as well (27% are gatekeepers and 22% are very important gatekeepers).
(Insert Table 8 here)
Thus we can conclude that the majority of the star and QQ-star scientists are also gatekeepers. However, the relationship between the stars and the gatekeepers seems to be stronger than the relationship between the QQ-stars and the gatekeepers. This was expected since there the GI indices do not involve the patent quality. This was also confirmed by the
correlation coefficients in the previous analysis, which were showing somewhat higher strength for the relationship between the number of patents and GICanada Index (Hypothesis H6a) and also in all the cases of the vertex centralities (Hypotheses H1a, H2a and H3a) than for the same relationships with the QQ Index (Hypotheses H1b, H2b, H3b and H6b). This suggests that even if the QQ Index may be a more accurate measure of the inventor’s importance in terms of his inventive contribution as it reflects both the quantity and the quality of his patents, it is less accurate when assessing the importance of the position for the inventor in the network and his importance as gatekeeper. It is the number of patents but not the quality of these patents, which is related to the ability of the inventor to acquire external knowledge and to nurture the clusters with information from outside. The inventor with a high number of patents usually benefits from a denser and more developed network of social connections. This enhances speed and likelihood of his access to the outside knowledge. Moreover, multiple sources of information enable him to acquire alternative interpretations of problems and their potential solutions. The richer and greater amounts of information and knowledge are thus exchanged and integrated among his fellow colleagues from the same cluster. The typically abundant connections within the cluster further facilitate the dissemination of the acquired knowledge. Star scientists are thus very well equipped to play the gatekeeping role in the network.
4.4 Star and QQ-star scientists: the dynamic perspective
The final section takes a dynamic perspective and explores the evolution of the biotechnology field in Canada with the focus on the innovation network structure and the network’s most central inventors – star and QQ-star scientists.
Figure 2 shows an average number of patents produced or co-produced per inventor in each of the 16 intervals. On average, inventors became more productive over the years. Their patenting activity peaked in the years of 2000-2003. In fact, in 2002, biotechnology was considered to be one the most dynamic and fastest growing fields in Canada. According to the Statistics Canada (2005), biotechnology companies have more than quadrupled their revenues in 1997-2003. By 2002, Canada was the second most active country in the world in biotechnology in terms of new firms, venture capital and patents, after the US and ahead of the UK (Niosi, 2005). Metrics such as R&D spending, market capitalization as well as total number of firms and revenues all showed strong growth over the five years preceding 2002 (Ernst and Young 2002). It is however evident from Figure 2 that after the peak in 2001-2002 the number of biotechnology patents invented or co-invented by Canadians has been decreasing. In the recent survey of Statistics Canada (2007) it was found that the number of innovative biotechnology firms increased only by 9% in the period of 2003-2005, whereas it increased by 31% between 2001 and 2003. Niosi (2006) noted that in recent years (particularly since 2000), Canadian biotechnology companies have experienced financing problems and even some of the well-financed firms have abandoned the field altogether. He suggests that the new trend of Canadian biotechnology is directed towards concentration of activity into a small number of dedicated biotechnology companies.
(Insert Figure 2 here) (Insert Figure 3 here)
Figure 3 confirms the diminishing activity in biotechnology innovation by slightly decreasing tendency of the average number of granted patents per inventor after the peak in 2002. In the light of this evolution it is interesting to note that even though the average number of patents per inventor has decreased in the latest years, the average degree of a vertex in the
subnetworks still maintains its increasing trend. This suggests that an average inventor has a tendency to collaborate on a lower number of patents with increasingly more inventors. This could mean that the projects an average inventor works on have become increasingly more complex and require expertise from more specializations. The projects consequently involve more collaborators and the patents end up being registered in the name of more co-inventors than previously. Another explanation is that the collaborations between the partners became less repetitive, i.e. an average inventor collaborates with different collaborators than previously or changes his collaborators more often than before. A possible reason for that might be his more rapidly changing needs for different kinds of knowledge. Further insights are necessary in order to understand the dynamics of the collaboration in Canadian biotechnology.
The next step is to explore the evolution of the occurrence of the phenomenon of the star scientist in Canadian biotechnology. Figure 4 and Figure 5 show the development of the numbers of star and QQ-star scientists in Canadian biotechnology sector. Figure 4 shows that the total number of stars and QQ-stars was steadily raising during the first 15 years of our observation period, whereas in the last 5 years the absolute numbers of active stars and QQ-stars have not changed much. Consequently, the share of stars and QQ-stars in the total number of inventors has been decreasing or stagnating during the last decade (see Figure 5). Both trends are observable for highly cited scientists as well, even though in smaller scale. This development might be related to the general decreasing trend in biotechnology innovation in Canada observed in Figure 2, but it may also suggest that the network has reached a certain critical mass of highly central inventors (stars or QQ-stars), which is sufficient for the smooth knowledge transmission and efficient communication in the network.
In order to better understand the role of the most prominent biotechnology inventors within the innovation network we measured network centralization and followed the dynamics of this indicator as well. A highly centralized network has a clear boundary between the center (central inventors) and the periphery (other inventors). Inventors in more central network positions (inventors with higher values of centrality) have more potential sources of scientific knowledge at their disposal and better opportunities to spread information further. This makes them important for the transmission of information through the network. Centralization of a network is defined as the variation in the centrality of vertices, divided by the maximum degree variation which is possible in a network of the same size (de Nooy et al., 2004). There are two main indicators of network centralization which could be measured in disconnected networks: degree centralization and betweenness centralization. Degree centralization of a network is based on the variation in degree centrality of vertices in the network, whereas betweenness centralization of a network is based on the variation in their betweenness centrality.
(Insert Figure 6 here) (Insert Figure 7 here)
Figure 6 and Figure 7 show the evolution of both indicators of centralization. Even though both measures fluctuate significantly, they have fairly observable tendencies. The indicator of degree centralization shows that the network might have become slightly more centralized over time, meaning that the star and QQ-star scientists only mildly improve their access to knowledge in the network through slightly increasingly higher numbers of collaborators. However, it is a decreasing tendency which is observable in the indicator of betweenness centralization. This means that star and QQ-star scientists do not seem to gain more strategic positions and to assume increasingly more control over a greater flow of information in the network. In general it could be stated that more central inventors have not become more central over time.
This development is somewhat reminiscent of the one we observed in nanotechnology. However, the nanotechnology sector experiences gradual network decentralization due to an increasing specialization of the field. A few highly central nanotechnology inventors are slowly disappearing and more inventors in less central positions within numerous nanotechnology specializations emerge (Schiffauerova and Beaudry, 2009b). This is not the case of biotechnology and the results we obtained for biotechnology sector are thus rather surprising. We have expected that in the generally rapidly expanding network (at least first 15 years) such as the one of biotechnology innovation, the central inventors will be gaining unproportionally more connections than others over time and thus will become more central over time. The fact that the inventors in the transmission centre of the biotechnology subnetworks (stars and QQ-stars) are becoming slightly less central with time raises a question of the importance of the centralized network structure and the role of the star and QQ-star scientists in the information transmission efficiency. Could decreasing centralization in fact mean that the star and QQ-star scientists are gradually getting less important for the effective knowledge flows? Further research is needed to answer this question.
5. Conclusions
This paper studies innovation in Canadian biotechnology clusters. Drawing from the lists of inventions from the USPTO website, we have created a complete database of all registered patents in biotechnology, for which at least one inventor or co-inventor resides in Canada. We determined the greatest concentrations of biotech activity and identified 12 Canadian biotechnology clusters. The first objective of this work was the identification of the prominent researchers in Canadian biotechnology clusters. We proposed to take into consideration the
patent quality when identifying the prolific inventors, and developed a measure which includes both the patent count and the patent value in the equation. We observed that star scientists or highly prolific biotechnology inventors do not necessarily author or co-author patents of the highest value. Furthermore, we have also identified the scientists whose publications are the most highly cited. We discovered that not all the prominent researchers and superior scientists in biotechnology produce patents or register them at the USPTO. We offered an explanation based on the differences in the reward systems in academic and industrial environments.
In the second part we have studied the positions of the stars and QQ-stars in the network structure. Our results show that the inventors with higher number of patents and the higher QQ
Index assume more central positions in the network: they have more collaborators, they enjoy
better access to information because of the reduced shortest paths to all the other inventors in the network and they also have greater control over the knowledge flows in the network since much more information passes through them. Nevertheless, we did not confirm our hypothesis regarding the level of cliquishness in the inventor’s neighbourhood: The inventors with a higher number of patents or levels of QQ Index do not assume the network positions with a higher level of the local cliquishness. The impact of cliquishness of individual inventors on their innovative propensity has not been empirically studied so far and the existing research regarding the innovative performance of the networks with various degrees of cliquishness has not been conclusive. The very weak negative correlation however makes us lean towards the view that there may in fact be also negative effects of high cliquishness on knowledge growth as was proposed by Cowan and Jonard (2003) and empirically supported by Fleming et al. (2006).
Finally, we investigated the relationship between the stars or QQ-stars and the gatekeepers. We found that the great majority of star inventors (86%) and of QQ-star inventors (55%), and
almost half of all the highly cited scientists (49%) are also gatekeepers responsible for the inflow of external knowledge which highly contributes to the Canadian innovative potential. However, we observed that it is only the number of patents but not the quality of these patents, which is related to the ability of the inventor to acquire external knowledge and to nurture the clusters with information from outside. Star scientists with their usually abundant connections outside and inside clusters are thus best equipped to play the gatekeeping role in the network.
The last section of the article involved an exploration of the evolution of the innovation network structure of Canadian biotechnology sector. We have shown that after the phenomenal growth evidenced by the steeply increasing annual numbers of patents during the Canadian biotechnology peak years (2000-2004), the number of biotechnology patents invented or co-invented by Canadians has been decreasing. Also, both absolute and relative numbers of stars and QQ-stars have been stagnating for last 8-10 years. It was suggested that this development might be related to the general decreasing trend in biotechnology innovation in Canada, or that the network has reached a certain critical mass of highly central inventors (stars or QQ-stars), which is sufficient for the smooth knowledge transmission and efficient communication. Moreover, we observed that the inventors in the transmission centre of the networks (stars and
QQ-stars) are becoming slightly less central with time. This raised the question of the
importance of the centralized network structure for the effective knowledge flows and the role of the star scientists in the information transmission efficiency.
This paper is yet another step towards the understanding of the influence of knowledge networks on the innovative activities of firms located within high technology clusters. We intend to continue exploring the exact role played by networks and their importance in the chain of knowledge creation. One avenue for future research is to gather information about the affiliation
for each star scientist and gatekeeper in order to better understand from which environment they arise: academics, industrial or governmental inventors. Moreover, we plan to include the networks arising from cooperation on the scientific articles in the overall network of innovators. This will allow us to study the influence of the nature and the structure of the networks of various innovators (i.e. inventors and scientists) on the propensity to innovate of firms in clusters. We also intend to merge the database of the inventors (patents) and the database of the scientists (articles) to gain a full picture of the innovation production in Canadian biotechnology.
References
Cowan, R. and Jonard, N. (2003). The dynamics of collective invention. Journal of Economic Behaviour and Organization, 52, 513-532.
de Nooy, W., Mrvar, A. and Batagelj, A. (2005). Exploratory Social Network Analysis with Pajek. Cambridge: Cambridge University Press
Ernst and Young (2002). Beyond Borders: The Canadian Biotechnology Report 2002, Toronto. Fleming, L., King, C.IV., and Juda, A. (2006). Small worlds and innovation. SSRN Working Papers.
Furukawa, R. & Goto, A. (2006). The role of corporate scientists in innovation, Research Policy, 35, 24-36.
Gambardella, A., Harhoff, D. and Verspagen, B.(2008), The value of European patents,
European Management Review, 5, 69–84
Lanjouw, J.O. and Schankerman, M. (2004). Patent Quality and Research Productivity: Measuring Innovation with Multiple Indicators. The Economic Journal, 114 (April), 441–465.
Niosi, J. (2003). Alliances are not enough explaining rapid growth in biotechnology firms.
Research Policy, 32, 737-750.
Niosi, J. (2005). Canada’s Regional Innovation Systems. The Science-based Industries. McGill-Queen’s University Press
Niosi, J. (2006). Success factors in Canadian academic spin-offs. Journal of Technology Transfer, 31, 451–457.
Queenton, J and Niosi, J. (2003). Bioscientists and biotechnology: A Canadian study, 3rd
European Meeting on Applied evolutionary Economics, Augsburg, Germany
Schiffauerova, A. and Beaudry, C. (2009a). Interaction between geographical and technological spaces of collaboration: The gatekeepers of Canadian biotechnology clusters. Journal of
Engineering Management and Technology, forthcoming
Schiffauerova, A. and Beaudry, C. (2009b). “Co-inventorship network indicators in Canadian nanotechnology”, Industry and Innovation, submitted
Schilling, M.A. and Phelps, C.C. (2007). The impact of large-scale network structure on firm innovation. Management Science, 53, 7, 1113-1126
Statistics Canada (2005). Overview of the Biotechnology Use and Development Survey -2003. Available on line: (http://www.statcan.ca/english/research/88F0006XIE/88F0006XIE2005009.pdf)
Statistics Canada (2007). Preliminary Results of the Biotechnology Use and Development Survey -2005. Available on line: (http://www.statcan.ca/Daily/English/070130/d070130c.htm)
Tong, X. & Frame, J.D. (1994). Measuring national technological performance with patent claims data. Research Policy, 23,133-141
Uzzi, B. and Spiro, J. (2005). Collaboration and creativity: The small world problem. American Journal of Sociology, 111(2 ), 447-504.
van Zeebroeck, N. & van Pottelsberghe de la Potterie, B. (2006). Filing strategies and patent value. Solvay Business School, Working papers CEB
Wasserman, S. and Faust, K. (1994). Social network analysis. Cambridge: Cambridge University Press.
Zucker, L.M. and Brewer, M. (1994). Intellectual capital and the birth of US biotechnology enterprises. NBER Working Papers, 4653.
Zucker, L.G. and Darby, M.R. (1996a). Costly information: Firm transformation, exit pr persistent failure. American Behavioral Scientist, 39, 959-974.
Zucker, L.G. and Darby, M.R. (1996b) Star scientists and institutional transformation: Patterns of invention and innovation in the formation of the biotechnology industry. Proceedings of the
National Academy of Sciences, 93, 12709-12716.
Zucker, L.G., Darby, M.R., and Brewer, M.B. (1996). Collaboration Structure and Innovation Dilemmas in Biotechnology. In: R.M.T.T.R. Kramer (Ed.), Trust in Organizations (pp. 90-113). Thousand Oaks, California: Sage.
Zucker, L.G., Darby, M.R. and Armstrong, J. (1998a). Geographically localized knowledge: Spillovers or markets? Economic Inquiry, 36(1), 65-86.
Zucker, L.G., Darby, M.R. and Brewer, M. (1998b). Intellectual human capital and the birth of US biotechnology enterprises. American Economic Review, 88, 290-306.
Figure 1: Distribution of the number of patents authored or co-authored by each inventor 0 20 40 60 80 100 120 140 160 0 1000 2000 3000 4000 5000 Inventors N um be r of pa te nts 0 500 1000 1500 2000 2500 3000 87 ‐91 88 ‐92 89 ‐93 90 ‐94 91 ‐95 92 ‐96 93 ‐97 94 ‐98 95 ‐99 96 ‐00 97 ‐01 98 ‐02 99 ‐03 00 ‐04 01 ‐05 02 ‐06 Number of inventors Number of patents 0 0.5 1 1.5 2 2.5 3 3.5 4 4.5 5 87 ‐91 88 ‐92 89 ‐93 90 ‐94 91 ‐95 92 ‐96 93 ‐97 94 ‐98 95 ‐99 96 ‐00 97 ‐01 98 ‐02 99 ‐03 00 ‐04 01 ‐05 02 ‐06 Average number of patents Average degree of a node
Figure 2: Number of patents and number of inventors
in each interval Figure 3: Average degree of a vertex and average number of patents produced or co-produced per inventor in each interval
0 10 20 30 40 50 60 87 ‐91 88 ‐92 89 ‐93 90 ‐94 91 ‐95 92 ‐96 93 ‐97 94 ‐98 95 ‐99 96 ‐00 97 ‐01 98 ‐02 99 ‐03 00 ‐04 01 ‐05 02 ‐06 Stars and prolific inventors QQ stars and QQ prolific inventors Highly cited inventors 0.0% 0.5% 1.0% 1.5% 2.0% 2.5% 3.0% 3.5% 4.0% 87 ‐91 88 ‐92 89 ‐93 90 ‐94 91 ‐95 92 ‐96 93 ‐97 94 ‐98 95 ‐99 96 ‐00 97 ‐01 98 ‐02 99 ‐03 00 ‐04 01 ‐05 02 ‐06 Stars and prolific inventors QQ stars and QQ prolific inventors Highly cited inventors
Figure 4: Number of inventors which are stars (or prolific), QQ stars (or QQ prolific) and highly cited scientists in each period
Figure 5: Share of inventors which are stars (or prolific), QQ stars (or QQ prolific) and highly cited scientists in each period
0 0.005 0.01 0.015 0.02 0.025 0.03 87 ‐91 88 ‐92 89 ‐93 90 ‐94 91 ‐95 92 ‐96 93 ‐97 94 ‐98 95 ‐99 96 ‐00 97 ‐01 98 ‐02 99 ‐03 00 ‐04 01 ‐05 02 ‐06 0 0.0001 0.0002 0.0003 0.0004 0.0005 0.0006 0.0007 0.0008 0.0009 0.001 87 ‐91 88 ‐92 89 ‐93 90 ‐94 91 ‐95 92 ‐96 93 ‐97 94 ‐98 95 ‐99 96 ‐00 97 ‐01 98 ‐02 99 ‐03 00 ‐04 01 ‐05 02 ‐06
Figure 6: Evolution of degree centralization of