olds boost mothers’ employment rate ?
Panel data based evidence from Belgium
Claire Dujardin
1Muriel Fonder
2Bernard Lejeune
3July 2015
Abstract
In 2003, a new multi-annual program aimed at increasing the availability of formal child care for 0-3 year old children was launched in Wallonia, the French-speaking part of Bel-gium. This paper is interested in evaluating if this increased availability of formal child care resulted in a higher employment rate for women with at least one child under 3. To this end, we use a difference-in-differences approach based on municipality-level panel data, tak-ing advantage of the fact that the increase in availability of formal child care differed greatly across municipalities. We find that the raise in child care availability significantly increased the maternal employment rate, but to a lesser extent than expected, most likely because of a substantial crowding-out effect.
Keywords: Child care, maternal employment, difference-in-differences, random trend model. JEL. classification: J13, J21.
1IWEPS, Route de Louvain-la-Neuve, 2, 5001 Namur, Belgium. Email : c.dujardin@iweps.be
2IWEPS and UCL, Route de Louvain-la-Neuve, 2, 5001 Namur, Belgium. Email : m.fonder@iweps.be 3HEC-University of Liège, Bd du Rectorat, 7, B31, 4000 Liège, Belgium. Email: b.lejeune@ulg.ac.be
The authors are grateful to Mathieu Mosty and Sile O’Dorchai for several suggestions, which materially improved the paper. Errors, of course, remain our sole responsibility.
1. Introduction
Despite significant progress in female labour force participation over the past decades, substantial gender differences remain. As demonstrated by Angrist and Evans (1998), and Moschion (2009) based on French data, one of the explanations for the lower female employment rate is the presence of children. In Belgium, according to the OECD family database 2014, the gender gap in employment rate is 10.9 percentage points. While the difference between the female employment rate and the maternal one is rather small compared to other OECD countries (73.8% and 70.6%, respectively), the maternal employment rate decreases drastically in the presence of children under 3 (62.1%).
Many factors such as education, labour market conditions or cultural idiosyn-crasies influence maternal employment. Besides these factors, public policies are also important : tax policy, child benefits, paid leave, child care, etc. As a matter of fact, from studies based on international comparisons across European or OECD countries (see for example Gornick et al. (1997, 1998), Jaumotte (2003), Stadelmann-Steffen (2008), De Henau et al. (2010)), a consensus seems to emerge on the crucial role of family policies, and more specifically on the role played by the provision of formal child care.
In accordance with this state of the art, in 2002 the European Union recom-mended “to provide child care by 2010 to at least 90% of children between 3 years old and the mandatory school age, and at least 33% of children under 3 years of age”. Following this recommendation, from 2003 onwards, the public agency in charge of formal child care in Wallonia — the French speaking part of Belgium — strongly in-creased the availability of formal child care places for children under 3. Nothing basically changed for children between 3 and the mandatory school age since, in Belgium, more than 90% of those children already attend preschool.
The purpose of this paper is to evaluate if this increased availability of formal child care in Wallonia resulted in a higher employment rate for women with at least one child under 3 years old. To this end, we use a difference-in-differences approach based on municipality-level panel data, taking advantage of the fact that the increased availability of formal child care differed greatly across municipalities.
This paper contributes to the literature investigating the effect of the availa-bility and/or affordaavaila-bility of formal child care on maternal employment, based on the analysis of policy changes that create time and/or regional variations in the access to and/or price of child care (see among others Gelbach (2002), Schlosser (2005), Berlinski and Galiani (2007), Baker et al. (2008), Lefebvre and Merrigan (2008), Lundin et al. (2008), Casio (2009), Fitzpatrick (2010), Goux and Maurin (2010), Simonsen (2010), Havnes and Mogstad (2011), Nollenberger and Rodrigez-Planas (2011), Hardoy and Schøne (2013), Bauernschuster and Schlotter (2015)). This literature, which mostly relies on difference-in-differences methods, has so far produced mixed results : some studies have found little effect (e.g., Havnes and Mogstad (2011)), while others have found relatively large effects (e.g., Bauernschus-ter and SchlotBauernschus-ter (2015)). This is not really surprising as both the institutional backgrounds and the details of the policy changes analyzed in the different studies are very heterogeneous.
Most of the above mentioned papers deal with child care for children between 3 and 5 years old. Along with Goux and Maurin (2010), Simonsen (2010), Nollenberger and Rodrigez-Planas (2011), and Hardoy and Schøne (2013), this paper is one of the few available studies of this literature focusing specifically on formal child care for children under 3 years old. As far as we know, besides Vanleenhove (2013) who relies on simulations from an estimated structural labour supply model, it is the first policy evaluation study on the basis of Belgian data of the effect of child care on maternal employment.
In a nutshell, we find that the raise in child care availability significantly in-creased the maternal employment rate, but to a lesser extent than expected, most likely because of a substantial crowding-out effect.
The rest of the paper is organized as follows. Section 2 describes the institutional background of formal child care in Wallonia and the policy change that occurred in 2003. Section 3 discusses our empirical strategy. Section 4 describes the data. The results are presented in Section 5. Finally, Section 6 concludes.
2. Formal child care in Wallonia
2.1. Institutional background
In Wallonia1, the responsibility for formal child care — as opposed to informal
child care such as child care provided by other members of the family or the shadow economy — falls under the auspices of ONE (Office de la Naissance et de l’Enfance, i.e., Birth and Children’s Office), a public agency.
Formal child care services can be grouped into two broad categories : family care, provided by childminders at their private home, and collective care, mainly provided by day care centers.
Regardless of its type, each formal child care service has to be authorized by ONE. In order to be authorized, the care providers have to fulfill a number of conditions concerning dimensions of rooms and equipments, the child staff ratio, staff level of education and continuous training, medical follow-up for children, etc. The exact conditions depend on the type of the service. For example, the child staff ratio may at most be 4 to 1 for family care services, and 7 to 1 in collective care services (in this latter case, other adults such as nurses or social assistants may also be required).
The majority of child care services are subsidized by ONE. In order to be subsi-dized, services need to be accredited. This implies that besides being authorized, the child care service has to fulfill additional conditions. These conditions are mainly twofold : (a) in order to be accessible to working parents, the service must be opened at least 10 hours a day and 220 days a year, and (b) in order to guarantee finan-cial affordability, the day fee paid by parents must follow an income-dependent grid
1with the exception of nine municipalities belonging to its small German-speaking Community (about
defined by ONE (the higher the household’s income, the higher the daily fee)2.
Subsidies by ONE are not the only source of public funding of formal child care services. Child care services may also (jointly or separately) benefit from the employment subsidies granted by the Walloon government and designed to help the non-profit sector, as well as from municipal grants.
On average, the parental fees are lower in child care services subsidized by ONE than in non-subsidized ones, but it is worth noting that some of the non-subsidized services also apply the income-dependent grid defined by ONE.
2.2. Policy change
As already outlined, the European Union recommended in 2002 “to provide child care by 2010 to at least 90% of children between 3 years old and the mandatory school age, and at least 33% of children under 3 years of age”.
ONE monitors the availability of child care services by computing a “coverage rate” defined as the ratio of the number of available child care places to the number of children aged between 0 and 2.5 years old. The rationale for considering 0-2.5 year old children in the denominator is to approximate the number of children who potentially need child care services. It rests on the fact that, in Belgium, children usually enter child care services between 0 and 6 months and (pre-) school between 2.5 and 3 years.
According to this ONE indicator, in 2003, 20,933 places were available in Wallo-nia for 93,524 children, which represented a coverage rate of 22.4 %. It thus appeared that the fulfillment of the European Union objective required the creation of about 10,000 places, without taking into account a potential increase in birth rates.
In order to increase the number of available child care places, additional bud-getary means were allocated to ONE. Thanks to these additional resources, in 2003 ONE launched a multi-annual program based on calls for projects. Projects were mainly submitted by various non-profit organizations and municipalities. They could consist of extensions of already existing child care services or the creation of new ones, with or without an infrastructure component. Projects were selected on the basis of a large number of indicators at the municipality level (18-45 female employ-ment rate, birth rate, existing coverage rate, proportion of low educated women, median income, unemployment rate, etc...), in order to promote a more universal access as well as to positively discriminate poor municipalities. At the same time, the Walloon government increased its employment and infrastructure related subsidies to the sector.
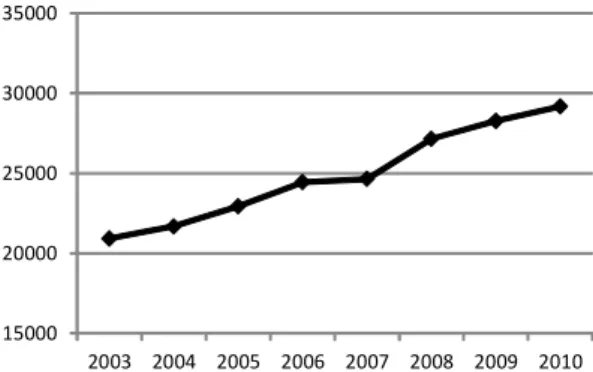
Overall, this multi-annual program has induced a strong opening of places. In 2010, some of the selected projects were not effective yet but nevertheless the target in terms of places was almost reached : 29,178 places were available in Wallonia, which represented 8,245 new places (+39.4 %) compared with the 20,933 places
already available in 2003. 15000 20000 25000 30000 35000 2003 2004 2005 2006 2007 2008 2009 2010
Figure 1 : Number of child care places in Wallonia
Due to an increase in birth rates over the same period, it induced a somewhat lower increase (+30%) of the coverage rate, which reached 29.2% in 2010, compared with 22.4% in 2003.
Whereas the increase in formal child care availability has been substantial in Wallonia, it has not been geographically homogeneous : some municipalities experi-enced a much larger increase in their coverage rate than the average (up to +136 %), while a few municipalities actually saw their coverage rate slightly decrease (up to -1%).
It is worth noting that during the same period parental fees as defined by ONE’s income-dependent grid did not change (besides usual indexation). The policy change thus focussed on an increase in the availability of child care, without changing its financial affordability. Its primary goal was basically to work against the severe rationing (through waiting lists) of the demand for child care.
To conclude on this section, a last remark. In 2002, when the European Union recommended “to provide child care by 2010 to at least 90% of children between 3 years old and the mandatory school age, and at least 33% of children under 3 years of age”, no exact indicators were defined to guide the European member states in checking whether or not they complied with the objectives. Regarding children under 3, as outlined above, the ONE indicator was used, and it appeared that Wallonia did not reach the 33% target. A harmonized indicator was finally defined by the European Union in 2004. This indicator strongly differs from the
ONE indicator3. As a matter of fact, when the ONE first computed the European
harmonized indicator for Wallonia in 2009, it turned out to be equal to 48.3 %, i.e., largely in excess of the European objective. There is little doubt this was already
the case in 20034. To reach the European target was not the only argument when it
was decided to boost the availably of formal child care : there was already a strong consensus that the supply of child care services was (and still is) insufficient. Along
3On one hand, at the denominator, it includes all children aged between 0 and 3 years old (instead of
between 0 and 2.5 years old). On the other hand, at the numerator, it includes both child care and preschool (instead of child care only) and it counts the number of registered children (instead of the number of places) between 0 and 3 years old. Both the inclusion of preschool (in Belgium, more than 90% of children attend preschool) and the counting of registered children (as children may attend child care less than full time, a place may, on average, be occupied by more than one child) make a strong difference.
4The exact figure is not available for Wallonia, but for Belgium as a whole, when first computed
with the availability of new budgets5, the European objective nevertheless acted as
a catalyst. Be that as it may, retrospectively, from the European recommendation point of view, the fact is that there was actually no need to boost the formal child care availability for children under 3 in Wallonia.
3. Empirical strategy
We are interested in evaluating the effect of the increased availability of formal child care for children under 3 in Wallonia on mother’s employment rate of their . To this end, we use a difference-in-differences approach based on municipality-level panel data, exploiting the fact that the increased availability of formal child care widely varied across municipalities.
3.1. Model
Let yit denote the employment rate of women with at least one child under 3 in
municipality i at period t. For the sake of the argument, suppose that only two years (t = 1, 2) are observed and that the policy change between these two years has been such that the coverage rate (number of child care places per child) increased in some municipalities, while others remained unaffected. In other words, at period t = 2, some municipalities got ‘treated’, while others did not. Under these circumstances, a standard way to evaluate the effect of the increased availability in formal child care would be to use the difference-in-differences estimator :
ˆδ = ¯ytreat .2 − ¯y treat .1 − ¯y control .2 − ¯y control .1 . (1)
Using this difference-in-differences approach means estimating the effect of child care availability by the variation in the average maternal employment rate (= ¯ytreat
.2 − ¯y treat
.1 ) observed in the municipalities where the coverage rate increased
(= treatment group) minus the variation in the average maternal employment rate = ¯ycontrol
.2 − ¯y
control
.1 in the municipalities where the coverage rate did not change
(= control group), the latter difference accounting for what would have supposedly happened in the municipalities where the coverage rate increased in case no policy change had occurred.
As well known, the difference-in-differences estimator (1) may be obtained as the fixed effects (FE) or the first difference (FD) estimator of δ in the panel data
regression model6:
yit= ci+ γd2t+ δDit+ εit, i = 1, ..., N ; t = 1, 2, (2)
where ciis a municipality-specific effect, d2tis a time dummy equal to one if t = 2 and
zero otherwise, and Dit is a binary variable such that Di1= 0 for all municipalities,
5In 2000 - 2001, a reform which gradually transferred financial resources from the federal government to
the local governments was voted.
6See Wooldridge (2010, chapter 10), or Cameron and Trivedi (2005, chapter 22). Angrist and Pischke
(2009, chapter 5) is also a useful reference. Note that the equality of the FE and FD estimator holds because there is only two periods.
and in period t = 2, Di2= 1 for the municipalities where the coverage rate increased
and Di2 = 0 for the municipalities where it remained unchanged.
The panel data difference-in-differences regression model (2) can be easily mod-ified to accommodate situations beyond the standard binary treatment/two periods case. In our case, several years are observed, and the treatment — the availability of formal child care — is continuous rather than binary. Allowing for more years of observation can simply be accommodated by introducing a full set of time dummies. Allowing for a continuous treatment is also straightforward : just replace the binary
treatment with a variable measuring the intensity of the treatment. Let zit denote
the coverage rate in municipality i at period t, and dTt a time dummy equal to one
if t = T and zero otherwise. The model becomes :
yit = ci+ γ2d2t+ ... + γTdTt+ δzit+ εit, i = 1, ..., N ; t = 1, ..., T. (3)
Model (3) includes the same ingredients as the standard model (2) :
munici-pality-specific effects ci which may be correlated with the (intensity of the)
treat-ment, a common time trend capturing how the maternal employment rate would have evolved through time if there was no (constant intensity of) treatment, and a variable indicating the (intensity of the) treatment received, the coefficient of which is the parameter of interest. It may similarly be interpreted as a difference-in-differences model where each unit — the municipalities — is no longer either treated or not treated, but is put somewhere on a continuum of treatment, possibly including no (constant intensity of) treatment for some or all periods.
The common time trend — a key assumption in the difference-in-differences ap-proach — assumed in Model (3) is somewhat restrictive : it supposes that the ma-ternal employment rates would have evolved through time in the same way in all municipalities if there was no change in the availability of formal child care. It can be relaxed first by allowing the time trend to be different across (a necessarily
limited number S of) sub-regions, in our case across provinces7. It can be further
relaxed by allowing for municipality-specific time trend effects, yielding the so-called
random trend model8:
yit = ci+ git + S s=1 dsi(γ3sd3t+ ... + γT sdTt) + δzit+ εit, i = 1, ..., N, t = 1, ..., T. (4)
where git is a municipality-specific time trend and dsi is a dummy equal to one if
municipality i belongs to sub-region s and zero otherwise. The joint introduction of sub-region/time dummies and municipality-specific time trends in Model (4) allows the evolution over time of the maternal employment rates to fully differ across sub-regions, as well as partially differ across municipalities within each sub-region, instead of being supposed identical in all municipalities. On the one hand, the sub-region/time dummies are designed to account for possibly different economic conditions across sub-regions. On the other hand, along with the
municipality-specific effects ci, the municipality-specific time trends are primarily specified to
account for differences in the composition of the population across municipalities,
7Wallonia is composed of five provinces (see Figure 3 in Section 4 below). 8See Wooldridge (2010, chapter 11).
as such differences may not only imply differences in the level but also in the trend of employment rates.
We saw above that the increase in the availability of formal child care in Wal-lonia took place as a result of the adoption of a multi-annual program, that called for projects that were selected on the basis of indicators at the municipality level. Because the selection of the projects was based on the municipality’s
characteris-tics, in Model (4), the coverage rate zit may be expected to be correlated with both
ci and gi. On the other hand, because it resulted from the adoption of a
multi-annual program, it may reasonably be assumed that the coverage rate zit is not
systematically related to other factors than those captured by (ci, gi) that influence
the maternal employment rate yit (and that are left in εit). This is because in the
context of a multi-annual program, the actual timing of the availability of the new
child care places is essentially the result of an administrative process9. Under this
assumption, the coverage rate zit may be considered as exogenous conditional on
(ci, gi) and Model (4) may be viewed as a causal model.
3.2. Estimation
Following Wooldridge (2010, chapter 11), let us rewrite Model (4) as :
yit = wtai+ xitβ + εit, i = 1, ..., N; t = 1, ..., T, (5)
where wt= (1, t)′, ai = (ci, gi), xit is a row vector including the coverage rate zitand
all the sub-region/time dummies, and β a column vector of parameters composed of
δ and all the γts. Stacking the T observations of each municipality, we can write :
Yi = W ai+ Xiβ + εi, i = 1, ..., N. (6)
We can get rid of the unobserved (and possibly correlated with Xi)
municipality-specific effect and time trend ai by premultiplying equation (6) by the T × T
trans-formation matrix M = IT − W (W′W )−1W′. Noting that MW = 0, this yields the
transformed model :
¨
Yi = ¨Xiβ + ¨εi, i = 1, ..., N, (7)
where ¨Yi = M Yi, ¨Xi = MXi and ¨εi = Mεi. The transformation matrix M is
just a generalization of the usual fixed effects (or within) transformation : instead of yielding data in deviation from their individual-specific mean, it yields data in deviation from their individual-specific level and trend. Note that this requires that at least three periods of observation are available (T ≥ 3).
Under the strict exogeneity assumption E(εi|Xi, ai) = 0, i = 1, ..., N , Model (7)
can be consistently estimated by pooled OLS (N → ∞, T fixed). This estimator is just a generalization of the usual fixed effects (FE) estimator and its asymptotic variance-covariance matrix may likewise be estimated using a robust estimator.
Following the approach underlying the fixed effects generalized least squares (FEGLS) estimator considered in Wooldridge (2010, chapter 10), a generally more
9It depends on the pace at which the budgets are available, the time needed to extent or build new
efficient estimator may be obtained by taking into account — at least approximately
— the second order moments of εi. In the present case, the idiosyncratic error εit
may be expected to be both serially correlated and heteroscedastic, with a variance
inversely proportional to the number ni of women with at least one child under 3 in
municipality i10. This suggests considering for the variance-covariance of ε
i:
V (εi|Xi, ai) = hiΛ, i = 1, ..., N, (8)
where the hi are known positive constants equal to 1/ni and Λ is an unrestricted
T × T positive definite matrix. This specification is not assumed to be exact. It is simply intended to capture the most salient features of the second order moments of
εi, in the hope of getting, through GLS, a more efficient estimator than the outlined
above pooled OLS estimator.
Under assumption (8), we have :
V (¨εi| ¨Xi) = E(¨εi¨ε′i) = hiM ΛM, i = 1, ..., N, (9)
which has rank equal to T − 2. The deficient rank of (9) makes the usual approach to GLS inapplicable. As in the case of Wooldridge’s FEGLS estimator, the easiest way to bypass this problem is to drop two of the time periods from the analysis, say the first two time periods.
To avoid introducing new notations, we now let ¨Yi, ¨Xi and ¨εidenote, respectively,
the (T −2)×1 vector, the (T −2)×K matrix and the (T −2)×1 vector obtained after dropping the first two time periods from the transformed model (7). Accordingly
let V (¨εi| ¨Xi) be written as V (¨εi| ¨Xi) = E(¨εi¨ε′i) = hiΩ, where Ω is an unrestricted
(T − 2) × (T − 2) positive definite matrix11. A generalized version of Wooldridge’s
FEGLS estimator is given by : ˆ β = N i=1 1 hi ¨ X′ iΩˆ−1X¨i −1 N i=1 1 hi ¨ X′ iΩˆ−1Y¨i , (10)
where ˆΩ is a consistent estimator of Ω. Such an estimator is given by :
ˆ Ω = 1 N N i=1 1 hi ¨εi¨ε ′ i, (11)
where ¨εi denote the (T − 2) × 1 vector of residuals ¨εi = ¨Yi − ¨Xiβ, i = 1, ..., N ,˜
calculated using any first step consistent estimator ˜β of β, for example the weighted
pooled OLS estimator obtained by replacing ˆΩ by an identity matrix in (10). A
fully robust (to misspecification of (8)) variance-covariance matrix estimator for the
10The observed maternal employment rate y
it may be viewed as a sample frequency (the proportion of
working mothers) estimated at the municipality level, whose variance is accordingly inversely proportional to the mother’s population size of the municipality. In our dataset, municipality size varies by a factor as large as 75. It is thus important to take it into account.
generalized FEGLS estimator ˆβ is given by : V (ˆβ) = N i=1 1 hi ¨ X′ iΩˆ−1X¨i −1 N i=1 1 h2 i ¨ X′ iΩˆ−1¨εi¨ε ′ iΩˆ−1X¨i N i=1 1 hi ¨ X′ iΩˆ−1X¨i −1 ,
where ¨εi stands for the (T − 2) × 1 vector of generalized FEGLS residuals ¨εi =
¨
Yi− ¨Xiβ, i = 1, ..., N.ˆ
4. Data
This study relies on data from administrative sources. The municipality-level employment rates come from the Crossroads Bank for Social Security (CBSS), a public agency gathering administrative data on social security (employment, welfare, invalidity, retirement, etc.) for all Belgian residents. With the CBSS database, it is possible to compute, for each Walloon municipality, the employment rate of 18-49 year old women with at least one child under 3. The employment rate for year t refers to the employment situation at the end of the year (December, 31).
Employment data were originally collected for the 2003-2009 period. However, it turned out that there was a break in the series in 2004, due to a definitional change. Our analysis is therefore restrained to the 2005-2009 period. Due to privacy laws, we had to regroup the smallest municipalities with their neighboring municipality. Also, one municipality has been excluded from the analysis because it is geographically isolated (no joint frontier with any other Walloon municipality). As a result, out of 253 municipalities, we finally ended up with observations on 235 distinct entities, that we will hereafter continue to call municipalities for simplicity.
The municipality-level coverage rates come from ONE and Statistics Belgium, the public agency that manages the National Register database. For each Walloon municipality and each year from 2003 to 2010, ONE provided the number of autho-rized child care places and Statistics Belgium the number of children aged between 0 to 2.5 years. The ratio defines the standard ONE coverage rate intended to measure
the availability of formal child care12. As for the employment rate, data for year t
refers to the situation at the end of the year (December, 31).
It is rather unrealistic to assume that when parents are looking for child care services, they only consider services located in their municipality of residence. It is more plausible that they look for available services in a wider area. Accordingly, hereafer in our analysis, the coverage rate of a municipality is defined as the coverage rate (number of child care places per child) over an enlarged area, comprising the considered municipality and its surrounding (contiguous) municipalities.
12As a reminder, the rationale for considering 0-2.5 years old children in the denominator is to
Figure 2 depicts the aggregate child care coverage rate and employment rate of women with at least one child under age 3 for Wallonia as a whole over our 2005-2009 period of analysis. 23% 24% 25% 26% 27% 28% 29% 30% 2005 2006 2007 2008 2009 Coverage rate 55% 56% 57% 58% 59% 60% 2005 2006 2007 2008 2009 Employment rate Figure 2 : Child care coverage rate and employment rate of women
with at least one child under age 3 in Wallonia
From 2005 to 2009, the coverage rate increased from 24.17% to 28.53%. On the other hand, the employment rate of women with at least one child under age 3 increased from 55.80% to 58.77%, with virtually no change between 2008 and 2009, undoubtedly as a result of the 2008 financial crisis.
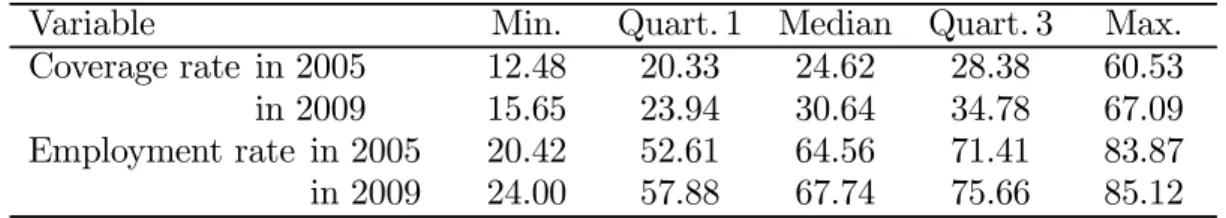
The aggregate child care coverage rate and women’s employment rate for Wallo-nia as a whole hide huge differences across municipalities. According to Table 1, the child care coverage rate varied across municipalities from 12,48% to 60,53% in 2005, and from 15.65% to 67.09% in 2009. Likewise, women’s employment rate varied across municipalities from 20.42% to 83.87% in 2005, and from 24.00% to 85.12% in 2009.
Table 1 : Child care coverage rate and employment rate of women with at least one child under age 3 across municipalities
Variable Min. Quart. 1 Median Quart. 3 Max.
Coverage rate in 2005 in 2009 12.48 15.65 20.33 23.94 24.62 30.64 28.38 34.78 60.53 67.09 Employment rate in 2005 in 2009 20.4224.00 52.6157.88 64.5667.74 71.4175.66 83.8785.12
Notes : The coverage and employment rates are in percentage. Observations from 235 municipalities.
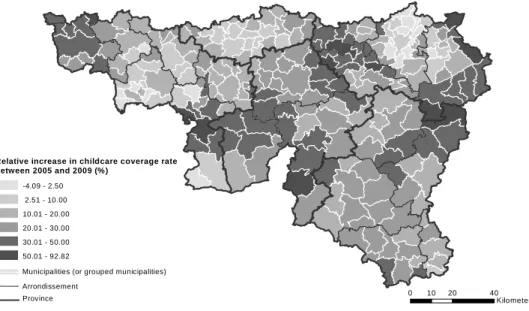
Also, the increase in the aggregate child care coverage rate between 2005 and 2009 for Wallonia as a whole — from 24.17% to 28.53%, that is to say +18.03% — hides large differences across municipalities. As illustrated by Figure 3, the relative increase in the coverage rate between 2005 and 2009 varied across municipalities from -4.09% to +92.82%. In other words, the change in availability of formal child care differs across municipalities from a slight decrease to an almost doubling over the 2005-2009 period.
0 10 20 40 Kilometers Source: authors' calculations based on data from ONE and Statistics Belgium
Relative increase in childcare coverage rate between 2005 and 2009 (% )
Municipalities (or grouped municipalities) Arrondissement Province -4.09 - 2.50 2.51 - 10.00 10.01 - 20.00 20.01 - 30.00 30.01 - 50.00 50.01 - 92.82
Figure 3 : Relative increase in child care coverage rate between 2005 and 2009 across municipalities
5. Results
5.1. Benchmark results
Table 2 reports the results of the generalized FEGLS estimation of Model (4) for 18-49 year old women with at least one child under 3. For comparison purposes, the results of the estimation of the same model for 18-49 year old men with at least one child under 3, as well as for 18-49 year old men and women without children, are
also reported13. For reasons of conciseness, only the estimated parameter of interest
δ and its standard error are reported. Table 2 : Benchmark results
Women with at Men with at Women Men
least one child least one child without without
Variable under age 3 under age 3 children children
Coverage rate 0.176∗∗∗ 0.019 0.005 0.023
(0.065) (0.049) (0.057) (0.051)
Notes : Generalized FEGLS estimates. 235 municipalities observed over 2005-2009. Robust standard errors in parentheses. Significance level : * = 10%, ** = 5% and *** = 1%.
As it may be seen, the availability of formal child care as measured by the cover-age rate is found to have a highly significant and positive effect on the employment
13The municipality-level employment rates for these three other categories were likewise obtained from
rate of mothers with at least one child under age 3. In contrast, the availability of formal child care appears to have no significant effect on the employment rate of fathers with at least one child under age 3, and likewise no significant effect on the employment rate of men and women without children. The absence of effect for men and women without children was of course expected : if a significant effect was found, it would have raised serious concerns about the relevance of our empirical strategy. On the other hand, the absence of effect for fathers with at least one child under age 3 is not very surprising : it simply corroborates the fact that there are still large gender differences with regard to child care.
According to Table 2, an increase of one percentage point in the coverage rate yields an increase of 0.176 percentage points in the employment rate of women with at least one child under 3. Because the ratio between the number of children aged 0 to 2.5 and the number of women with at least one child under age 3 is about equal to one, this means that when 100 new child care places are opened, about 18 additional women take up paid work. For comparison purposes, similar estimates of the percentage point increase in the maternal employment rate per percentage point increase in the child care coverage rate reported in the literature range from about 0.05 (Havnes and Mogstad (2011)) to about 0.30-0.35 (Nollenberger and Rodrigez-Planas (2011), Bauernschuster and Schlotter (2015)).
Tables 3 and 4 present some specification tests and sensitivity analysis allowing to assess the robustness of our estimated effect. Table 3 reports variable addition type tests intended to check, on the one hand, the linearity of the effect, and on the
other hand, the strict exogeneity — conditional on (ci, gi) — of the coverage rate.
Table 3 : Women with at least one child under age 3 Specification tests
Benchmark Alternative specifications
Variable model (1) (2) (3) (4)
Coverage rate 0.176∗∗∗ 0.164∗∗ 0.190∗∗∗ 0.184∗∗∗ 0.198∗∗
(0.065) (0.071) (0.065) (0.071) (0.078)
Squared coverage rate — 0.001 — — 0.001
(0.003) (0.003)
Lag of coverage rate — — 0.050 — 0.071
(0.065) (0.064)
Lead of coverage rate — — — 0.029 0.058
(0.074) (0.072)
Notes : The coverage rate is centered at the full sample mean. Generalized FEGLS estimates. 235 municipalities observed over 2005-2009. Robust standard errors in parentheses. Significance level : * = 10%, ** = 5% and *** = 1%.
The linearity of the effect may readily be tested by adding the squared coverage rate to the model. As it may be seen, there is no sign of non linearity, and in particular no sign that the marginal effect of the coverage rate decreases as the coverage rate itself increases, at least over the observed range of the coverage rate (reported in Table 1). In other words, an increase of the availability in formal child care has not only an effect when it is low, but also at higher absolute levels.
rate may be checked by adding one lead and one lag of the coverage rate to the
model14. The lag of the coverage rate allows to capture a possible lagged effect of
child care availability, while the lead of the coverage rate allows to check for the presence of any anticipation effect or any feedback effect of the current employment rate on the future coverage rate. The presence of any of these effects would jeopardize
the strict exogeneity — conditional on (ci, gi) — assumption on which relies the validity
of our generalized FEGLS estimator15. As it may be seen, there is no sign of any of
these effects.
Table 4 shows the sensitivity of the estimated effect of the coverage rate to some variations in our benchmark model. Table 4 first reports what happens when
(1) no municipality-specific time trend is included in the model (i.e., no git term
is included in Model (4)), and (2) the aggregate time trend of the model is not allowed to fully differ across provinces (i.e., the full set of sub-region/time dummies in Model (4) is replaced by a set of time dummies only). It appears that allowing for specific time trends is very important : without such municipality-specific time trends, the estimated effect is almost divided by two (from 0.176 to 0.096). On the other hand, not allowing for fully different aggregate time trends across provinces has a much lower impact on the estimated effect.
Table 4 : Women with at least one child under age 3 Sensitivity analysis
Coverage rate
Variation from benchmark model Parameter Std. error
(1) No municipality-specific time trend
0.096∗ 0.056
(2) No different aggregate trends across provinces
0.139∗∗ 0.058
(3) Coverage rate defined without surrounding municipalities
0.070∗∗∗ 0.026
(4) Coverage rate defined at the
level of arrondissements 0.203
∗∗ 0.102
(5) Municipalities with “extreme” coverage rate excluded
0.149∗∗ 0.072
(6) Municipalities with “extreme” employment rate excluded
0.191∗∗∗ 0.069
Notes : Generalized FEGLS estimates. 235 municipalities observed over 2005-2009, except (5) and (6) where 24 municipalities are excluded. Robust standard errors. Significance level : * = 10%, ** = 5% and *** = 1%.
Table 4 further shows how the estimated effect changes when (3) the coverage rate is not defined over an enlarged area comprising the considered municipality and its surrounding (contiguous) municipalities, but at the level of the considered municipality only, and (4) the coverage rate is defined over an even larger area, at the level of arrondissements, each made up of several municipalities (see the
14Thanks to the fact that the coverage rates were available for both 2004 and 2010, this could be
done without losing any time period for estimation.
15For a discussion on strict exogeneity in panel data models with unobserved individual effects, see
map in Figure 3). It may be seen that when only the municipality of residence is considered, the estimated effect is drastically reduced (from 0.176 to 0.070). This may be viewed as a consequence of the fact that the coverage rate defined at the level of the considered municipality only provides a rather bad measurement of the actual availability of formal child care : as we already argued, it is unrealistic to assume that when parents are looking for child care services, they only consider services located in their municipality of residence. Defining the coverage rate over an enlarged area is definitely a better — although still approximative — choice. Interestingly, it appears that the exact definition of this enlarged area is not critical : the estimated effect remains of the same magnitude regardless of whether the coverage rate is defined at the level of arrondissements or at the level of the considered municipalities plus their surrounding (contiguous) municipalities as in our benchmark model.
Table 4 finally reports what happens when (5) the municipalities with the 5% largest and 5% lowest coverage rates (in 2005) are excluded from the sample, and (6) the municipalities with the 5% largest and 5% lowest employment rates (in 2005) are likewise excluded from the sample. We saw in Section 4 that both the coverage rate and the employment rate tremendously vary across municipalities, exhibiting extreme minimum and maximum values (see Table 1). One might be concerned that the estimated effect is overly driven by these extreme values. However, this does not appear to be the case : the magnitude of the estimated effect is only marginally affected when the municipalities exhibiting these extreme values are excluded from the sample.
Overall, the results from Tables 3 and 4 suggest that our estimated effect of the availability of formal child care (as measured by the coverage rate) on the employ-ment rate of mothers with at least one child under age 3 is rather robust. However, with only about 18 additional women taking up paid work for 100 new child care places, the effect may seem somewhat disappointing.
This moderate effect may in part be explained by the fact that we consider the effect of child care availability on the maternal employment rate, an outcome variable which measures the proportion of mothers at work, but not the intensity of their work supply. As a matter of fact, when new child care places are opened, additional women may be induced to work, but women who already worked may likewise be induced to increase their working time, for example from part-time to full-time. These changes in working hours are ignored by the present study as it focuses on the employment rate.
Another partial explanation could be that our measurement of child care avail-ability is not sufficiently accurate. As already outlined, defining the coverage rate over an enlarged area is definitely a better choice than at the level of the considered municipality only, but it is still approximative : parents may for example not only look for child care services located close to their place of residence, but also close to their place of work. This measurement error might to some extent bias downward our estimated effect.
The presumably most important explanation for the moderate estimated effect is that the increase in formal child care availability actually yielded some women
who would otherwise have resorted to informal child care16 to now resort to newly
available formal child care services. As suggested by the available literature, this crowding out effect is most likely to be substantial.
5.2. Extensions
So far, we did not make any distinction among formal child care services. As already outlined, formal child care services can be grouped into two broad categories : family care, provided by childminders at their private home, and collective care, mainly provided by day care centers. A further distinction can be made between child care services that are subsidized by ONE, and those that are not. For Wallonia as a whole, the part of subsidized services was equal to 70.77% in 2005 and 72.30% in 2009, while the part of collective services was equal to 54.28% in 2005 and 54.90% in
200917. These aggregate figures however hide large differences across municipalities,
both in level and through time.
Theoretically, a larger part of subsidized services should boost the maternal
em-ployment rate as a result of their better financial affordability18. It is also argued
that a larger part of collective services may likewise foster the maternal employment rate due to the fact that in principle collective services more easily satisfy “emer-gency” child care requests (for going to a job interview, participating in a training, or to respond positively to an unexpected job offer). These conjectures may read-ily be checked by adding the part of subsidized services and the part of collective services to our benchmark model.
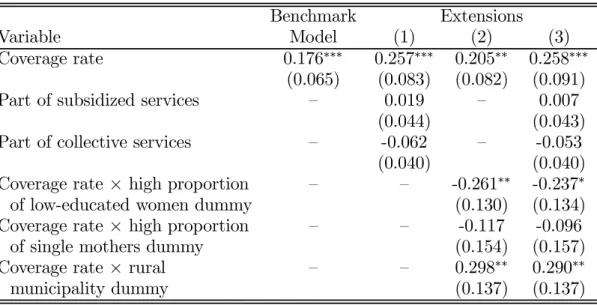
Table 5 : Women with at least one child under age 3 Extensions
Benchmark Extensions
Variable Model (1) (2) (3)
Coverage rate 0.176∗∗∗ 0.257∗∗∗ 0.205∗∗ 0.258∗∗∗
(0.065) (0.083) (0.082) (0.091)
Part of subsidized services — 0.019 — 0.007
(0.044) (0.043)
Part of collective services — -0.062 — -0.053
(0.040) (0.040)
Coverage rate × high proportion — — -0.261∗∗ -0.237∗
of low-educated women dummy (0.130) (0.134)
Coverage rate × high proportion — — -0.117 -0.096
of single mothers dummy (0.154) (0.157)
Coverage rate × rural — — 0.298∗∗ 0.290∗∗
municipality dummy (0.137) (0.137)
Notes : Generalized FEGLS estimates. 235 municipalities observed over 2005-2009. Robust standard errors in parentheses. Significance level : * = 10%, ** = 5% and *** = 1%.
As it may be seen from Table 5, neither the part of subsidized services nor
17The part of subsidized (resp. collective) services is defined as the number of places available in
subsidized (resp. collective) services divided by the total number of available child care places.
18As a reminder, in subsidized services, the day care fee paid by parents must follow an
the part of collective services appears to have a significant effect on the maternal employment rate. The apparent absence of effect of the part of subsidized services is most likely related to the fact that the part of subsidized services is already high in most municipalities (it is bigger than 45% in 95% of the municipalities). It may also partly be explained by the fact that some non-subsidized services also apply the income-dependent grid defined by ONE. On the other hand, the apparent absence of effect of the part of collective services suggests that the exact mix between family and collective child care services is of secondary importance.
The increase in the availability of formal child care may not boost the employ-ment of all mothers equally. In particular, it might be less effective for low-educated and/or single mothers, notably because of the existence of unemployment traps. A similar concern may be raised for mothers living in rural areas. Because the proportions of low-educated women and of single mothers vary across
municipali-ties, the first conjecture may be assessed — admittedly in a somewhat crude way19
— by adding to our benchmark model interaction terms between the coverage rate and dummy variables identifying respectively municipalities with a high proportion
of low-educated women20 and municipalities with a high proportion of single
mo-thers21. The latter conjecture may readily be checked by further adding to the model
an interaction term between the coverage rate and a dummy variable indicating rural
municipalities22.
As shown by Table 5, the effect of the coverage rate on the maternal employment rate is found to be significantly lower in municipalities with an high proportion of low-educated women. This suggests that only increasing the availability of formal child care is probably not enough to really boost the employment of low-educated mothers. On the other hand, the effect of the coverage rate is not found to be significantly lower in municipalities with a high proportion of single mothers, so that it cannot be argued this is also the case for single mothers. Finally, it appears that the effect of the coverage rate on the maternal employment rate is significantly higher in rural municipalities. The reasons underlying this somewhat unexpected result are unclear. A tentative explanation might be that there are less possibilities of informal child care arrangements in rural areas, so that the crowding out effect is less important.
19A proper investigation of these questions would require individual data. The results reported here
should therefore be viewed as merely tentative.
20These are defined as the municipalities where, according to the 2001 Census data, (1) the proportion of
women with primary education is higher than 16% (this proportion varies from 5.37% to 27.18% across municipalities, with a median equal to 15.14%), and (2) the proportion of women with higher education is lower than 27% (this proportion varies from 13.79% to 52.37% across municipalities, with a median equal to 28.64%). These represent about 27% of our sample.
21These are defined as the municipalities where, according to our CBSS data, the average proportion
of single mothers over the 2005-2009 period is higher than 15.5% (this average proportion varies from 1.44% to 31.86% across municipalities, with a median equal to 10.08%). These represent about 30% of our sample.
22These are defined as the municipalities classified in 2008 as “thinly populated area” according to
the Degree of Urbanisation (DEGURBA) classification of EUROSTAT. These represent about 28% of our sample.
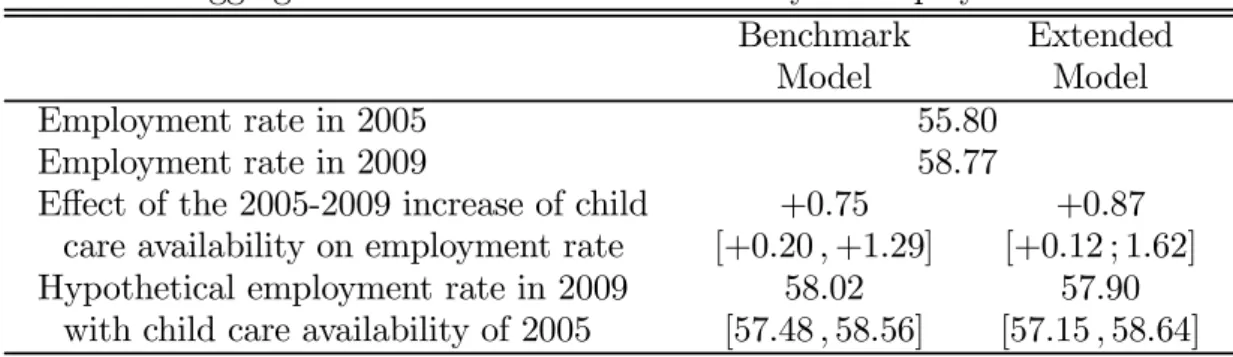
5.3. Aggregate effect
For Wallonia as a whole, the employment rate of 18-49 year old women with at least one child under 3 increased from 55.80% in 2005 to 58.77% in 2009. Using our estimated results, the effect of the 2005-2009 change in available child care on the maternal employment rate may be evaluated for each municipality, then aggregated for Wallonia as a whole, allowing thereby to deduce what would have been the aggregate maternal employment rate in 2009 if child care availability remained at its 2005 level. Table 6 reports the result of this calculation, based on both the estimates of our benchmark model and of the extended model (3) of Table 5 to assess its robustness.
Table 6 : Women with at least one child under age 3
Aggregate effect of child care availability on employment rate
Benchmark Extended
Model Model
Employment rate in 2005 55.80
Employment rate in 2009 58.77
Effect of the 2005-2009 increase of child care availability on employment rate
+0.75 [+0.20 , +1.29]
+0.87 [+0.12 ; 1.62] Hypothetical employment rate in 2009
with child care availability of 2005
58.02 [57.48 , 58.56]
57.90 [57.15 , 58.64]
Notes : The employment rates are in percentage. The Extended Model refers to the extended model (3) of Table 5. 95% confidence intervals between brackets.
As it may be seen, using our benchmark model, the effect of the 2005-2009 in-crease in child care availability on the aggregate employment rate of Walloon women with at least one child under age 3 is estimated to be equal to 0.75 percentage points. Accordingly, if child care availability remained at its 2005 level, it is estimated that in 2009 the aggregate maternal employment rate would have been equal to 58,02%, instead of 58.77%. This represents a loss of about 750 working mothers. Viewed in an other way, about 25% of the increase in the maternal employment rate observed over the 2005-2009 period in Wallonia may be attributed to the increased availabil-ity in formal child care. Using the extended model leads to estimates of the same magnitude.
6. Conclusion
This paper was interested in evaluating the effect of the increased availability of formal child care for children under 3 in Wallonia on the employment rate of their mothers. To this end, we used a difference-in-differences approach based on municipality-level panel data, taking advantage of the fact that the increased avail-ability in formal child care widely varied across municipalities. We found that an increase of one percentage point in the coverage rate yields an increase of about 0.18 percentage points in the employment rate of women with at least one child under 3, which means that when 100 new child care places are opened, about 18 additional women take up paid work. This moderate effect is most likely due to a substantial
crowding-out effect.
These results suggest that no more than a moderate effect on maternal employ-ment should be expected from a further similar increase in the availability of formal child care. This does not mean that such a policy is worthless. It must be stressed that supporting maternal employment is only one of the goals of public policies aimed at increasing the availability and/or affordability of formal child care. Other important goals, which are perhaps even more important from the point of view of policy makers, are the improvement of children’s cognitive and social development, as well as equity.
Reference
Angrist, J. D., and W. E. Evans, (1998). “Children and Their Parents’ Labor Sup-ply : Evidence from Exogenous Variation in Family Size”, American Economic
Review, 88, 450-477.
Angrist, J. D., and J-S. Pischke (2009), Mostly Harmless Econometrics, Princeton University Press.
Baker, M., J. Gruber, and K. Milligan (2008), “Universal Child Care, Maternal Labor Supply, and Family Well-Being”, Journal of Political Economy, 116, 709-745.
Bauernschuster, S., and M. Schlotter (2015), “Public Child Care and Mothers’s Labor Supply - Evidence from Two Quasi-Experiments”, Journal of Public
Eco-nomics, 123, 1-16.
Berlinski, S., and S. Galiani (2007), “The Effect of a Large Expansion of Pre-primary School Facilities on Prechool Attendance and Maternal Employment”, Labour
Economics, 14, 665-680.
Cameron, A. C., and P. K. Trivedi (2005), Microeconometrics : Methods and
Appli-cations, Cambridge University Press.
Casio, E. (2009), “Maternal Labor Supply and the Introduction of Kindergartens into American Public Schools”, Journal of Human resources, 44, 140-170 Chevalier, A., and T. K. Viitanen (2002), “The Causality Between Female Labour
Force Participation and the Availability of Childcare”, Applied Economics
Let-ters, 9, 915-918.
De Henau, J., and S. O’Dorchai (2010), “Maybe Baby : Comparing Mothers’ Em-ployment and Child Policies the EU-15", Feminist Economics, 16, 43-77. Fitzpatrick, M.D. (2010), “Preschoolers Enrolled and Mothers at Work ? The Effects
of Universal Prekindergarten”, Journal of Labor Economics, 28, 51-85.
Gelbach. J. (2002), “Public Schooling for Young Children and Maternal Labor Sup-ply”, American Economic Review, 92, 307-322.
Gornick, J., M. K. Meyers, and K. E. Ross (1997), “Supporting the Employment of Mothers : Policy Variation Across Fourteen Welfare States”, Journal of
Gornick, J., M. K. Meyers, and K. E. Ross (1998), “Public Policies and the Em-ployment of Mothers : A Cross-National Study”, Social Science Quaterly, 79, 45-70
Goux, D., and E. Maurin (2010), “Public School Availability for Two-year Olds and Mothers’s Labour Supply”, Labour Economics, 17, 951-962.
Hardoy, I., and P. Schøne (2013), “The Effect of Access to Subsidized Child Care on the Labor Supply of Mothers”, Working Paper, Institute for Social Research, Oslo, Norway.
Havnes, T., and M., Mogstad (2011), “Money for Nothing ? Universal Child Care and Maternal Employment”, Journal of Public Economics, 95, 1455-1465. Jaumotte, F. (2003), “Les Femmes sur le Marché du Travail : Evidence Empirique
sur le Rôle des Politiques Economiques et Autres Déterminants dans les Pays de l’OCDE", Revue Economique de l’OCDE, 37, 57-122.
Lefebvre, P., and P. Merrigan (2008), “Child-Care Policy and the Labor Supply of Mothers with Young Children : A Natural Experiment from Canada”, Journal
of Labor Economics, 26, 519-548.
Lundin, D., E. Mörk, and B. Öckert (2008), “How Far Can Reduced Childcare Prices Push Female Labour Supply ?”, Labour Economics, 15, 647-659.
Meulders, D., and S. O’Dorchai (2008). “Childcare in Belgium”, Working Paper, DULBEA, Free University of Brussels, Belgium.
Moschion, J. (2009): "Offre de Travail des Mères en France : L’Effet Causal du Passage de Deux à Trois Enfants", Economie et Statistique, 422, 51-78.
Nollenberger, N., and N. Rodrigez-Planas (2011), “Child Care, Maternal Employ-ment and Persistence : A Natural ExperiEmploy-ment from Spain, IZA Discussion Paper No. 5888, Bonn, Germany.
OECD (2011), Doing better for families, OECD Publishing.
Schlosser, A. (2005), “Public Preschool and the Labor Supply of Arab Mothers : Evidence from a Natural Experiment”, Working Paper, The Hebrew University of Jerusalem, Israel.
Simonsen, M. (2010), “Price of High-quality Daycare and Female Employment”,
Scandinavian Journal of Economics, 112, 570-594.
Stadelmann-Steffen, I. (2008), “Women, Labour and Public Policy : Female Labour Market Integration in OECD Countries. A Comparative Perspective”, Journal
of Social Policy, 37, 383-408.
Vanleenhove, P. (2013), “Full Childcare Coverage : Higher Maternal Labour Supply and Childcare Usage ?”, Flemosi Discussion Paper DP 26, Center for Economic Studies, University of Leuven, Belgium.
Wooldridge, J. M. (2010), Econometric Analysis of Cross Section and Panel Data, 2nd ed., MIT Press.