UNIVERSITÉ DE MONTRÉAL
THERMOPLASTIC VULCANIZATE NANOCOMPOSITES BASED ON
POLYPROPYLENE/ETHYLENE PROPYLENE DIENE TERPOLYMER
(PP/EPDM) PREPARED BY REACTIVE EXTRUSION
AMIN MIRZADEH
DÉPARTEMENT DE GÉNIE CHIMIQUE ÉCOLE POLYTECHNIQUE DE MONTRÉAL
THÈSE PRÉSENTÉE EN VUE DE L’OBTENTION DU DIPLÔME DE PHILOSOPHIAE DOCTOR
(GÉNIE CHIMIQUE) JANVIER 2012
UNIVERSITÉ DE MONTRÉAL
ÉCOLE POLYTECHNIQUE DE MONTRÉAL
Cette thèse intitulée:
THERMOPLASTIC VULCANIZATE NANOCOMPOSITES BASED ON POLYPROPYLENE/ETHYLENE PROPYLENE DIENE TERPOLYMER (PP/EPDM)
PREPARED BY REACTIVE EXTRUSION
présentée par:
en vue de l’obtention du diplôme de : MIRZADEH Amin
a été dûment acceptée par le jury d’examen constitué de : Philosophiae Doctor
Mme DESCHÊNES Louise M.
, Ph.D., présidente DUBOIS Charles
M.
, Ph.D., membre et directeur de recherche LAFLEUR Pierre
M.
, Ph.D., membre et codirecteur de recherche KAMAL Musa R.
M.
, Ph.D., membre et codirecteur de recherche FAVIS Basil
M.
, Ph.D., membre
DEDICATION
ACKNOWLEDGMENTS
I would like to express my deep and sincere gratitude to my research supervisors, Prof. Charles Dubois, Prof. Pierre Lafleur and Prof. Musa Kamal for believing in my potential and for providing me the great opportunity to study under their supervision. Their innovative and questioning approach, encouragement, patience and broad knowledge helped me throughout my study at the École Polytechnique de Montréal.
Thanks to Prof. Philippe Cassagnau, Prof. Basil Favis and Prof. Louise Deschênes for taking part in my thesis committee.
During my study, I had the chance to attend and present my results in rheology meetings. I would like to thank Prof. Pierre J. Carreau and Prof. Marie-Claude Heuzey and all the students in their research group for the valuable comments and suggestions.
I shall also thank to the National Science and Engineering Research Council of Canada whose generous financial support made this research possible.
I would like to appreciate Dr. Prashant Bhadane and Dr. Shant Shahbikian who worked on the same field before me. It was a great privilege to have a discussion with them about the scientific issues.
Thanks to all the technical staff of Chemical Engineering department, especially Mr. Jacques Beausoleil, Mr. Guillaume Lessard, Mr. Gino Robin, Ms. Martine Lamarche, Mr. Carol Painchaud and Mr. Lionel Valero. An especial thank to Ms. Mélina Hamdine for all the training, suggestions and her patience. I would also like to thank Ms. Leelapornpisit Weawkamol for experimental assistance particularly for microscopy parts.
I would like to thank my friends with whom I had wonderful time during these years; Majid, Tara, Daniel, Leila, Sina, Babak, Khatereh, Farrokh, with special thanks to Camilia who has been there for me in any condition and helped me for the French translation.
And last but not the least, all my deepest gratitude to my family for their unconditional love and support.
RÉSUMÉ
Les élastomères thermoplastiques (TPEs) représentent un groupe important de matériaux polymères, plus précisément des mélanges de polymères, qui possèdent un comportement élastique similaire aux matériaux caoutchouteux mais contiennent des liens thermoréversibles les rendant faciles à manipuler via des procédés de traitement des thermoplastiques. Une catégorie importante de TPEs consiste en des matériaux à base de polyoléfine, dont de polypropylène (PP) et de terpolymère éthylène-propylène-diène (EPDM) qui sont connus dans le marché pour leurs propriétés physique et mécanique intéressantes obtenues grâce à leur faible tension interfaciale (~0.3 mN/m) et à leur compatibilité de phase. Durant les dernières décennies les mélanges d’EPDM/PP ont, en raison de l’importance commerciale, attiré l’attention des milieux industriels et académiques afin d’améliorer leur comportement élastique et /ou leurs propriétés techniques, et étendre leurs champs d’application.
Cette thèse s’intéresse principalement à l’usage des nanotechnologies par l’incorporation de la nano-argile dans la phase thermoplastique de ces matériaux. Elle étudie l’effet de différents niveaux de dispersion de la nano-argile sur la co-continuité des mélanges réactifs et la liaison interfaciale des mélanges préparés par l’extrusion réactive. De plus, la recherche portée dans ce travail a aussi pour but de déterminer le comportement élastique de ces mélanges en présence de la nano-argile et cela en relation avec le niveau de dispersion de ces particules dans les mélanges. Par conséquent, le développement morphologique et les propriétés fonctionnelles et techniques des nanocomposites thermoplastiques vulcanisées (TPV) ont été investigués. Pour ce travail, différentes sortes de polymères polypropylène-g-maléique anhydride ont été utilisées afin d’élucider l’effet de l’agent de comptabilisation sur le niveau de dispersion de la nano-argile dans la phase thermoplastique. Les analyses par diffractométrie de rayons X (XRD), la microscopie électronique à transmission (TEM), et la microscopie électronique à balayage (SEM) des mélanges préparés confirment que les nanocomposites PP se modifient d’une structure intercalée vers une coexistence des tactoïdes intercalés et des couches exfoliées nommées des nanocomposites ‘partiellement exfoliées’. Parmi les différents paramètres de performance de l’agent de comptabilisation, sa relaxation se corrèle directement avec les résultats de la caractérisation des nanocomposites; un temps de relaxation plus long de l’agent de comptabilisation est associé avec une meilleure dispersion de la nano-argile dans les mélanges.
Pour étudier la co-continuité du développement des mélanges non-réactifs, l’EPDM et les nanocomposites PP ont été mélangés à l’état fondu avec différentes compositions en utilisant un mélangeur interne. Basé sur le mesure de continuité des TPEs et de leurs nanocomposites associées pour la phase thermoplastique et élastique, il est déduit que la présence de nano-argile réduit la plage de composition de la co-continuité et altère ses caractéristiques symétriques. Toutefois, cet effet est plus prononcé plus chez les nanocomposites intercalées que chez les nanocomposites partiellement exfoliées. Une meilleure dispersion de la nano-argile limite la réduction de la continuité de la phase thermoplastique de sorte que l’indice de continuité de la phase thermoplastique des nanocomposites TPE partiellement exfoliées préparées avec un contenu plus élevé d’EPDM (i.e. à 70 wt%) devient plus importante que celle des TPEs sans nano-argile. Ces résultats montrent qu’il est possible d’utiliser plus d’EPDM dans les mélanges en utilisant des nanocomposites partiellement exfoliées avant la formation de la matrice de dispersion de structure qui limite la production du TPV. Néanmoins, il s’avère important de mentionner que les radiations gamma ont été utilisées pour stabiliser la morphologie d’EPDM et estimer la continuité du PP en utilisant des extractions solubles et des techniques de gravimétrie.
De plus, l’effet de la continuité sur le comportement rhéologique des nanocomposites TPE a été étudié. La viscosité transitoire s’est montrée plus sensible à l’indice de continuité que les autres fonctions matérielles obtenues en utilisant un balayage en fréquence, des essais de relaxation de contrainte, et les essais de fluage. Il a été montré qu’un indice de continuité d’EPDM plus élevé amène à une baisse de viscosité transitoire normalisée quand la phase thermoplastique est continue; car la déformation des domaines d’EPDM est plus facile que l’altération dans une matrice continue. D’un autre côté, basé sur les expérimence d’extraction et des micrographes SEM, il existe des preuves qui démontrent que l’argile reste principalement dans la phase PP. Les résultats de balayage par la calorimétrie différentielle (DSC) montrent que la présence de nano-argile dans la phase thermoplastique augmente la température de la cristallisation (jusqu’à ~20 °C), ce qui peut s’avérer bénéfique pour les applications de moulage par injection grâce à une solidification plus rapide et un temps de cycle plus court.
L’objectif ultime de ce travail est de maximiser le comportement élastique en contrôlant la morphologie du mélange et son niveau de réticulation. Par conséquent, cette étude couvre aussi les effets de la présence de nano-argile et son niveau de dispersion sur la réaction de réticulation des nanocomposites TPV préparées par une extrusion réactive. Ici, la phase élastique a été
vulcanisée d’une manière dynamique en utilisant une résine phénolique de diméthylol ou une résine d’octylphénol-formaldéhyde avec du chlorure d'étain déshydraté comme catalyseur. Dans cette étude, la vulcanisation dynamique des TPVs préparés et ses nanocomposites correspondant a été caractérisée en utilisant différents critères tels que : le contenu en fraction soluble, la viscosité et le module élastique G' en déformation dynamique, , la largeur du signal de résonance magnétique nucléaire (RMN), le contenu d’agent de réticulation et la concentration en diène résiduelle. La combinaison de ces paramètres a été jugée suffisante pour décrire le système.
Contrairement aux mélanges préparés dans un mélangeur interne dans lequel le niveau de réticulation des nanocomposites TPV est toujours plus bas que celui des TPVs, l’effet de la présence de nano-argile dans les échantillons préparés par extrusion réactive s’avère plus compliqué. Il appert que la différence entre la taille de la réaction de réticulation entre les TPVs et les nanocomposites TPV est plus prononcée pour les échantillons préparés avec une vitesse de vis plus élevée (400 tour par minute (rpm), temps de résidence ~ 65 s). Néanmoins, il n’existe pas de différence significative pour les échantillons préparés avec une vitesse de vis plus basse (200 rpm, temps de résidence ~ 45 s).
Pour ces mélanges réactifs, l’analyse de la courbe du couple de mélange en fonction du temps, ainsi que l’analyse des mesures sur la fraction soluble et des micrographes SEM à différentes positions dans l'extrudeuse confirment que la structure co-continue existe au moins avant la deuxième zone de mélange dans une extrudeuse bi-vis en fonctionnement co-rotatif. Autrement dit, la co-continuité des mélanges avant la deuxième zone de mélange n’est pas seulement contrôlée par la vulcanisation dynamique, mais aussi par la présence de nano-argile. Considérant ce fait et basé aussi sur le calcul de la conversion chimique par la mesure des valeurs de concentration de la diène résiduelle obtenu par RMN, il est suggéré que la présence de nano-argile affecte la réaction de réticulation principalement par son influence sur la continuité de la phase d’EPDM dans la structure co-continue qui se forme lors de l’étape initiale du processus de mélange. Il a été démontré qu’une plage de réticulation plus élevée est associée avec un indice de continuité d’EPDM plus haut. À son tour, le niveau de la co-continuité dépend aussi du degré de dispersion de nano-argiles. Aussi, quand la continuité de la phase d’EDPM des deux mélanges est similaire, l’effet de barrière des nano-argiles intensifie la réaction de réticulation par l’augmentation de la concentration de l’agent curatif local. Nos travaux montrent que si l’EPDM dans le système correspondant non-réactif est une phase continue, le niveau de la réaction de
réticulation devient plus dépendant de la vitesse de rotation des vis. En autres mots, plus le temps de résidence est long, plus élevé est l’étendue de réticulation. De plus, il est important de mentionner que la valeur de la largeur de base du pic principal en spectroscopie RMN peut seulement être utilisée pour comparer l’étendue de réticulation dans des TPVs dû à l’influence du nano-argile sur la mobilité de la chaîne principale de l’EPDM dans les nanocomposites TPV.
L’analyse des mélanges du point de vue de structure des nanocomposites révèle que l’interaction des chaînes de polymères dans les galeries inter-couches des nano-argiles est plus prononcée pour les nanocomposites TPV comparé aux nanocomposites TPE dû à une contrainte de cisaillement plus élevée exercée sur les couches nano-argiles durant la vulcanisation dynamique. Aussi, en augmentant le contenu d’EPDM, l’intercalation du polymère n’a pas été significativement améliorée. Pour les nanocomposites TPV préparés à une vitesse de vis plus élevée (400 rpm), le premier pic de la caractéristique du nano-argile en diffraction rayon X (2 =2.85 , l'espace-d correspondant est 3.1 nm) s’est déplacé à un angle plus bas (2θ=0.94ο, l’espace-d correspondant est 9.3 nm), tandis que celui des nanocomposites TPV basés sur une compositition partiellement exfoliée a complètement disparu.
La dernière partie de cette thèse se penche sur la question de l’influence du niveau de dispersion des nano-argiles, et conséquemment l’étendue de réticulation, sur le comportement élastique et la morphologie des TPVs. Une méthode récemment développée, s’appelant le balayage de la température de relaxation de contrainte (TSSR), a été utilisée pour estimer l’indice d’élasticité des TPVs et des nanocomposites TPV. Cette méthode donne de l’information satisfaisante sur l’étendue de réaction de réticulation. Le comportement élastique des mélanges contenant 50 p/p % et 60 p/p% d’EPDM- dans lesquelles les études morphologiques suggèrent la présence des gouttes élastiques dans le voisinage des particules élastiques de formes irrégulières avec un niveau d’inter-connectivité bas- corrèle avec la taille de la gouttelette élastique. Par conséquent, la présence de nano-argile influence la valeur de l’indice d’élasticité par son effet sur la taille des gouttelettes élastiques qui contrôle le nombre des points de rétraction dans le mécanisme de fluage proposé durant l’essai TSSR. Il faut prendre note que l’augmentation du contenu d’EPDM abaisse le nombre des gouttes et augmente aussi la formation des particules élastiques avec des formes irrégulières. D’un autre côté, la relation directe entre les valeurs de l’indice élastique et la densité de réticulation est seulement observée pour des séries de TPVs qui
θ ο
montrent un réseau extensif bien développé entre les gouttes de forme irrégulière (mélanges contenant 70wt% d’EPDM). Finalement, l’effet de la présence de nano-argile et son niveau de dispersion sur le comportement élastique se démontre par son influence sur la densité de réticulation.
ABSTRACT
Thermoplastic elastomeric materials (TPEs) are an important class of copolymers or polymer blends that exhibit the typical advantages of conventional rubbers but can be processed with the thermoplastic processing methods. Among different kind of thermoplastic elastomer , those based on polypropylene (PP) and ethylene propylene diene terpolymer (EPDM) are known to have more interesting properties due to the relatively low interfacial tension between PP and EPDM (~0.3 mN/m). Considering the commercial significance of the mentioned blends, different approaches have been used during the last few decades to improve their rubber like behaviour and/or their engineering properties to expand their fields of applications. In this regard, in the present dissertation, the use of nanotechnology by incorporating the nanoclay in the thermoplastic phase is the major interest subject. The effects of different nanoclay dispersion levels on the co-continuity of non reactive blends and the extent of crosslinking in the blends prepared by reactive extrusion are studied. This research intends to tailor the rubber like behaviour by the nanoclay presence and its dispersion level. Therefore the morphology development along the screw axis and the functional and engineering properties of the prepared thermoplastic vulcanizates nanocomposites are also investigated.
For this work, different grades of polypropylene-g-maleic anhydride polymers were chosen to elucidate the effect of compatibilizer on the nanoclay dispersion level in thermoplastic phase. X-ray diffraction (XRD) patterns along with transmission electron microscopy (TEM) and scanning electron microscope (SEM) micrographs confirmed that prepared PP nanocomposites ranged from intercalated structure to a coexistence of intercalated tactoids and exfoliated layers namely “partially exfoliated” nanocomposite. Among various factors affecting the compatibilizer performance, it is shown that only the relaxation behaviour of compatibilizer correlates directly with the nanocomposites characterization results; higher relaxation times of the compatibilizer are associated with better dispersion of nanoclay.
To study the co-continuity development of the nonreactive blends, EPDM and the mentioned PP nanocomposites at various compositions were melt blended using an internal mixer. Based on continuity measurements of TPEs and TPE nanocomposites for both thermoplastic and rubber phase, it is shown that the presence of nanoclay decreases the co-continuity composition range and alters its symmetrical feature. However, this effect is more
pronounced in the intercalated nanocomposites than in partially exfoliated nanocomposites. It seems that better nanoclay dispersion limits the reduction of the thermoplastic phase continuity in a manner that the continuity index of the thermoplastic phase for partially exfoliated TPE nanocomposite prepared at high EPDM content (i.e. at 70 wt%) is greater than that of corresponding TPE without nanoclay. According to these results, it is possible to shift to higher EPDM content using partially exfoliated system before formation of matrix-dispersed particle structure which limits thermoplastic vulcanizate production. This should be mentioned that gamma irradiation was carried out in order to fix the EPDM morphology to estimate the continuity of PP using the solvent extraction and gravimetry technique. Additionally, the effect of continuity on rheological behaviour of TPE nanocomposites was investigated. The stress growth viscosity was found to be more sensitive to the continuity index than other material functions obtained using frequency sweep, stress relaxation and creep experiments. It seems that a higher EPDM continuity index leads a lower overshoot of normalized stress growth viscosity when thermoplastic phase is continuous because deformation of the separated domains of EPDM is easier than alteration in a continuous network structure.
On the other hand, based on extraction tests and SEM micrographs, there are some evidences that clay remain mainly in the PP phase. According to differential scanning calorimetry (DSC) results, the presence of nanoclay in the thermoplastic phase increases the crystallization temperature (up to ~20 °C) that could be beneficial for molding applications, because of the faster solidification and shorter cycle time.
The ultimate goal in this field is to maximize the rubber like behaviour by controlling the blend morphology and the level of crosslinking. Therefore, this study also covers the effects of nanoclay presence and its dispersion level on the crosslinking reaction of thermoplastic vulcanizate nanocomposites prepared by reactive extrusion. Here, the rubber phase was dynamically vulcanized using dimethylol phenolic resin or octylphenol-formaldehyde resin along with stannous chloride dihydrate as the catalyst. In the present study, the dynamic vulcanization of the prepared TPVs and corresponding nanocomposites are characterized using different criteria, such as gel content, viscosity and normalized storage modulus in the time sweep tests, nuclear magnetic resonance (NMR) signal line width, bound curative content and residual diene concentration. The combination of the above parameters appears to be sufficient to provide a clear description of the systems.
Contrary to the blends prepared in internal batch mixer in which the extent of crosslinking in TPV nanocomposites is always lower than that of TPVs, however, the effect of nanoclay presence in the samples prepared by reactive extrusion is more complicated. It seems that the difference in the extent of crosslinking reaction between TPVs and TPV nanocomposites is more pronounced for the samples prepared at higher screw speed (400 rpm, residence time of ~ 45 s). Whereas, there is no significant difference was found for the samples prepared at lower screw speed (200 rpm, residence time of ~ 65 s).
The torque-time curve analysing obtained from internal batch mixer, gel content experiments and SEM micrographs along the extruder axis for the reactive blends confirm that the co-continuous structure exists at least before the second mixing zone of the twin screw extruder. In other words, the co-continuity of the blends before the second mixing zone is not only controlled by dynamic vulcanization but also by the presence of nanoclay. Considering this fact and based on the bound curative content and residual diene concentration values obtained by solid state NMR, it is suggested that nanoclay presence affects the extent of crosslinking reaction mainly through its effect on the continuity of the EPDM phase in the co-continuous structure forming in the initial stage of the mixing process. It is shown that the higher extent of crosslinking is associated with higher continuity index of EPDM. In turn, the level of co-continuity, as mentioned earlier, depends on the degree of dispersion of nanoclay. On the other hand, when the continuity of EPDM phase of two blends is similar, the barrier effect of nanoclays intensifies the crosslinking reaction by increasing the local concentration of curing agent. In our experimental window, if EPDM in the corresponding non-reactive system is a continuous phase, the extent of crosslinking reaction appears to be more dependent on the screw speed. Otherwise, higher residence time would increase the extent of crosslinking. Moreover, it should be mentioned that the backbone peak base width values may be used only to compare the extent of crosslinking in the TPVs due to the influence of nanoclay on the mobility of the backbone of EPDM in TPV nanocomposites.
The investigation of the blends, from nanocomposite structure point of view, reveals that intercalation of polymer chains into the interlayer galleries of the nanoclays is more pronounced for the TPV nanocomposites compared to TPE nanocomposites due to the higher shear stress which is exerted on the nanoclay layers during dynamic vulcanization. It should be mentioned that by increasing EPDM content, polymer intercalation was not enhanced significantly. For the
TPV nanocomposites based on intercalated system prepared at higher screw speed (400 rpm), the first characteristic peak of nanoclay (2 =2.85 , corresponding d-spacing is 3.1 nm) shifted to the lower angle (2θ =0.94ο
, corresponding d-spacing is about 9.3 nm) while that of TPV nanocomposites based on partially exfoliated system disappeared.
The last part of the present study is devoted to find how the dispersion level of nanoclay and consequently the extent of crosslinking change the rubber like behaviour and the morphology of the prepared TPVs. Therefore, recently developed method named temperature scanning stress relaxation (TSSR) was used to estimate the rubber indices of TPVs and TPV nanocomposites. The mentioned method also successfully provided information about the extent of crosslinking reaction. It is shown that the rubber like behaviour of the blends containing 50wt% and 60wt% of EPDM in which morphological studies suggest the presence of the rubber droplets in vicinity of irregular shape rubber particles with a low level of interconnectivity, correlates with the rubber droplet size. Therefore, the nanoclay presence affects the rubber index values mainly through its effect on the size of the rubber droplets that controls the number of retraction points in the proposed buckling mechanism during the TSSR test. It should be mentioned that by increasing the EPDM content, the number of the droplet like domains decreases and more irregular shape rubber particles is formed. On the other hand, the direct relation between rubber index values and the crosslink density is observed only for those series of TPVs showing the fully developed extensive network between irregular shape rubber domains (blends containing 70wt% of EPDM). Hence, the nanoclay dispersion level influences the rubber like behaviour through its effect on the crosslink density.
TABLE OF CONTENTS
DEDICATION ... III ACKNOWLEDGMENTS ... IV RÉSUMÉ ... V ABSTRACT ... X TABLE OF CONTENTS ... XIV LIST OF TABLES ... XX LIST OF FIGURES ... XXI NOMENCLATURE ... XXV
Chapter 1 INTRODUCTION AND OBJECTIVES ... 1
1.1 Introduction ... 1
1.2 Objectives ... 3
1.2.1 Main Objective... 3
1.2.2 Specific Objective ... 4
Chapter 2 LITERATURE REVIEW ... 5
2.1 Morphology Formation in Dynamically Vulcanized PP/EPDM ... 5
2.1.1 Co-continuity and its Importance on the Final TPVs Morphology ... 7
2.1.2 Factors Influencing the Co-continuity and Final Morphology of TPVs ... 9
2.1.2.1 Viscosity ... 9
2.1.2.2 Interfacial Tension ... 13
2.1.2.3 Processing Conditions and Other Parameters ... 13
2.1.3 Equations for the Phase Inversion and Co-continuous Composition ... 15
2.2 Crosslinking Systems ... 19
2.2.1.1 Solvent Swelling ... 22
2.2.1.2 Gel Content ... 23
2.2.1.3 Solid State NMR ... 24
2.2.1.4 AFM Force Modulation Amplitude ... 27
2.3 Mechanical and Viscoelastic Properties ... 27
2.3.1 Elastomeric Properties Characterization ... 29
2.3.1.1 Modified Hysteresis Tensile Analysis ... 29
2.3.1.2 Temperature Scanning Stress Relaxation Test (TSSR) ... 30
2.4 Rheological Properties ... 31
2.5 Reactive Extrusion of TPVs ... 33
2.6 Polymer Layered Silicate Nanocomposites ... 38
2.6.1 Nano-clay ... 39
2.6.2 Surface Treatment ... 40
2.6.3 Preparation Methods of Nanocomposites ... 41
2.6.3.1 In-situ Polymerization ... 41
2.6.3.2 Solution Mixing ... 41
2.6.3.3 Melt Mixing ... 42
2.6.4 Nanocomposites Characterization... 42
2.6.4.1 Wide angle X-ray Scattering Analysis ... 43
2.6.4.2 Transmission Electron Microscopy ... 44
2.6.5 Properties of Nanocomposites ... 44
2.7 TPV Nanocomposites... 45
2.8 Summary and Limitations of the Previous Works ... 47
Chapter 4 THE EFFECT OF COMPATIBILIZER ON THE CO-CONTINUITY AND NANOCLAY DISPERSION LEVEL OF TPE NANOCOMPOSITES BASED ON PP/EPDM 52
4.1 Abstract ... 53
4.2 Introduction ... 54
4.3 Experimental ... 56
4.3.1 Materials ... 56
4.3.2 Blend Preparation and Nomenclature ... 57
4.3.2.1 Masterbatch Preparation ... 57
4.3.2.2 Nanocomposite Preparation ... 58
4.3.2.3 TPE Nanocomposites Preparation ... 58
4.3.3 Characterization Steps ... 59
4.3.3.1 Thermogravimetric Analysis... 59
4.3.3.2 Differential Scanning Calorimetry ... 59
4.3.3.3 X-ray Diffraction ... 59
4.3.3.4 Electron Microscopy... 59
4.3.3.5 Solvent Extraction and Gravimetry for Continuity ... 60
4.3.3.6 Rheological Measurements ... 61
4.4 Results and Discussion ... 61
4.4.1 Thermogravimetry... 61
4.4.2 Differential Scanning Calorimetry and Crystallinity. ... 62
4.4.3 Clay Dispersion in PP and TPE Nanocomposite. ... 63
4.4.4 Correlation between Rheological Behavior of PP-g-MA and Nanoclay Dispersion . 67 4.4.4.1 Thermal Stability of PP-g-MA During Rheological Tests. ... 67
4.4.4.2 Determination of Linear Zones in Rheological Tests... 68
4.4.4.4 Correlation between Compatibilizer Relaxation Time and Clay Dispersion .... 70
4.4.5 Effect of Nanoclay Dispersion Level on Co-continuity and Morphology of TPEs ... 71
4.4.5.1 Rubber Phase Continuity in TPEs ... 71
4.4.5.2 Thermoplastic Phase Continuity. ... 75
4.5 Conclusion ... 77
4.6 References ... 79
Chapter 5 THE EFFECTS OF NANOCLAY DISPERSION LEVELS AND PROCESSING PARAMETERS ON THE DYNAMIC VULCANIZATION OF TPV NANOCOMPOSITES BASED ON PP/EPDM PREPARED BY REACTIVE EXTRUSION ... 81
5.1 Abstract ... 82
5.2 Introduction ... 83
5.3 Experimental Procedures ... 86
5.3.1 Materials ... 86
5.3.2 Blend Preparation and Nomenclature ... 86
5.3.3 Sample Preparation and Characterization Steps ... 88
5.3.3.1 X-ray Diffraction ... 88
5.3.3.2 Electron Microscopy... 89
5.3.3.3 Determination of Gel Content along the Screw Axis ... 89
5.3.3.4 Rheological Measurements ... 90
5.3.3.5 Solid State NMR ... 90
5.4 Results and Discussion ... 90
5.4.1 Nanocomposite Characterization ... 90
5.4.2 The Extent of Crosslinking ... 93
5.4.2.1 Curve Analyzing and Gel Content Experiments ... 93
5.4.2.3 Solid State NMR Analysis ... 98
5.5 Conclusion ... 104
5.6 References ... 105
Chapter 6 MORPHOLOGY EVOLUTION AND THERMO MECHANICAL CHARACTERISTICS OF TPV NANOCOMPOSITES BASED ON PP/EPDM PREPARED BY REACTIVE EXTRUSION ... 107
6.1 Abstract ... 108
6.2 Introduction ... 108
6.3 Experimental Procedures ... 111
6.3.1 Materials ... 111
6.3.2 Blend Preparation and Nomenclature ... 111
6.3.3 Sample Preparation and Characterization Steps ... 112
6.3.3.1 X-ray Diffraction ... 112
6.3.3.2 Electron Microscopy... 112
6.3.3.3 Temperature Scanning Stress Relaxation (TSSR) and Tensile Testing ... 113
6.4 Results and Discussion ... 113
6.4.1 Nanocomposite Characterization ... 113
6.4.2 Crosslink Density of TPVs ... 117
6.4.3 Correlation between Morphology and Rubber like Behavior ... 119
6.4.3.1 TPVs Containing 50 wt% and 60 wt% of EPDM ... 119
6.4.3.2 TPVs Containing 70 wt% of EPDM ... 123
6.4.4 Tensile Properties ... 125
6.5 Conclusion ... 126
6.6 References ... 127
7.1 Scientific Contributions and Concluding Remarks ... 130 7.2 Recommendations ... 134 REFERENCES ... 136
LIST OF TABLES
Table 4-1. Properties of Compatibilizers ... 57
Table 4-2. Nomenclature of TPE nanocomposites based on their compositions. ... 58
Table 4-3.Nanoclay content for the masterbatches and nanocomposites obtained by TGA ... 61
Table 4-4. Percent of crystallinity and crystallization temperature ... 63
Table 4-5 . Change in storage modulus and complex viscosity after one hour at 200 ˚C. ... 68
Table 4-6. Stress values at three sequences for frequency sweep tests ... 68
Table 4-7. Characteristic relaxation time at 200 ˚C, ω=1 Hz. ... 70
Table 5-1. Processing conditions and the elements used in screw profile ... 87
Table 5-2. . Nomenclature of TPV nanocomposites and their compositions. ... 88
Table 5-3. The continuity indices of EPDM from non-crosslinked specimens ... 101
Table 5-4. The backbone peak base width for the TPV and TPV nanocomposites. ... 102
LIST OF FIGURES
Figure 2-1.Types of morphology in immiscible blends. (a) dispersed structure; (b) Matrix-fiber structures; (c) lamellar structure; (d) co-continuous structure(Potschke & Paul, 2003) ... 6 Figure 2-2. Co-continuous structure composition range using definition 1 and definition 2
(Potschke & Paul, 2003) ... 8 Figure 2-3. Relation between the volume range of co-continuous structures and viscosity ratio
(M. Van Duin & Machado, 2005) ... 9 Figure 2-4. Schematic representation of the two dispersion mechanisms: Left, the stepwise
equilibrium mechanism of repeated breakup at Cacritical,; right, the transient mechanism of
thread breakup during extension (Janssen & Meijer, 1993). ... 11 Figure 2-5. Distortion growth rate at dominant wavelength and dominant wave length vs λ
(Potschke & Paul, 2003) ... 12 Figure 2-6. Comparison of effect of viscosity ratio on critical shear in rotational and irrotational
shear fields (Grace 1982). ... 12 Figure 2-7. Continuity index of EPDM in non-plasticized and plasticized PP/EPDM blends
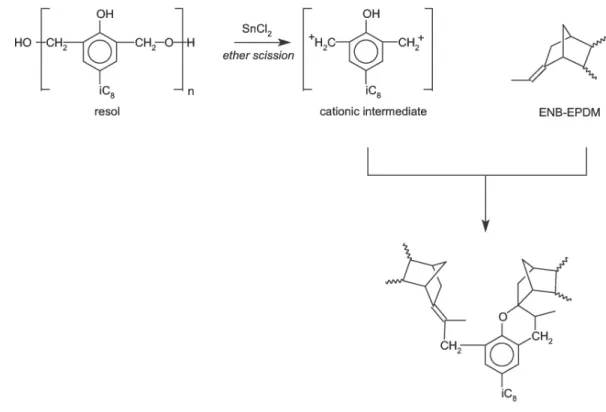
(Shant. Shahbikian, 2010). ... 14 Figure 2-8. Phase inversion predictions for different viscosity based-models as well as the ... 18 Figure 2-9. Simplified mechanism of SnCl2-activated resole crosslinking of ENB-EPDM (M.
Van Duin & Machado, 2005) ... 21 Figure 2-10. Change of the extent of EVA crosslinking in the internal mixer (Agnès Verbois,
2004) ... 24 Figure 2-11 1H MAS NMR spectrum of thermoset rubber (before extraction) (Ellul, Tsou, & Hu,
2004). ... 25 Figure 2-12. 1H MAS spectra of EPDM samples (after extraction), with Different phenolic resin
content (Ellul, Tsou, & Hu, 2004) ... 26 Figure 2-13. Schematic representation of deformation mechanism in TPVs (C. Boyce, Socrate,
Figure 2-14.Strain-permanent set curve generated from the modified hysteresis tensile test (Cai, Reid, Srinivasan, & Vennemann, 2004). ... 30 Figure 2-15. Temperature-recoverable stress ratio curve from a TSSR test (Cai, Reid, Srinivasan,
& Vennemann, 2004) ... 31 Figure 2-16. Storage modulus and dynamic viscosity of EPDM/PP TPVs of different
compositions at 220°C: 20/80 ♦; 40/60 ▼; 60/40 ● , (w/w) (Goharpey, Nazockdast, & Katbab, 2005) ... 32 Figure 2-17. Torque evolution during the reaction between EMA and pentanediol at different
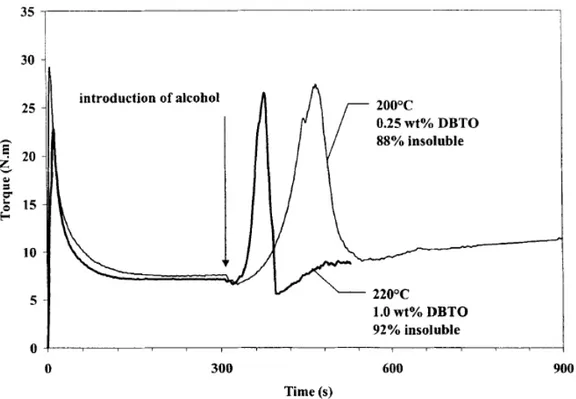
temperatures and DBTO contents (Pesneau, Champagne, & Huneault, 2002). ... 34 Figure 2-18.Different rheological results on the bulk EVA cross-linking at different temperatures
and catalyst concentration (Verbois, Cassagnau, Michel, Guillet, & Raveyre, 2004). ... 35 Figure 2-19. Evolution of dynamic viscosity with time for non reactive blend as compared to the
same system, dynamically cross-linked at 78% insoluble (Pesneau, Champagne, & Huneault, 2002). ... 36 Figure 2-20. TEM micrographs of samples taken at L/D= 8, 9, 10 and 15 upon dynamic
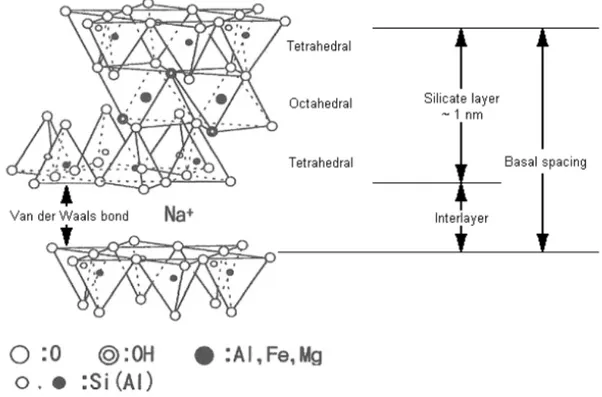
vulcanization of PE/EPDM blend (50/50; w/w) (M. Van Duin & Machado, 2005). ... 38 Figure 2-21. Schematic illustration of atoms arrangement in a typical MMT layer(Sinha Ray &
Okamoto, 2003) ... 39 Figure 2-22. Schematic representation of clay surface treatment (Dell'Anno, 2004) ... 40 Figure 2-23. Principle of X-ray diffraction (Kornmann, 1999). ... 43 Figure 4-1. Thermo-gravimetric analysis of Cloisite 15A. ... 62 Figure 4-2. XRD patterns of Cloisite 15A and nanocomposites at different scan range. ... 64 Figure 4-3. TEM micrographs of PP nanocomposites. ... 65 Figure 4-4. SEM images of PP Nanocomposites after removing the amorphous phase. ... 66 Figure 4-5. XRD patterns of TPE nanocomposites at different EPDM content. ... 67 Figure 4-6. Complex viscosity as a function of angular frequency for pure compatibilizers... 69
Figure 4-7. Normalized stress relaxation modulus as a function of time for pure compatibilizers. ... 71 Figure 4-8. . Complex viscosity as a function of angular frequency for PP nanocomposites. ... 72 Figure 4-9. The continuity indices of EPDM (a) from non-crosslinked specimens and PP (b) from
irradiated samples (corrected for thermoplastic phases solubility in cyclohexane at room temperature, and irradiated EPDM solubility in xylene). ... 73 Figure 4-10. SEM micrographs of TPE nanocomposites after partial PP matrix dissolution. (a)
exfoliated system TPEN3.50, (b) intercalated system TPEN4.50... 73 Figure 4-11. Normalized stress growth viscosity as a function of time for (a)TPENx.50 and (b)
TPENx.70 . ... 74 Figure 4-12. Micrographs of TPE nanocomposites after PP dissolution for (a) semi exfoliated
system TPEN1.70, (b) intercalated system TPEN4.70 . ... 76 Figure 4-13. Micrographs of irradiated TPE nanocomposites after complete PP dissolution
(Bright spots show accumulated nanoclay agglomerates). ... 77 Figure 5-1. XRD patterns of Cloisite 15A and nanocomposites at different scan range. ... 91 Figure 5-2. TEM micrographs of PP nanocomposites. ... 92 Figure 5-3. SEM images of PP Nanocomposites after removing the amorphous phase. ... 93 Figure 5-4. Torque-time curves and temperature profiles of the reactive blends. ... 94 Figure 5-5. Gel content upon dynamic vulcanisation along the screw axis for the samples
containing 60wt% (a), 70 wt% (b) and 50 wt% (c) of EPDM. ... 95 Figure 5-6. Figure 6. Evolution of the normalized storage modulus with time for the various
reactive blends prepared by twin screw extruder, prepared by internal batch mixer at 200 °C (black) and 170 °C (gray) using 50wt% (a) and 70 wt% (b) of EPDM. ... 97 Figure 5-7. The evolution of dynamic viscosity and storage modulus with frequency. ... 98 Figure 5-8. 1H MAS NMR spectrum of EPDM and TPVN3. The upper curves are the same
spectrums as the lower curves but with higher amplification factor. ... 99 Figure 5-9. Residual diene contents of TPVs and TPV nanocomposites. ... 100
Figure 5-10. Aromatic area ratio of TPVs and TPV nanocomposites after extraction. ... 103 Figure 6-1. XRD patterns of Cloisite 15A, PP nanocomposites and TPV nanocomposites
prepared at screw speed of 200 rpm (gray) and 400 rpm (black). ... 115 Figure 6-2. TEM micrographs of N4 (a) and N3 (b and c) polypropylene nanocomposites. ... 116 Figure 6-3. SEM images of N3 (a) and N4 (b) polypropylene nanocomposites after removing the
amorphous phase. ... 116 Figure 6-4. Crosslink density values of the TPVs and TPV nanocomposites containing 50
wt%(white), 60 wt%(gray) and 70 wt%(black) of EPDM prepared by twin screw extruder. ... 118 Figure 6-5. SEM micrographs of TPV60 (X1; the first row), TPVN3.60 (X2:the second row) and
TPVN4.60 (X3:the third row) for the samples taken at the first mixing zone (a), the second
mixing zone (b), the third mixing zone (c) and the die exit (d). ... 120 Figure 6-6. Normalized force – temperature curves of TPVs and TPV nanocomposites samples
containing 50 wt%(a), 60 wt%(b) and 70 wt%(c) of EPDM obtained from TSSR measurements. ... 122 Figure 6-7. Figure 7. SEM micrographs of TPV70 (X1; the first row), TPVN4.70 (X2:the second
row) and TPVN3.70 (X3:the third row) for the samples taken at the first mixing zone (a), the
NOMENCLATURE
English letters:B Diameter of the Elongated Thread
Ca Capillary Number
Dn Number Average Diameter
Dv Volume Average Diameter
G Shear Modulus
G' Storage Modulus
G" Loss Modulus
Gv Volume Swelling Rate
l Distortion Wavelength
Mc Molecular Weight Between Two Crosslinks
N2 Second Normal Stress Difference
p Viscosity Ratio
p' Hydrostatic Pressure
q Instability Coefficient
R Universal Gas Constant
R0 Starting Sphere Radius
RI Rubber Index
t Time
T Absolute Temperature
V1 Molar Volume of the Solvent
ΔH Latent Heat of Fusion
Greek letters:
[η] Intrinsic Viscosities
α0 Amplitude of the Initial Distortion
γp Shear Rate
δ Solubility Parameter
η* Complex Viscosity
ηm Matrix Viscosity
κ Temperature Coefficient
λ Viscosity Ratio Or Strain Ratio
λ1 Wavelength
μ Crosslink Density
ρ Density
σ Interfacial Tension
τi Gel Content
υ Volume Fraction
χ Flory-Huggins Interaction Parameter
Ω Tomokita Function
ω Frequency
Ф Continuity Index or Continuity Fraction List of Abbreviations:
CEC Charge Exchange Capacity
DBTO Dibutyltin Oxide
DCPD Dicyclopentadiene
DMA Dynamic Mechanical Analysis DSC Differential Scanning Calorimetry
EMA Ethylene Methacrylate
ENB Ethylidene Norbornene
EPDM Ethylene Propylene Diene Terpolymer EPR Ethylene Propylene Rubber
EVA Ethylene-Vinyl Acetate
FTIR Fourier Transform Infrared Spectroscopy
HD Hexadiene
IPB Interpenetrating Polymer Blends IPN Interpenetrating Polymer Network IPS Interpenetrating Phase Structure
MMT Montmorillonite
NMR Nuclear Magnetic Resonance
NR Natural Rubber
PE Polyethylene
PLS Polymer Layered Silicate
PP Polypropylene
PP-g-MA Polypropylene-Grafted-Maleic Anhydride PSA Pressure Sensitive Adhesives
PVC Polyvinyl Chloride
SBR Styrene Butadiene Rubber SBS Styrene Butadiene Styrene
SEBS Styrene Ethylene/Butylene Styrene SEM Scanning Electron Microscope SIS Styrene Isoprene Styrene
TEM Transmission Electron Microscopy TGA Thermogravimetric Analysis
TPE Thermoplastic Elastomeric Material TPV TheRmoplastic Vulcanizate
TSSR Temperature Scanning Stress Relaxation
VNB Vinylidene Norbornene
Chapter 1 INTRODUCTION AND OBJECTIVES
1.1 Introduction
Thermoplastic Elastomeric Materials (TPEs) are a class of copolymers or polymer blends which show the processing characteristics of a thermoplastic and functional performance of a conventional thermoset rubber. TPEs usually have a two-phase structure, an elastomeric phase giving the material the rubber-like properties and a stiffer thermoplastic phase that operates as a physical cross-linker for the rubber phase. This phase melts at elevated temperature and TPE becomes processable(Borcea, 2008).
No curing step during processing, the ease of tailoring the properties by adjusting the hard/soft ratio and by the addition of processing oil and/or solid fillers, simple and fast processing, low energy consumption and recycle ability are some advantages of TPEs compared to thermoset rubbers. Some disadvantages also exist, for example, elastomeric recovery may not be as good as thermoset rubbers, another one is related to the application temperature of these compounds due to the physical nature of the cross-links in the TPEs (Lebel, 1994).
Generally, depending on the connection of the soft and the hard phases thermoplastic elastomers can be classified into two main categories: Block copolymers and thermoplastic elastomer blends. Block copolymers are the most widely used TPEs. They are characterized by their molecular architecture, which has a “hard” thermoplastic segment (block) and a “soft” elastomeric segment (block). The formation of the two phase structure occurs by the lack of miscibility of the hard and soft segments or by crystallization of the hard segments. The properties of these TPEs can be tailored by the choice of monomer types, the hard/soft ratio and the positions of the hard and soft segments within the polymer chain (Drobny, 2007). Styrenic block copolymers and thermoplastic polyurethanes are well-known examples of common TPEs. Styrenic TPEs are usually styrene ethylene/butylene styrene (SEBS), styrene butadiene styrene (SBS) and styrene isoprene styrene (SIS). The polystyrene end-blocks form a reversible physical network that provides thermo-plasticity feature for processing. With cooling, the reformation and hardening of the polystyrene domains create a rubber network in position. Principal styrenic TPE markets are : extruded film/sheet and wire/cable covering, pressure sensitive adhesives (PSA),
grips, molded shoe soles and other footwear, kitchen utensils, hot-melt adhesives and asphalt modifiers (Drobny, 2007; Sengers, 2005).
The second most widely used TPEs on a tonnage basis (worldwide consumption of about 687000 tons with an annual average growth rate of about 7% in 2009) are thermoplastic elastomer blends that are made by melt mixing of a thermoplastic polymer such as polypropylene (PP), polyethylene (PE), polyvinyl chloride (PVC) or a polyamide with an elastomer such as ethylene propylene rubber (EPR), ethylene propylene diene monomer (EPDM), styrene butadiene rubber (SBR), ethylene-vinyl acetate (EVA) or natural rubber (NR) (Drobny, 2007; M. Van Duin & Machado, 2005). TPE blends are all phase separated systems in which their two-phase structures are obtained by the lack of miscibility of the rubber and the thermoplastic phase. A prerequisite for these blends is that the thermoplastic polymer is continuous (Bhadane, 2005).
Among the different types of thermoplastic elastomer blends, thermoplastic vulcanizates (TPVs) with the improved rubber like behavior are prepared by dynamic vulcanization which was claimed first by Gessler et al. and Fischer (Fischer & Woodbury, 1974; GessIer & Haslee, 1962). By definition, the process of dynamic vulcanization consists of crosslinking an elastomer during its melt blending with a thermoplastic polymer, which often leads to fully vulcanized and finely dispersed rubber droplets in the thermoplastic matrix (Ellul, Tsou, & Hu, 2004; Harrats, Thomas, & Groeninckx, 2006). Coran and Patel showed that, in theory, a large number of elastomers and thermoplastics could be dynamically vulcanized to produce different TPVs. However, practically the best chemical and physical properties of these materials were obtained with a TPV based on ethylene–propylene diene terpolymer EPDM and polypropylene PP (Aubert Y. Coran & Patel, 1978). The focus lies here on this type of TPEs that have gained wide acceptance because of their rubber-like properties. TPV based on PP and EPDM is one of the most studied TPVs in the literature; the ultimate goal of these studies is to enhance their elasticity by shifting the TPV compositions towards higher EPDM contents, adjusting the level of crosslinking chemicals, molecular weight of thermoplastic phase, processing conditions and so on.
On the other hand, polypropylene layered silicate nanocomposites have similarly received much attention, due to their high performance. These two complementary technologies can come together to form TPV nanocomposites, with interesting properties that significantly depend on the final morphology in the material.
Since, nanocomposite formation is thermodynamically driven, it can occur only with a negative free energy change. Therefore, maleic anhydride-grafted polypropylene (PP-g-MA) is generally used as a compatibilizer and its effect on nanocomposite structure and mechanical properties has been investigated extensively. Nevertheless, more questions have been raised about which of the compatibilizers properties could be a good predictor of the compatibilizer effectiveness. The use of PP-g-MA affects the viscosity ratio, interfacial tension, mobility of the interface and the degree of exfoliation. Consequently, the co-continuous composition range changes. Thus, the effect of the different compatibilizers on the blend morphology should be addressed.
It should be mentioned that a number of studies, related to the TPV nanocomposites field, investigated the effect of nanoclay presence on non-reactive systems and/or in processing reactive systems in internal batch-mixers. Therefore, more studies are needed to obtain better insight into the effect of nanoclay presence and its dispersion level in reactive extrusion of these materials while dynamic vulcanization in extruders proceeds quite differently from that in batch mixers. It is necessary to make the crosslinking kinetics compatible with the shorter residence times used in the extruder.
It was indicated that increasing the cross-link density results in enhanced TPV nanocomposite elasticity, but only to a certain level. An important research question is how can the elasticity be further improved to the level of thermoset elastomers, in order to exploit the TPV nanocomposite to their maximum potential and to develop their fields of applications?
In view of the above considerations, the following objectives are identified for the present research project.
1.2 Objectives
1.2.1 Main Objective
The main objective of this study is to determine the fundamental parameters affecting
the elasticity of thermoplastic vulcanizate nanocomposites prepared by reactive extrusion for molding applications.
1.2.2 Specific Objective
To achieve this objective, the following scientific and technical issues are addressed as the specific objectives. The various components of the project are guided by available literature and the results are analyzed in light of theoretical and quantitative principles.
i. To determine a compatibilizer (PP-g-MA) property as a good predictor of the compatibilizer effectiveness.
ii. To investigate the influence of the compatibilizer on co-continuous composition range. iii. To study the thermal and rheological characteristics of TPE and TPV nanocomposites
prepared with different compatibilizers.
iv. To study the dynamic vulcanization and morphology evolution along the extruder axis. v. To assess the effects of nanoclay dispersion level in thermoplastic phase on dynamic
vulcanization of TPV nanocomposites prepared by reactive extrusion.
vi. To investigate the rubber like behavior and functional/mechanical properties of TPV nanocomposites.
vii. On the basis of the above findings, to propose a combination of composition(s) and processing variables to produce superior TPVs for molding applications.
Chapter 2 LITERATURE REVIEW
2.1 Morphology Formation in Dynamically Vulcanized PP/EPDM
Most commercial polymer blends are known as immiscible blends forming multi-phase structures due to their high molecular weight and unfavorable interactions. Different parameters determine the properties of multiphase materials. The most important one is the blend morphology created during the melt mixing process. On the other hand, morphology development is controlled by the rheological properties of the components, by the blend composition, by the interfacial tension and by the processing conditions. According to Potschke and Paul (Potschke & Paul, 2003), the final morphology obtained after mixing of immiscible polymer pairs can be grouped into four basic structures (Figure 2.1):i. Matrix-dispersed particle structure ii. Matrix-fiber structures
iii. Lamellar structures iv. Co-continuous structures
Dynamic vulcanization is the major step dictating morphology development of TPVs (especially in the co-continuous structure composition range), however, it should be noted that this process is not the initial step in TPV production process. Normally, thermoplastic and elastomer components are melt blended in the first stage and consequently the cross-linking agents are introduced into the mixture (Goharpey, Katbab, & Nazockdast, 2001). Therefore, the first stage of TPV production is not indeed different from TPE blends production.
Figure 2-1.Types of morphology in immiscible blends. (a) dispersed structure; (b) Matrix-fiber structures; (c) lamellar structure; (d) co-continuous structure(Potschke & Paul, 2003)
Ideally, the elastomer should be present as finely dispersed particles in a small amount of polymer. The cross-linked elastomer particles promote the blend elasticity and prevent coalescence. In contrast, if the cured elastomer phase is continuous, the resulting compound cannot be reprocessed. Therefore, in cases where the elastomer is the major component, the development of co-continuity is critically important, since the dynamic vulcanization can be considered as the driving force for phase inversion, i.e., when the morphology changes from a dispersed-matrix type to a co-continuous type or vice versa (Potschke & Paul, 2003).
To have a better insight about the co-continuous structure composition range, the co-continuous structure is defined in the next section.
2.1.1 Co-continuity and its Importance on the Final TPVs Morphology
According to Paul and Potschke, there are two definitions of the co-continuous structure. The classic definition describes an ideally co-continuous structure as the coexistence of at least two continuous structures within the same volume; in other words co-continuous structures would be observed when both components have three-dimensional spatial continuity on some finite scale of mixing. In the literature, co-continuous phase structures are also described as interpenetrating polymer networks (IPNs), interpenetrating phase structures (IPSs) or interpenetrating polymer blends (IPBs) (Potschke & Paul, 2003). There is general agreement in the literature that co-continuity is related to this definition.
The second definition is based on the percolation threshold theory and considers that the structures formed by melt mixing of polymers represent a coexistence of different structure types rather than an ideal network. Lyngaae-Jorgensen et al. (Lyngaae-Jorgensen, Lunde Rasmussen, Chtcherbakova, & Utracki, 1999) define a co-continuous structure as one wherein at least a part of each phase forms a coherent continuous structure permeating the whole volume. This definition also allows some part of the components to exist in separate domains that are not part of the network structure.
Figure 2.2 shows the critical volume fraction
φ
cr, or percolation threshold is the volumefraction at which the transition from a structure containing only discrete domains of one phase to a system containing one infinite structure (and discrete domains) takes place. Increasing of the proportion of the minor component incorporated in the percolation structure makes a fully co-continuous structure. Lyngaae-Jorgensen et al. define the continuity index or continuity fraction (
I
φ ) that stands for the portion of a component that is part of percolating structure. The first definition is a special case of the second, when the continuity fraction is equal to one for both phases (Lyngaae-Jorgensen & Utracki, 2003).
Figure 2-2. Co-continuous structure composition range using definition 1 and definition 2 (Potschke & Paul, 2003)
It is desirable to shift the TPV composition towards higher EPDM contents in order to have TPVs with enhanced elasticity. However, melt processability requires a certain degree of thermoplastic phase continuity. As seen later in the present study, the co-continuous structure forming in the initial step of TPV production is an important factor affecting the dynamic vulcanization. It should be noted that the elastomer phase changes from a viscous fluid to an elastic solid due to the dynamic vulcanization. The elastomer becomes rigid and cannot adapt to the applied stress. As a result, this phase breaks up into micron-sized elastomer particles and continuity index of the rubber phase decreases in a reactive blend (Radusch & Pham, 1996). Parameters influencing on co-continuous structure will be discussed in the next section.
2.1.2 Factors Influencing the Co-continuity and Final Morphology of TPVs
2.1.2.1 Viscosity
Rigorous mixing of two molten polymers in a shear field can produce co-continuous structure, when the viscosities and volume fractions of the two components are equal. Equal volume fraction maximizes the opportunity for maintaining connectivity, because neither component is present in a minor amount. However, in most systems, the viscosities of the components are different. To minimize the energy dissipation during the mixing, the low-viscosity phase tends to be continuous. Therefore to keep the connectivity of the phases and to counterbalance this tendency, the volume fraction of the higher-viscosity component has to be increased (Potschke & Paul, 2003). This fact is the basis for some of the phase inversion equations (Figure 3). So the viscosity ratio is one of the most important parameters to control the final morphology.
Figure 2-3. Relation between the volume range of co-continuous structures and viscosity ratio (M. Van Duin & Machado, 2005)
In the case of PP/EPDM blends this would mean that if the viscosity of the PP is reduced, a higher amount of rubber can be dispersed before rubber-matrix state is reached. Even when the rubber-matrix is reached, crosslinking can develop the co-continuity, for example Abdou-Sabet et al. studied the morphology of PP/EPDM blends containing 80 vol% rubbers. In the uncured
blends, polypropylene was the minor component, dispersed in the EPDM matrix. However, the morphology of the TPVs showed that in the initial step of the dynamic vulcanization of the rubber phase, co-continuous structure was first produced and, as the degree of vulcanization of the rubber increased, the continuous rubber phase became elongated more and more and then broke up into EPDM droplets. As the rubber droplets continued to form, the polypropylene phase grew to become the continuous phase (Abdou-Sabet & Patel, 1991).
Karger-Kocsis et al. investigated the effect of viscosity ratio on dispersion of EPDM particles in PP matrix. They observed that the average particle size and polydispersity of EPDM particles decreased with viscosity ratio (Karger-Kocsis, Kallo, & Kuleznev, 1984). The decrease of the rubber particle size with decreasing viscosity difference between the elastomer and the plastic was reported by Goharpey et al. for TPV blends of PP/EPDM (40/60 wt%) with different viscosity ratios (Goharpey, Katbab, & Nazockdast, 2003).These observations could probably be explained by the long breakup time and capillary number.
The origin of this non-dimensional parameter comes from simple emulsions. Droplet or thread deformation is governed by capillary number (Ca) which represents the ratio of viscous forces to interfacial tension force:
σ γ
η R0
Ca= m p (2-1)
where ηm is the matrix viscosity, γp is the shear rate, R0 is starting sphere radius and σ is the
interfacial tension. Considering the capillary number, the mixing process can be divided into two regimes: when the capillary number Ca>>1, it implies distributive mixing leading to rearrangement and deformation of the phases. The second regime is dispersive mixing with Ca<1. In this condition, breakup happens and leads to a reduction in phase size(Willemse, de Boer, van Dam, & Gotsis, 1998). Furthermore, in polymer blending, two main breakup mechanisms have been observed. The first one involves the breakup process of the droplets into (mostly) two droplets above a critical Cacrit value, where the shear stress exceeds the interfacial
stress. The second mechanism, that seems to be more realistic, is the breakup of highly elongated threads via capillary instabilities. Consequently, a line of smaller droplets would be formed Figure 2.4 shows the mentioned mechanisms schematically. (Janssen & Meijer, 1993; Potschke & Paul, 2003).
Figure 2-4. Schematic representation of the two dispersion mechanisms: Left, the stepwise equilibrium mechanism of repeated breakup at Cacritical,; right, the transient mechanism of thread
breakup during extension (Janssen & Meijer, 1993).
The diameter of the elongated thread B is a function of the total amount of strain imposed. Assuming affine deformation, it is determined as follows:
4 1 2 0(1 ) 2 + − = R γ B (2-2)
where γ is γpt and t is time.
During the mixing process when the stretching increases, the local capillary number decreases. The stability of the filament is expected as long as the local capillary number of the thread is greater than one. In this condition, the filament does not break up. Therefore, high matrix viscosity, high shear rate, large starting droplet sizes and low interfacial tensions favor the generation of co-continuous structure, which is made by the stable threads. After a certain thread diameter that leads to Ca less than one, breakup occurs, if the residence time during the mixing process is higher than their breakup time (Potschke & Paul, 2003). The breakup time is obtained by: ) 2 8 . 0 ln( ) ) , ( ( 0
α
σ
λ
η
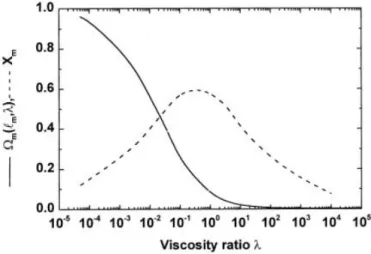
B l B t m b = Ω (2-3)where α0 is the amplitude of the initial distortion and Ω(l,λ) is the Tomokita function which is a
dimensionless distortion growth rate, depending on the distortion wavelength l and the viscosity ratio λ (See Figure 2.5). The factors influencing the breakup process are indicated by this equation. Breakup is less likely at low interfacial tension and high thread diameters. High matrix
viscosity should lead to long breakup times, but this term is already included in Ω(l,λ), which increases with decreasing viscosity ratio. To get a low value of Ω(l,λ), thread viscosity should be high and the matrix viscosity has to be low.
Figure 2-5. Distortion growth rate at dominant wavelength and dominant wave length vs λ (Potschke & Paul, 2003)
It is noteworthy to mention that the critical capillary number also depends on the type of flow; as seen in figure 2.6, the elongational flow field is much more effective for droplet breakup in a dispersive mixing regime (Grace 1982).
Figure 2-6. Comparison of effect of viscosity ratio on critical shear in rotational and irrotational shear fields (Grace 1982).
2.1.2.2 Interfacial Tension
Interfacial tension is an important factor that could be consider as a driving force for the transformation of a co-continuous structure into a dispersed one (Li, Ma, & Favis, 2002). It is known that low interfacial tension reduces the rate of breakup and facilitates the formation of co-continuous structure. The effect of interfacial tension on the range of co-continuity has been studied by Willemse et al. They chose different pairs of polymers having different interfacial tension but the same viscosity ratio. They found that in systems with higher interfacial tension, the onset volume fraction of co-continuity (percolation onset) was higher, the co-continuity range was narrower, the stability of morphology was lower and the phase dimensions were larger, compared to systems with low interfacial tension. This behavior was similar for both high viscosity ratio and low viscosity ratio systems (Willemse, de Boer, van Dam, & Gotsis, 1998). For blends with compatibilizers at the same viscosity ratio, the broadness of the co-continuity was directly related to the interfacial tension, but the same phase inversion as uncompatibilized blends was observed (Bourry & Favis, 1998). On the other hand, the effect of elasticity is considered as an apparent increase in interfacial tension, where a droplet of higher elasticity than the matrix is stabilized against deformation and breakup during flow (Potschke & Paul, 2003). 2.1.2.3 Processing Conditions and Other Parameters
The co-continuous structure as intermediate structure could be formed during the initial stages of morphology development .Even at low volume fractions of one component, stable co-continuous morphologies can be observed using suitable processing conditions. Goharpey et al. studied the morphology development of PP/EPDM (40/60, wt. %) during mixing. Samples were taken from a hot running mixer and rapidly quenched in liquid nitrogen, before and after the onset of rubber vulcanization. They demonstrated that the rubber domains were dispersed throughout the polypropylene matrix for the unvulcanized but frozen samples. However, the unfrozen blends showed a co-continuous morphology. For the dynamically vulcanized blends, they also showed that the rubber phase that finally formed the dispersed phase was the one that had formed the matrix in early mixing stages. (Goharpey, Nazockdast, & Katbab, 2005).
There are two different mechanisms for co-continuity development. The first is thread-thread coalescence for low-interfacial tension systems, while the second is droplet-droplet coalescence for high interfacial tension systems. It has been mentioned that the possibility of
coalescence of dispersed phase and dispersed phase percolation rate determine the co-continuity broadness .Therefore, the shift of co-continuity is not only related to rheological properties of both components, but also to the degree of mobility of the interface. Willis et al. suggested that factors, that limited coalescence phenomenon in a polymer blend decreased the co-continuity range of the blend (Willis & Favis, 1988).
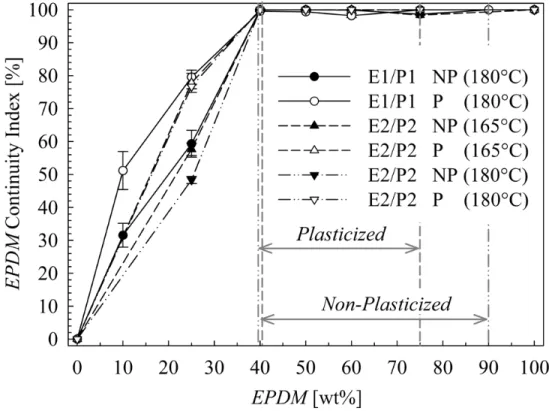
Finally, any parameter, that affects the viscosity ratio or elasticity ratio of a particular blend, would be expected to produce a change in both the co-continuity interval and the final morphology. For instance, plasticizers can affect dramatically the rheological properties of polymers. Shahbikian et al.(Shant Shahbikian et al., 2011a) covered the relationship between rheology of immiscible blends based on ethylene-propylene-diene-terpolymer and polypropylene, in the presence and absence of a paraffinic plasticizer. In the morphological part of their research, based on a solvent extraction method, they showed that the plasticization led to the better interconnectivity of the elastomeric phase and consequently a more rapid percolation of the rubber component at low EPDM content compared to the corresponding blends without plasticizer (Figure 2.7).
Figure 2-7. Continuity index of EPDM in non-plasticized and plasticized PP/EPDM blends (Shant. Shahbikian, 2010).
Furthermore, a comparative study on the morphology development of reactive and nonreactive EPDM/PP blends, using an internal mixer and a twin-screw extrusion showed that the intensive flow field inside the twin screw extruder resulted in a finer morphology in comparison to the internal mixer. The interconnectivity of the EPDM domains to some extent was observed even for dynamically cross-linked blends (TPVs) due to the plasticizer presence (Shant. Shahbikian, 2010; Shant Shahbikian et al., 2011b).
2.1.3 Equations for the Phase Inversion and Co-continuous Composition
It is of interest to determine which phase will form the matrix and at which composition co-continuity can be formed. A number of studies have been carried out over the last 30 years to estimate the phase inversion composition (φPI) and to compare these estimates with experimental results. Generally, phase inversion compositions are given in the literature, and co-continuous composition range can be expected within a composition region about φPI. The breadth of co-continuity depends not only on material and processing parameters but also on the experimental concentration step size used. The following simple equation, suggested first by Avgeropoulus et al., relates the phase inversion composition to volume fractions and viscosities:
1 1 2 , , 2 , 1 × ≅ η η φ φ PI PI (2-4)
where
φ
i,PI is a volume fraction at phase inversion and ηi is the viscosity of the component i.This equation can be simplified using λ=η1/η2 and
φ
1,PI=
1
−
φ
2,PI (Avgeropoulos, Weissert, Biddison, & Boehm, 1976) :)
1
/(
1
, 1λ
φ
PI=
+
(2-5)The viscosity ratio of the non-Newtonian blends should be evaluated at the shear stress used for preparation of the blends. Avgeropoulus used the torque ratio rather than the viscosity ratio. Because the basic equation was proposed for systems with almost the same viscosity, there is considerable deviation for the polymer blends in which the viscosity ratio of the components is very different from unity. Therefore a number of researchers have developed the relations, to obtain a good representation of the experimental data. These modified relations have the following general form:
φ
1,PI/φ
2,PI = A(τ
1/τ
2)B (2-6)Where A and B are fitting parameters. For example, according to Ho et al. A and B are 1.22 and 0.29, respectively, where the subscript 1 represents EPR and subscript 2 represents PP (Ho, Wu, & Su, 1990). Utracki obtained better fits by an approach based on “intrinsic viscosities” [η] and maximum packing volume fraction
φ
m. The equation involves the viscosity concentration dependence. His assumption was based on equal blend viscosities resulting from addition of polymer 2 into polymer 1 and vice versa at the phase inversion composition. Using this assumption the following equations were proposed (L. A. Utracki, 1991) :(
)
(
)
[ ]m PI m PI m φ η φ φ φ φ λ − − = , 1 , 2 (2-7)[ ]
2 ) / log 1 ( , 2 η λ φ PI = − (for 0.1<λ<10 ) (2-8)where [η] was assumed to be 1.9 for spherical domains and
φ
m=
0
.
84
. It has been mentioned that interfacial tension effects can also be taken into account using proper expressions for [η]. In another attempt Metelkin and Blekht assumed that the breakup times of one material in the other are equal at the phase inversion composition. They derived a relation for the phase inversion volume fraction in terms of the viscosity ratio and a function of viscosity ratio F(λ) (Metelkin & Blekht, 1984). 1 , 2 (1 ( ) ) − × + =λ
λ
φ
PI F (2-9)F(λ) could be determined theoretically from consideration of stability of individual layers or by
following function proposed by Utracki :
2
)]
[log(
8
.
1
)
log(
2
.
2
1
)
(
λ
=
+
g
λ
+
λ
F
(2-10)Luciani and Jarrin considered that co-continuous morphology is governed by the stability of fibrillar structures in three dimensions. They assumed that stability for both fibrillar structure networks is equal. the instability coefficient (q) or growth rate is defined as (Luciani & Jarrin, 1996).