SYNCHROPHASOR DATA ANALYTICS FOR CONTROL AND PROTECTION APPLICATIONS IN SMART GRIDS
SEYED YOUNES SEYEDI
DÉPARTEMENT DE GÉNIE ÉLECTRIQUE ÉCOLE POLYTECHNIQUE DE MONTRÉAL
THÈSE PRÉSENTÉE EN VUE DE L’OBTENTION DU DIPLÔME DE PHILOSOPIAE DOCTOR
(GÉNIE ÉLECTRIQUE) JUIN 2017
c
ÉCOLE POLYTECHNIQUE DE MONTRÉAL
Cette thèse intitulée :
SYNCHROPHASOR DATA ANALYTICS FOR CONTROL AND PROTECTION APPLICATIONS IN SMART GRIDS
présentée par : SEYEDI Seyed Younes
en vue de l’obtention du diplôme de : Philosophiae Doctor a été dûment acceptée par le jury d’examen constitué de :
M. MAHSEREDJIAN Jean, Ph. D., président
M. KARIMI Houshang, Ph. D., membre et directeur de recherche M. SHESHYEKANI Keyhan, Ph. D., membre
DEDICATION
ACKNOWLEDGEMENTS
I would like to give my thanks to my professors: Dr. Houshang Karimi, and Dr. Jean Mah-seredjian for their supervision, trust, and constant support of this PhD project. I would also like to express my gratitudes to all those at Polytechnique Montreal, and the jury members who have made this thesis possible: Dr. Innocent Kamwa and Dr. Keyhan Sheshyekani. Finally, with special thanks to Dr. Josep M. Guerrero and Dr. Santiago Grijalva who par-ticipated in this research, as the project would not have been thriving without their expertise.
RÉSUMÉ
Des réseaux intelligents sont des réseaux d’énergie fortement distribués où les technologies d’énergie et des services sont intégrés avec des informations, des communications et contrô-lent des technologies. Puisque les sources d’énergie renouvelable deviennent plus efficaces et rentables, les réseaux intelligents peuvent livrer la puissance propre, durable, sécuritaire, et fiable aux consommateurs. Cependant, l’utilisation rapide de sources d’énergie renouvelable provoque des défis techniques en termes de surveillance, le contrôle et la protection des réseaux électriques. En fait, l’énergie renouvelable implique les phénomènes qui sont naturellement stochastiques comme la lumière du soleil et le vent. Donc, les réseaux intelligents devraient être capables de surveiller et répondre aux changements tant dans fournisseur d’énergie que dans la demande. L’évolution des réseaux électriques provoque aussi le déploiement de nom-breuses unités de mesure sans précédent et d’intelligents appareils de mesure. En vertu des systèmes de communications, les signaux en temps réel et les données peuvent être échangés entre les composants des réseaux intelligents. Le flux de données en temps réel fournit une occasion unique pour des applications axées sur les données et des outils pour démultiplier la modernisation de réseaux et la résilience.
Les unités de mesure de phaseur sont les dispositifs spécialisés qui acquièrent le phaseur synchronisé (synchrophasor) des données des réseaux électriques. L’analytique de données Synchrophasor peut potentiellement étre plus performant que des méthodes traditionnelles en termes de prise de décisions. Spécifiquement, l’analytique de données est des approches qualitatives/quantitatives et les algorithmes qui rassemblent et traitent des données pour en fin de compte améliorer la conscience situationnelle dans des réseaux électriques. Motivé par ce fait, cette thèse présente des solutions viables pour l’analytique de données synchrophasor dans le but d’améliorer la surveillance, le contrôle et la protection de réseaux de distribution.
La thèse se concentre sur trois fonctionnalités qui sont portées de basé sur l’analytique de données synchrophasor: Détection de perturbation centralisée, surveillance de production décentralisée (PD) et la protection “backup” coordonnée. L’objectif de surveillance de per-turbation est de réaliser la détection rapide et fiable de tension/des déviations de fréquence qui affectent la stabilité de réseau. La surveillance de PD est liée à la détection de la présence/absence de ressources énergétiques pour la gestion du flux de puissance. La per-turbation et des outils de surveillance de PD fraient la voie pour la protection adaptative
de secours de réseaux de distribution actifs. Le plan de protection adaptatif de secours as-sure la stabilité de post-défaut en détectant des défauts de ligne dans un temps de tolérance permis. La coordination entre le contrôle et des systèmes de protection de secours mène à la récupération rapide de tension/la fréquence et minimise la panne de courant. L’efficacité et la fiabilité des méthodes développées et des algorithmes sont validées par des simulations informatiques vastes basées sur des différents benchmarks.
ABSTRACT
Smart grids are highly distributed energy networks where energy technologies and services are integrated with information, communications and control technologies. As renewable energy sources are becoming more efficient and cost–effective, the smart grids can deliver safe, clean, sustainable and reliable power to consumers. However, the rapid utilization of renewable energy sources brings about technical challenges in terms of monitoring, control, and protection of power systems. In fact, renewable energy involves phenomena which are naturally stochastic such as sunlight and wind. Therefore, the smart grids should be capable of monitoring and responding to changes in both power supply and demand. The evolution of the power systems also gives rise to deployment of unprecedented number of measurement units and smart meters. By virtue of communications systems, real-time signals and data can be exchanged between components of the smart grids. The flow of real-time data provides a unique opportunity for data-driven applications and tools to leverage grid modernization and resiliency.
Phasor measurement units are specialized devices that acquire synchronized phasor (syn-chrophasor) data from the power systems. Synchrophasor data analytics can potentially outperform traditional methods in terms of decision making. Specifically, data analytics are qualitative/quantitative approaches and algorithms that collect and process data to ul-timately improve situational awareness in the power systems. Motivated by this fact, this thesis presents viable solutions for synchrophasor data analytics with the aim of improving monitoring, control and protection of power distribution grids.
The thesis focuses on three functionalities that are carried out based on synchrophasor data analytics: Centralized disturbance detection, monitoring of distributed generation (DG) sys-tems, and coordinated backup protection. The objective of disturbance monitoring is to achieve fast and reliable detection of voltage/frequency deviations that affect the network stability. The DG monitoring is concerned with detecting presence/absence of energy re-sources for management of the flow of power. Disturbance and DG monitoring tools pave the way for adaptive backup protection of active distribution networks. The adaptive backup protection scheme ensures the post-fault stability by detecting line faults within a permissible tolerance time. The coordination between control and backup protection systems leads to fast recovery of voltage/frequency and minimizes power outage. The efficacy and reliability of the developed methods and algorithms are validated by extensive computer simulations based on different benchmarks.
TABLE OF CONTENTS
DEDICATION . . . iii
ACKNOWLEDGEMENTS . . . iv
RÉSUMÉ . . . v
ABSTRACT . . . vii
TABLE OF CONTENTS . . . viii
LIST OF TABLES . . . xii
LIST OF FIGURES . . . xiii
LIST OF SYMBOLS AND ABBREVIATIONS . . . xvii
CHAPTER 1 INTRODUCTION . . . 1
1.1 The Vision for Future Power Grids . . . 1
1.2 The Era of Big Data in Smart Grids . . . 2
1.3 Statement of the Problem . . . 3
1.4 Thesis Objectives . . . 4
1.5 Methodology . . . 5
1.5.1 Data Acquisition . . . 6
1.5.2 Data Analytics . . . 7
1.5.3 Control and Protection Applications . . . 7
1.6 Thesis Contributions . . . 8
1.7 Thesis Outline . . . 9
CHAPTER 2 A REVIEW ON THE SYNCHROPHASOR TECHNOLOGY . . . 11
2.2 Hierarchical and Droop-Based Control in Smart Grids . . . 11
2.3 Synchrophasor Networks . . . 14
2.3.1 Synchrophasor Data Acquisition . . . 15
2.3.2 Synchrophasor Data Communications . . . 17
2.4 Existing Trends and Applications . . . 18
2.4.1 Control Methods Based on Data Communications . . . 18
2.4.2 State Estimation Applications . . . 19
2.4.3 Monitoring Applications . . . 20
2.4.4 Protection Applications . . . 21
2.4.5 Big Data Learning . . . 23
CHAPTER 3 CENTRALIZED DISTURBANCE DETECTION . . . 24
3.1 Introduction . . . 24
3.1.1 Disturbances in Microgrids . . . 25
3.1.2 Existing Methods . . . 25
3.1.3 Contributions . . . 26
3.1.4 List of Symbols . . . 26
3.2 Synchrophasor Data Acquisition in Smart Microgrids . . . 26
3.2.1 Parameter Estimation . . . 26
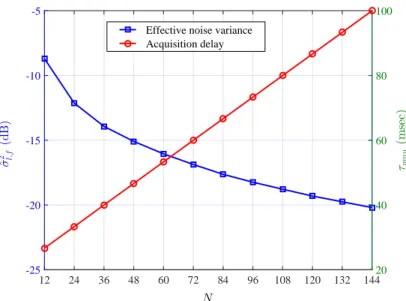
3.2.2 Noise-Delay Tradeoff in Synchrophasor Data Acquisition . . . 31
3.3 Data Communications . . . 34
3.4 Centralized Disturbance Detection . . . 36
3.4.1 Data Concentration Algorithm . . . 36
3.4.2 Central Disturbance Detector . . . 38
3.4.3 Performance Evaluation of the Central Detector . . . 39
3.5 Numerical Results . . . 40
3.5.1 Network Simulation Procedure . . . 40
3.5.2 Discussion of the Numerical Results . . . 42
CHAPTER 4 MONITORING OF DISTRIBUTED GENERATION SYSTEMS . . . 48
4.1 Introduction . . . 48
4.1.1 Literature Review . . . 49
4.1.2 Contributions . . . 50
4.1.3 List of Symbols . . . 50
4.2 Stochastic Analysis of the Phasors of CSC at the Main PCC . . . 51
4.3 Secondary Monitoring of Distributed Generation . . . 55
4.3.1 Time-Series Modeling of The Phasors of CSC at the Main PCC . . . 55
4.3.2 Parameter Estimation . . . 57
4.3.3 Secondary Monitoring Algorithm . . . 59
4.3.4 Performance Assessment of the Secondary DG Monitoring . . . 60
4.4 Real-Time DG Event Localization . . . 62
4.4.1 Local Outliers in Synchrophasor Datasets . . . 62
4.4.2 Localization Based on the Concept of Local Outlier Probability . . . 63
4.5 Simulation Results . . . 68
4.5.1 Network Simulation . . . 68
4.5.2 Monte Carlo Load Flow Simulations . . . 69
4.5.3 Time-Domain Simulations . . . 70
4.5.4 Performance Evaluation of Secondary DG Monitoring . . . 73
4.5.5 DG Localization . . . 77
4.6 Conclusion . . . 79
CHAPTER 5 COORDINATED PROTECTION AND SECONDARY CONTROL . 80 5.1 Introduction . . . 80
5.1.1 Literature Review . . . 81
5.1.2 Contributions . . . 82
5.1.3 List of Symbols . . . 83
5.2 Line Protection . . . 83
5.4 Simulation Results . . . 96
5.4.1 Network Simulation . . . 96
5.4.2 Differentiating Faults From Islanding Events . . . 98
5.4.3 Statistical Analysis of Fault Data . . . 99
5.4.4 Time-Domain Scenario I: Fault Detection by Local Relays . . . 101
5.4.5 Time-Domain Scenario II: Centralized Fault Detection . . . 104
5.4.6 Scenario III: Fault in the Presence of Machine-Based DG Systems . . 106
5.5 Conclusion . . . 109
CHAPTER 6 CONCLUSION AND RECOMMENDATIONS . . . 111
6.1 Thesis Summary . . . 111
6.2 List of Publications . . . 113
6.3 Future Works . . . 113
LIST OF TABLES
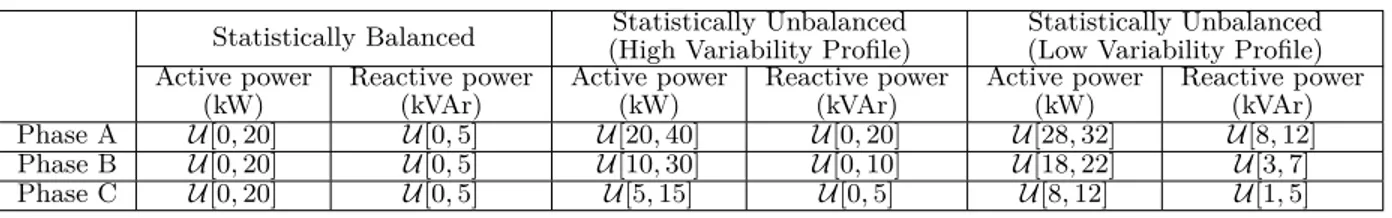
3.1 List of symbols in disturbance detection system . . . 27 4.1 List of symbols in DG monitoring system . . . 51 4.2 The distributions of the per-phase real/reactive powers of loads in
dif-ferent scenarios . . . 70 5.1 List of symbols in coordinated protection and control system . . . 84 5.2 The values of parameters for centralized fault detection simulations . 98 5.3 The real/reactive powers of inverter-based DG systems under the
nor-mal condition . . . 98 5.4 The statistics of reported voltage magnitude data for different types of
faults . . . 100 5.5 The statistics of reported frequency data for different types of faults . 101
LIST OF FIGURES
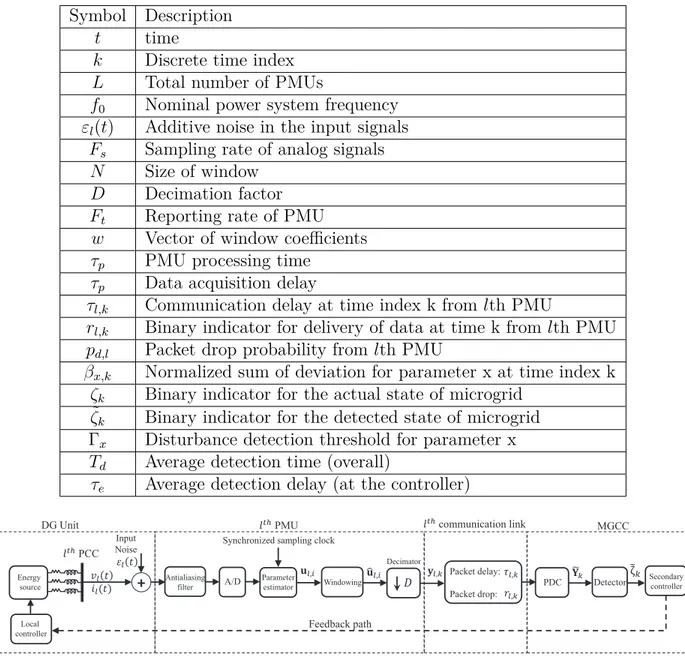
1.1 Different technologies involved in smart and modern power grids . . . 1 1.2 The functional block diagram of the proposed data processing framework 6 2.1 The three levels of the hierarchical control structure . . . 12 2.2 The generic architecture of synchrophasor networks . . . 15 2.3 The extraction of synchrophasor data packets in power systems . . . 16 3.1 Disturbance detection with noisy and intermittent synchrophasor data
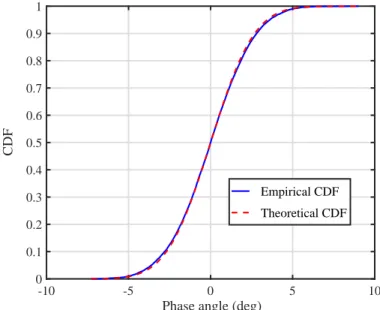
[1] . . . 27 3.2 The CDF of the noise in the phase angle data for the positive-sequence
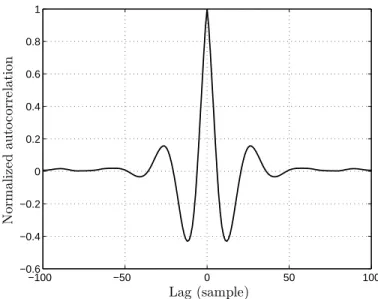
component reported by the UTSP . . . 29 3.3 The autocorrelation of the noise in frequency data estimated by the
UTSP . . . 33 3.4 Noise-delay tradeoff in the acquisition of frequency data: σ2
l = 0.05,
Fs= 900 samples/sec and τp = 20 msec . . . 34
3.5 A snapshot of spatial interpolation under a ramp of system frequency for a microgrid with 4 PMUs. The circles indicate interpolated data samples [1] . . . 38 3.6 The single-line schematic of a microgrid with a radial structure and
residential loads [1] . . . 41 3.7 Cases of fast (solid curves) and slow (dashed curves) detection under
packet dropouts. (a): The normalized sum of deviations, (b): The detected state [1] . . . 43 3.8 Probability of false detection in the central detection [1] . . . 44 3.9 Probability of false detection in the local detection [1] . . . 44 3.10 Performance comparison of interpolative and recursive PDC algorithms,
Γf = 0.5 Hz, input SNR = 19 dB [1] . . . 45
3.11 Probability of false detection vs. average detection time: σ2
l = −19
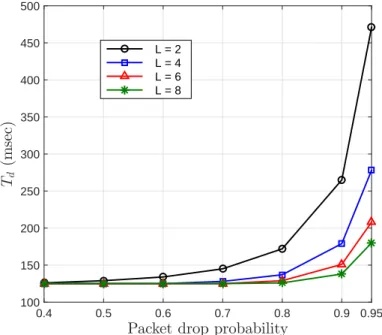
3.12 The average detection time vs. packet dropout rate, Γf = 0.1 Hz,
ΓA= 0.1 pu, input SNR = 16 dB [1] . . . . 46
4.1 The concept of secondary monitoring and control by the MGCC in the hierarchical control structure [2] . . . 56 4.2 An illustration of ambiguity in localization for a radial microgrid with
NP M U = 3 . . . 64
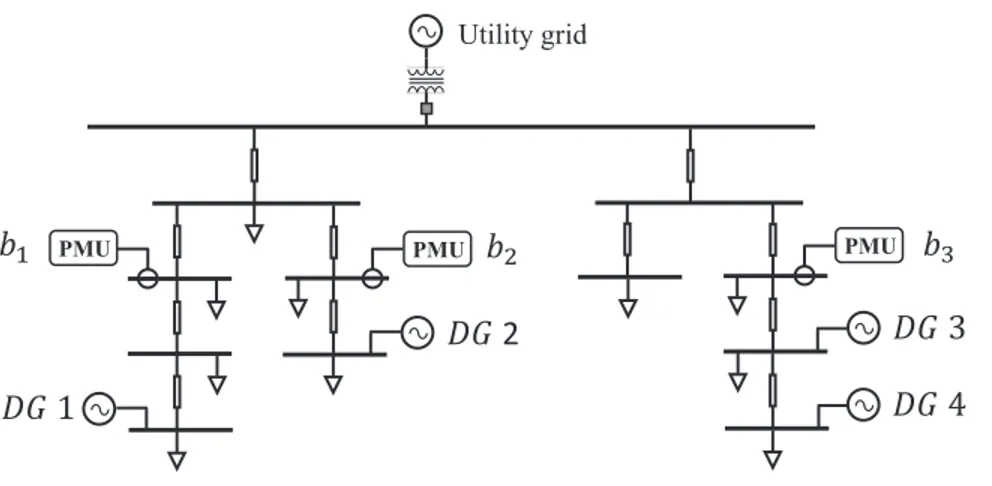
4.3 The single-line diagram of the test microgrid and the locations of DG systems and monitoring PMUs [2] . . . 69 4.4 The simulated (dashed curves) and theoretical (solid curves) CDFs of
In,r(k) at the main PCC [2] . . . . 69
4.5 The per-phase real powers generated by DG systems in the period of one day: (a) Sunny day (b) Cloudy day [2] . . . 71 4.6 DG monitoring over the time in the unbalanced scenario with the low
variability profile: R = 10−2I, N = 120, Γ = 4 [2] . . . . 72 4.7 DG monitoring over the time in the unbalanced scenario with the high
variability profile: R = 10−4I, N = 120, Γ = 4 [2] . . . . 72 4.8 DG monitoring over the time in the unbalanced scenario with the high
variability profile: R = 10−2I, N = 120, Γ = 4 [2] . . . . 74 4.9 The probability of false detection vs. the size of estimation dataset:
Unbalanced scenario with the high variability profile, R = 10−2I [2] . 75 4.10 The probability of non-detection vs. the size of estimation dataset:
Unbalanced scenario with the high variability profile, R = 10−3I [2] . 75 4.11 The efficiency of the monitoring algorithm as a function of the deviation
coefficient: Sunny day, R = 10−2I, N = 180 [2] . . . . 76 4.12 The efficiency of the monitoring algorithm as a function of the deviation
coefficient: Unbalanced scenario with the high variability profile, R = 10−3I, N = 180 [2] . . . 76 4.13 The LOPs for different observation nodes after disconnection of DG
system 1 . . . 78 4.14 The values of LOP vs. time for the observation node b3 . . . 78
5.1 The concept of coordinated protection and control based on synchropha-sor data processing in distribution grids [3] . . . 83 5.2 An example of formation of subnetworks due to a fault between buses
b0 and b2 . . . 85
5.3 The flowchart of centralized fault identification [3] . . . 86 5.4 Single-phase model of the edge (bl, bm): Zland Zmare the line impedances,
Zx,l,m denotes the load impedance [3] . . . 92
5.5 The IEEE 34-bus distribution network with DG systems, circuit break-ers, and distributed PMUs [3] . . . 97 5.6 Persistent disturbance in the frequency data when the entire network
becomes isolated from the utility grid at time t = 1 sec. (a): The mean frequency deviation, (b): The frequency disturbance counter, (c): The instantaneous range of frequency data [3] . . . 99 5.7 Incongruous disturbances in the frequency data when a three-phase
fault occurs between nodes b2 and b3 at time t = 1 sec. (a): The mean
frequency deviation, (b): The frequency disturbance counter, (c): The instantaneous range of frequency data [3] . . . 100 5.8 The Frequency data of three nodes in scenario I [3] . . . 102 5.9 Temporary disturbance in the frequency data when the network is
sub-ject to line fault in scenario I. (a) The mean frequency deviation, (b) The frequency disturbance counter [3] . . . 103 5.10 The voltage waveform of phase A of observation node b16 in scenario
I: (a) τctl,1= τctl,2 = τctl,3 = 40 msec, (b) τctl,1 = 40, τctl,2 = τctl,3 = 100
msec, with exponential cost factors (c) τctl,1 = 40, τctl,2 = τctl,3 = 100
msec, with unity cost factors ζi = 1 [3] . . . 104
5.11 The average values of frequency data after isolation of fault in scenario I: (a) τctl,1= τctl,2 = τctl,3 = 40 msec, (b) τctl,1 = 40, τctl,2 = τctl,3 = 100
msec, with exponential cost factors (c) τctl,1 = 40, τctl,2 = τctl,3 = 100
msec, with unity cost factors ζi = 1 [3] . . . 105
5.12 The normalized fault currents in Scenario II: k = kf l [3] . . . 106
5.13 Persistent magnitude disturbance in scenario II: (a)-(c) The mean mag-nitude deviation for phases A-C, (d): The magmag-nitude disturbance counter for phase A [3] . . . 107
5.14 The voltage waveform of phase B of observation node b13 in scenario
II: (a) With unity cost factors ζi = 1, (b) With exponential cost factors
given by (5.21) [3] . . . 108 5.15 The post-fault apparent powers for phase B at different DG systems in
Scenario II [3] . . . 108 5.16 The magnitude data reported from phase A of the node b10 in Scenario
III: (a) Detection by over-current relays with tolerance time Tf l = 200
LIST OF SYMBOLS AND ABBREVIATIONS
AC Alternating Current
ADN Active Distribution Network CDF Cumulative Distribution Function DC Direct Current
DG Distributed Generation DS Distributed Storage
EMTP ElectroMagnetic Transients Program EPLL Enhanced Phase Locked Loop
FACTS Flexible AC Transmission System FPS Frames per Second
GOOSE Generic Object Oriented Substation Event GPS Global Positioning System
IED Intelligent Electronic Device
IEEE Institute of Electrical and Electronics Engineers LOF Local Outlier Factor
LOP Local Outlier Probability MGCC Microgrid Central Controller NaN Not a Number
PCC Point of Common Coupling PDC Phasor Data Concentrator PDF Probability Density Function PLL Phase Locked Loop
PMU Phasor Measurement Unit PV Photovoltaic
PLOF Probabilistic Local Outlier Factor RES Renewable Energy Source
ROCOF Rate of Change of Frequency SC Secondary Controller
SCADA Supervisory Control And Data Acquisition TCP Transmission Control Protocol
UDP User Datagram Protocol
UTSP Unified Three-phase Signal Processor VSC Voltage Source Converter
CHAPTER 1 INTRODUCTION
1.1 The Vision for Future Power Grids
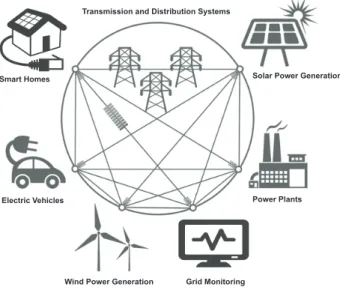
In future power grids, a vast number of distributed generation (DG) systems will be deployed in power grids where renewable energy sources (RESs) such as wind and solar will play an indispensable role. As illustrated in Fig. 1.1, smart grid is a vision for future power grids that encompass a broad range of information, communications, control, and energy technologies. In such power grids, DG, distributed storage (DS) units, and consumers are interconnected with the power plants and transmission systems through microgrids and active distribution networks (ADNs). Microgrids and ADNs are advanced power systems which are composed of DG/DS systems, lines, loads, transformers, metering and intelligent electronic devices (IEDs). These autonomous systems enhance the grid resiliency and mitigate the power outage since they can supply energy in the absence of the utility grid.
Electric vehicles and smart homes are among the other conspicuous features of modern power grids. In fact, smart grids will provide the infrastructure necessary for enabling the efficient use of electric vehicles. Electric vehicles will interact with the utility grids by serving as mobile DS units, a concept which is called “vehicle-to-grid” in the smart grid terminology. Smart meters and home energy management systems allow for automated and bidirectional exchange of information between smart homes and the utility grids. A smart home equipped with an energy management system facilitates tracking of energy consumption and thus reduces electricity bills.
Smart Homes Solar Power Generation
Electric Vehicles
Wind Power Generation Grid Monitoring
Power Plants Transmission and Distribution Systems
1.2 The Era of Big Data in Smart Grids
In light of advanced control and communication technologies, smart grids are able to provide consumers with safe, clean, sustainable and reliable energy. However, smart grids, as large-scale and heterogeneous energy networks, will face challenging issues regarding management, control, reliability, and power quality. Moreover, time-varying RESs, advanced controllers, and communication systems give rise to increasing complexity of modern power grids where the role of information and data analytics is indispensable. It is expected that, with the evo-lution of power systems, planning and operation of grids rely on different types of real-time and offline data.
As power grids incorporate more RESs, an unprecedented number of sensors, controllers, and actuators will inevitably emerge in the grid. A sensor can be envisaged as a device/system which provides specific types of data/information depending on the desired functionality. In the context of smart grid, most of the sensors belong to the following categories:
• Phasor measurement units (PMUs) • Phasor data concentrators (PDCs) • IEDs and protective relays
• Frequency disturbance recorders (FDRs)
• Supervisory control and data acquisition (SCADA) systems • Smart meters
• Geographic information systems • Weather forecast data
• Electricity market information
An actuator which is responsible for applying a control action, can be thought of as a switch, protective device, DG system, DS unit, etc. Moreover, the sensors, the controllers and the actuators can be spatially separated and thus communication systems are required for trans-fer of the measurements, signals, and control data.
Among the aforementioned categories, PMUs and PDCs are generally regarded as high-rate sources of data in power grids. These devices can provide samples of voltage/current phasors,
instantaneous frequency, real/reactive power, and other pertinent data in real-time. It turns out that deployment of such devices leads to a large variety of data at a high granularity and volume: a fact which ultimately brings about the concept of Big Data in power grids. Big data in power grids can be characterized by three remarkable features:
• Large volume: extended time horizon for processing and archiving data, mainly due to extensive deployment of high-rate sensors such as PMUs, PDCs, and smart meters • High velocity: faster temporal variations, mainly due to time-varying RESs and high
penetration of DG systems
• Increasing variety: Different types of data stem from many sensors/sources that did not exist in conventional power grids
In the era of big data, data-driven applications and tools play a crucial role for a modern-ized, reliable, and secure operation of power grids. Data-driven approaches improve decision making and can potentially outperform traditional model-based tools. Motivated by this fact, the focus of this thesis is on data analytics and data-driven approaches with the aim of improving situational awareness in modern power grids.
1.3 Statement of the Problem
In 2011, the president of North American Electric Reliability Corporation (NERC) wrote to the members [4]:
“Almost all of the major network failures, excluding those emanating from severe weather conditions, have malfunctioning of relays or automatic control systems as a factor that con-tributes to the aggravation of the failure. Relays may operate when not needed, or fail to operate when needed for several reasons. Generally speaking, relays may fail to operate correctly due to incorrect settings, bad coordination with other devices, ineffective commis-sioning and maintenance, failure of communications channels, or power supplies.”
Basically, data-driven applications rely on exchange of information/data between different devices and power system components. Therefore, it is important to account for possible impairments that may be imposed on data during data acquisition and transmission. Noise, delay, and unpredictable loss of data are deemed to be the harmful impairments that deteri-orate the performance of the data-driven applications. Such impairments in data may stem from the following phenomena:
• Congestion and severe background traffic in shared communication links • Sensor failures
• Measurement noise
• Interference caused by lightning, harmonics and subharmonics
Such data impairments increase uncertainty in information and have deleterious effects on the reliability and robustness of the aforementioned applications. Therefore, use of a reliable and accurate data processing framework is deemed to be indispensable for these real-time applications. In this regard, lack of an elaborate data processing framework tailored to smart distribution grids is noticeable. The challenge is that real-time algorithms and mechanisms are required that collect, analyze, and transform real-time data with the primary goal of reliable decision making. The methods and algorithms not only should cope with noisy, delayed and intermittent arrival of information but also they should improve performance of data-driven control and protection applications.
1.4 Thesis Objectives
With the availability of low-cost and accurate measurement devices along with fast and efficient processors, it is anticipated that new control and protection applications will be developed for future power grids. There is no doubt that the performance of these applica-tions depends on how the data are obtained and processed in real-time. Here an important question arises: Can a data processing framework improve control and protection of modern distribution grids while being able to coexist with conventional systems?
The main objective of this thesis is to develop algorithms and mechanisms for synchrophasor data acquisition/processing tailored to monitoring, control and protection applications in smart microgrids and ADNs. The data acquisition and processing tasks are analyzed under noisy and intermittent data conditions when developing disturbance monitoring structure. The other objective of this thesis is the analysis of fault/event detection in the presence of synchrophasor data delays. The data acquisition task deals with methods and protocols for extraction of information and transmission to a centralized control unit. If carefully designed, it can also diminish the deleterious impacts of data impairments. The data processing task, however, corresponds with algorithms for detection, monitoring, and decision making. More-over, qualified performance metrics are required in order to evaluate reliability and efficiency of the proposed methods and mechanisms for control and protection purposes.
The primary outcome of this study is a reliable and effective data processing framework to assist control and protection applications in smart microgrids and ADNs. Among the other objectives of this thesis are data-driven methods that yield:
• More resilient ADNs
• Enhanced automation and planning of power systems • Ease of network reconfiguration and resource management • Improved situational awareness
• More reliable smart grid infrastructure
Ultimately, the resulting data-driven methods leverage reliable and secure operation of power grids that widely utilize DG technology and RESs. The end users of the proposed data processing framework can be high-level controllers, protection systems, monitoring systems, and even operators of the utility grid.
1.5 Methodology
A reliable data processing framework paves the way for a broad range of applications from resource management and economic operation to situational awareness in modern power systems. At the system level, our proposed data processing framework relies on:
1. Distributed sources of data
2. Hierarchical control and protection structure 3. Time-critical event detection
Distributed data acquisition is accomplished by using communication systems and measure-ment devices in the smart grid infrastructure. The measuremeasure-ment diversity is achieved by col-lecting necessary information from several nodes. The measurement diversity improves the robustness of monitoring applications against unpredictable loss of data by taking advantage of spatial and temporal correlations inherent in large datasets. Information transmission reduces reconfiguration cost and maintenance time, hence, the investment in new metering devices and communication systems can be justified. The hierarchical structure is a promis-ing paradigm for systematic control and protection of different components in large-scale power systems. The hierarchical structure also facilitates scalability of the data processing by designating computational tasks to different processors and devices. In this setting, the low-level applications aid the applications in upper layers in terms of data management and
processing. Finally, unforeseen events in power systems (e.g., disturbances, faults, etc.) must be detected and accommodated for in a timely manner due to the fact that control and pro-tective actions are essentially time-critical.
Fig. 1.2 illustrates the adopted methodology in this study. As shown in this figure, the developed data processing framework consists of three functionalities: Data acquisition, data analytics, and data-driven applications. These constituent functionalities will be discussed later in the next subsections.
Pre-processing Rate conversion Archiving PMU Data IED Data Smart Meter Data Time Reference (GPS) Disturbance Detection DG Monitoring & Localization Fault Detection & Localization Decision Making DG Management Backup Relaying Coordination
Acquisition Analytics Applications
Figure 1.2 The functional block diagram of the proposed data processing framework
Extensive time-domain and statistical computer simulations are required to investigate the applicability of the aforementioned data analytics. The computer simulations mostly involve system-level simulations where very detailed implementation of power system components are not necessarily helpful. In this study, Electro-Magnetic Transients Program (EMTP-RV) [5] and Simulink [6] are used for simulating the electrical part of the grid and the PMUs. The extracted signals and PMU data are then fed to MATLAB modules for analysis of datasets. The MATLAB modules may also simulate some data impairments, e.g., data noise and random data losses. The superiority of the developed data processing framework can be demonstrated by numerical assessment of the performance metrics.
1.5.1 Data Acquisition
Data, signals, and behavioral messages are extracted from different nodes in the micro-grid/ADN. In this research, the primary sources of data include PMUs, IEDs, and smart
meters. The PMU data (also referred to as synchrophasor data) are usually streamed to a PDC (within a central unit) with a fixed reporting rate. The IED data and other protective messages are exchanged if either an event is locally detected or a request message from an upper layer unit is received. The smart meter data which carry useful information about real-time power consumption are also collected in fixed periods.
At the central unit, the PMU data streams are collected and pre-processed. The PMU data streams should be archived since decision making algorithms may require access to past data. Moreover, the received data can be decimated in order to meet the sampling requirement of specific control and protection applications.
1.5.2 Data Analytics
In the context of this thesis, data analytics refers to qualitative/quantitative techniques and algorithms that improve performance of hierarchical control and protection applications. Centralized disturbance detection, monitoring of DG connection/disconnection events, and fault identification are the main functionalities that can be carried out based on data analyt-ics. Microgrids and ADNs are subject to network-wide disturbances such as voltage/frequency deviations when they become isolated from the utility grid. Local and droop-based controllers may fail in suppressing such disturbances. The data processing algorithms should reliably detect such deviations and trigger a restoration process if necessary. In order to evaluate de-tection of subtle deviations, it is crucial to assess the performance of disturbance monitoring under noisy and intermittent data conditions.
The presence and absence of DG systems in distribution networks can change over the time. In practice, a DG system may become disconnected from the rest of the network due to, for example, a temporary fault, and then reconnect with the network. The data processing algorithms should identify how many DG systems are actually operational and determine the location of DG connection/disconnection events within the network. Moreover, the presence and absence of DG systems and loads can affect the interval during which a line fault can be tolerated without compromising the post-fault stability of voltage/frequency. Hence, data analysis method should be devised to ensure that all faults are reliably detected and isolated in a permissible time.
1.5.3 Control and Protection Applications
The previously mentioned data analytics can substantially improve performance of control and protection applications in smart microgrids and ADNs. They not only facilitate
opti-mal/economic operation but also enhance the performance of secondary/tertiary control, and increase reliability of grid protection.
Once a network-wide disturbance is detected, a decision making algorithm verifies the sources of disturbances. If an islanding event is confirmed as the source of the disturbance, then the secondary control application can trigger the voltage/frequency control mode. Islanding events can be confirmed by using remote methods which are based on communications be-tween microgrid and the utility grid. Remote methods monitor the status of circuit breakers immediately. Remote methods present small or even zero non-detection zone and have no impact on the power quality. Remote methods are very effective in multiple-inverter systems, but they need large investment and may not be economic in small systems. If a steady-state disturbance is observed while the network operates under the islanded mode, then the sec-ondary control application updates the reference values of voltage/frequency based on the droop-based control concept.
Once a DG disconnection/connection event is detected, a DG management mechanism de-termines new setpoints of operational DG systems and updates the values of fault tolerance time. A backup protection mechanism constantly supervises local protection systems. It clears line faults if local protective devices fail in detecting faults within the permissible time. Moreover, as depicted in Fig. 1.2, the DG management mechanism must be synchro-nized with the backup protection mechanism. The fault clearance entails abrupt changes in the network topology that directly affect both local and secondary control applications. Therefore, coordination between DG management and protection mechanisms is important. 1.6 Thesis Contributions
The smart grid reliability and resiliency can be improved by utilizing data-driven control and protection application. Moreover, such applications depend on a framework to obtain and process different types of data about real-time behavior of the power system. This is a big challenge since the data processing framework interacts with different integrated technolo-gies including communications, control, generation, and storage systems. To overcome this challenge, the focus of this thesis is on developing a novel data processing framework that improves decision making for intelligent control and protection applications. The preeminent contributions of this thesis are effective data analytics including:
1) Detection of network-wide voltage/frequency disturbances [1]. Unlike conventional mon-itoring systems, our proposed approach relies on several PMUs in order to detect subtle
disturbances as fast and reliable as possible. In particular, detection time and probability of false alarm are analyzed under noisy and intermittent synchrophasor data conditions. This contribution increases accuracy of voltage/frequency monitoring and is useful for bumpless transfer to islanded mode. It is also important for centralized control when the network is in the islanded operation mode.
2) Detection of presence/absence of DG systems and localization of connection/disconnection events within the network [2], [7]. DG systems are important resources in microgrids and ADNs and their presence/absence may change over the time. We propose an online detection mechanism that relies on current symmetrical components reported from the main point of common coupling in order to estimate the number of operational DG systems. This contri-bution is not only conducive to secondary control functionalities but also vital for reliable operation of backup protection applications.
3) Adaptive Backup protection coordinated with centralized DG management [3]. The in-creasing penetration of DG systems may significantly change the short-circuit currents. This phenomenon adversely affects the performance of line protection systems that operate based on over-current relaying concept. We propose a method that detects line faults within the per-determined tolerance time which is crucial for successful backup protection. Since the connection/disconnection of DG systems are tracked over the time, the secondary controller is able to update the critical value of fault isolation time. Hence, using our approach, the post-fault stability of islanded zone is assured. Moreover, upon fault isolation, the central controller updates the setpoints of DG systems in order to facilitate voltage/frequency re-covery in the islanded zone.
1.7 Thesis Outline
This thesis includes six chapters which are briefly explained in the sequel:
• CHAPTER 1: Introduction: This chapter introduces the smart grid technology and explains how data-driven control and protection applications emerge in modern power grids. Moreover, an overview of the objectives, proposed methods and contributions of this thesis is given in this chapter.
• CHAPTER 2: A review on the synchrophasor technology: The second chapter is dedi-cated to the components of synchrophasor networks and hierarchical control systems in smart grids. Moreover, Chapter 2 reviews existing methods that address power system state-estimation, monitoring, and protection based on synchrophasor data.
• CHAPTER 3: Centralized disturbance detection: This chapter addresses reliable de-tection of voltage/frequency disturbances based on processing of noisy synchrophasor data that are subject to delay. Noise-delay tradeoff in synchrophasor data acquisi-tion is explained, and average detecacquisi-tion time and probability of false detecacquisi-tions are numerically evaluated.
• CHAPTER 4: Monitoring of DG systems: Detection methods for estimation of the number of operational DG systems and localization of DG connection/disconnection events are developed in Chapter 4. The secondary DG monitoring unit processes the datasets of current symmetrical components at the main PCC and local nodes of the network. The robustness of the monitoring approach is evaluated in the presence of solar energy variations and sudden load changes.
• CHAPTER 5: Coordinated protection and secondary control: Detection of line faults within the critical fault tolerance time is the main subject of this chapter. The fault detection triggers a decision making algorithm that finds the optimal setpoints of DG systems for the islanded operation. The response time of the protective devices, DG capacities, and the communications delays are taken into account in the simulations. • CHAPTER 6: Conclusion and recommendations: The last chapter presents a summary
of the results and important remarks which can be drawn from this PhD thesis. Chapter 6 ends with suggestion of new research topics that can be addressed in future studies.
CHAPTER 2 A REVIEW ON THE SYNCHROPHASOR TECHNOLOGY
Microgrids and ADNs are the key elements of a modern power grid. Such networks are in-herently exposed to diverse operating conditions due to prevalence of DG systems and DS units [8]. One of the major issues regarding the operation of microgrids and ADNs with high penetration of RESs is related to the voltage/frequency control and power flow management [9]. For instance, the variability of photovoltaic (PV) generation results in voltage fluctu-ations which can be detrimental to voltage regulation in distribution networks. To achieve reliable and secure operation in smart grids, new and sophisticated infrastructures have been proposed [10]. In fact, by employing communication and intelligent control systems, modern distribution networks can effectively harness RESs to improve the network performance in terms of power quality, reliability, efficiency, cost, and sustainability. In this section, we first briefly review the recent contributions to the field of intelligent and hierarchical control in modern power systems. Then, we proceed by discussing synchrophasor networks and how synchrophasor data play a pivotal role in high-level control and protection applications. 2.1 Networked Control Methodology in Smart Grids
Networked control in smart grids relies on digital communication systems for transfer of in-formation and control signals between different components of the power system. Networked control methodology offers several advantages and is gaining a broad range of applications in smart grids. For example, information can be easily shared among multiple distributed controllers and different monitoring systems [11]. Moreover, new sensors and actuators can be easily augmented to the power system. Above all, the configuration and maintenance costs can be significantly reduced.
It is worth noting that, the interconnection of digital communication systems to the con-trol and power systems results in new challenges. The digital communication systems are inherently discrete, i.e., signals must be measured, quantized, and transmitted over communi-cation links. The communicommuni-cation links have limited and costly capacity, and if the number of nodes increases, then the communication links may fail in delivering the critical information. Furthermore, digital communication systems may induce packet delay and packet losses. 2.2 Hierarchical and Droop-Based Control in Smart Grids
The union for the coordination of transmission of electricity (UCTE) has developed a hier-archical structure for control of large-scale power systems [12]. In modern power systems,
the hierarchical structure is regraded as an effective paradigm for control of power system components [13, 12]. Moreover, attempts are made toward standardization of this control structure for smart grids with high penetration of DG systems [14].
Load Energy storage Micro-turbine Wind generator Photovoltaic Secondary Level Primary Level Tertiary Level Time Control Communicat ions Network
Centralized Control, Backup Protection Energy Management Wide Area Monitoring &
Protection
Figure 2.1 The three levels of the hierarchical control structure
Fig. 2.1 illustrates the general schematic of hierarchical control framework. As shown in this figure, most of the power system studies consider three levels for hierarchical control of microgrids and ADNs. A communications network is required for transfer of the control signals and data between different layers. It should be highlighted that, the control and protection applications at the higher layers do not necessarily require high-rate data. At the primary level of this structure, local (also known as primary) controllers are responsible for decentralized control of current/power or voltage/frequency [15]. To this aim, each operating DG system requires high-rate information about the instantaneous voltage and current at its local point of common coupling (PCC) [16, 14].
When connecting two or more DG systems to the network, the DG systems should use the well-known P/Q droop control method to mimic the behavior of synchronous generators and supply the time-varying loads. In droop control with inductive lines, the relationships between real/reactive powers and voltage/frequency are determined by [13]
ωo = ω∗− KP(s)(Po− P∗) (2.1)
where ω∗ and V∗ denote the reference values for frequency and voltage amplitude, respec-tively. ωo and Vo correspond to the measured frequency and voltage amplitude of the DG
system, respectively. Po and Qo are the measured real and reactive powers, while P∗ and
Q∗ are their reference values, respectively. The parameters KP(s) and KQ(s) are the droop
transfer functions that can be designed based on the control-synthesis techniques and the steady-state performance criteria. In their simplest form, the droop transfer functions be-come constant gains that keep the entire system within the voltage-stability limits [14].
At the second layer of the hierarchical structure, a secondary controller is responsible for the reliable and economical operation of entire network in either grid-connected or islanded mode. The secondary controller also performs power sharing, power management, and Load shedding. If the network under study is a microgrid, then the secondary controller may be called microgrid central controller (MGCC). When a new DG system is connected to a node or a malfunctioning unit is disconnected from the network, the primary control level may fail in controlling the frequency/voltage thus the overall microgrid is disturbed [16]. Moreover, if the load’s real and reactive powers change, then the amplitude and frequency at the local PCCs will deviate from their reference values. For example, Eqs. (2.1) and (2.2) indicate that a change in the local load results in steady deviations in the output frequency and volt-age amplitude. Therefore, the secondary controller must monitor and restore such deviations by sending new values of ω∗ and V∗ to DG systems. Throughout this thesis, the point of
connection of DG systems is called a local PCC. Power sharing between several DG units is another important functionality of the secondary controller [13]. To this aim, the secondary controller should determine and send the values of P∗ and Q∗ based on the capacities and rated powers of DG systems. Finally, it is worth noting that similar functionalities regarding control of DS units can be assigned to the secondary controller.
At the highest level of the hierarchical structure, the tertiary control layer regulates the power flow between the microgrid and the utility grid at the main PCC [12]. Moreover, a tertiary controller is responsible for coordination between multiple microgrids interacting with each other within an ADN [13]. The tertiary controller can also determine the optimal operating points of microgrids depending on the requirements of the utility grid.
It should be noted that the primary controllers are designed to operate instantaneously and in a decentralized manner. While the primary control layer does not require any communication link, the second and third control layers are inherently based on communication links and operate similar to networked control methods. The main advantage of hierarchical control is
improved robustness against disturbances and load changes which may not be settled by the local controllers.
Time synchronization is of crucial importance in proper operation of hierarchical control and protection applications. In realistic scenarios, the controllers receive the samples of voltage/frequency from distributed local PCCs. As a consequence of communication impair-ments, these information may arrive at a high-level controller without order or with unequal time delays. In many real-time applications such as disturbance and fault detection, the de-viation of a parameter from the desired value is important for decision making. This implies that, the hierarchical control and protection applications requires synchronized (time-aligned) data that are comparable over the entire network domain. Such synchronized information can be extracted based on global positioning system (GPS) clock signals as will be discussed later in this chapter.
2.3 Synchrophasor Networks
Basically, synchrophasor networks consist of three fundamental components [17]:
1. Phasor measurement unit (PMU): for synchronized extraction of voltage/current pha-sors and other relevant information
2. Phasor data concentrator (PDC): for effective collection, pre-processing, and manage-ment of synchrophasor datasets
3. Communication links: for transfer of synchrophasor data packets
Fig. 2.2 illustrates the generic architecture of synchrophasor networks. In the data acqui-sition layer, the PMUs extract synchrophasor data at distributed nodes in the grid. The synchrophasor data are then delivered to PDCs which facilitate data management by col-lecting different data streams and constructing synchrophasor datasets. Finally, the PDCs provide the synchrophasor datasets for different applications in the application layer.
Currently, cost is the main issue that affects widespread deployment of synchrophaosr net-works in power systems. The cost of the installation, commissioning, and the communication infrastructure are important economical factors. Substations that are equipped with digital relays or IEDs already have the necessary communication backbone. Moreover, the IEC 61850 standard allows transfer of synchrophasor data via the same protocols and messaging structure that handle IED information [18]. As the cost of PMUs decreases and more IEDs
are being deployed in power systems we anticipate a gradual migration towards full utiliza-tion of synchrophasor networks in power grids.
As far as distribution networks are concerned, low-cost and high-precision PMUs, also known as micro-PMUs, have been commercialized in the recent years. This type of PMU is suitable for distributed phasor data acquisition at the distribution level due to precise measurements and highly accurate time stamps [19, 20, 21]. The size of circuit boards in micro-PMUs is very small and they can be installed in almost every bus of distribution grids. A micro-PMU is capable of measuring voltage/current phase angles with a resolution of 0.001 deg, and mag-nitudes with a resolution of 0.0002%. State-of-the-art micro-PMUs can report synchrophasor data up to 120 frames/sec which makes them a qualified candidate for modern intelligent protection systems [22].
Monitoring Applications Control Applications
Protection Applications . . . . . . . . PMU PMU PMU PMU PDC PDC PDC Communications Links Communications Links Application Layer Data Acquisition Layer
Figure 2.2 The generic architecture of synchrophasor networks
2.3.1 Synchrophasor Data Acquisition
It is known that the hierarchical control applications require time-aligned data for proper decision making. With the advent of reliable and accurate PMUs [23], a feasible data
ac-Synchrophasor data packet Sinusoidal input GPS satellites • !" • G PMU Optional info Error checking code •
√2 $%+ 1 2& ' '" 1 2& '( '"( Time tag …
Figure 2.3 The extraction of synchrophasor data packets in power systems
quisition method is to locally measure the voltage/current phasors and then transmit the extracted data to the high-level applications. According to the IEEE standard C37.118-2011 [24], PMU is a device which extracts phasor magnitude, phase angle, frequency, and rate of change frequency (ROCOF) from the signals given at its input terminal, as illustrated in Fig. 2.3. The PMUs are equipped with transmitters which send the synchrophasor data packets to the desired destination via communication links.
In light of precise time stamps provided by PMUs, control, monitoring, and protection appli-cations have access to synchronized and comparable data streams in real-time [23]. Commer-cial PMUs support a broad range of reporting rate, from 10 reports/sec up to 240 reports/sec for 60 Hz power systems [24]. The core of any PMU is a parameter estimator which extracts the synchrophasor data. The electrical signals appearing at the input terminals of PMUs may become corrupted by harmonics and additive noises. Hence, due to presence of noise in the input signals, the reported synchrophasor data may carry noisy values of the true parameters. The accuracy of synchrophasr data is thus dependent on the performance of the parameter estimator and the noise level. In what follows, we briefly review some of the techniques that are commonly used for parameter estimation:
• Discrete Fourier Transform (DFT) [25, 26]: The fast Fourier transform (FFT) applies to a window of input signal samples. Depending on the sampling frequency and length of the window, DFT-based algorithms are classified into fractional-cycle, one-cycle, and multi-cycle methods. The accuracy of DFT-based methods is liable errors emanated from aliasing and spectral leakage.
(SRF-PLL), also known as dq0-PLL, is widely used for estimation of magnitude, fre-quency and phase angle of the positive sequence component of three-phase signals. Three independent enhanced PLLs (EPLLs) are required to estimate phasors of each phase of the three-phase signals. The accuracy of PLL-based methods can be affected by the presence of dc component, severe unbalancedness, and magnitude uncertainty in the input signals.
• Unified Three-phase Signal Processor (UTSP) [29]: The UTSP is basically an enhanced three-phase PLL which not only estimates the phasors and frequency of the sequence components but also synthesizes the signals in the time-domain. Similar to other PLL-based techniques, the UTSP shows longer transient times than those PLL-based on the DFT. However, the UTSP shows very good robustness against the measurement noise. • Kalman Filter [30]: Basically, a Kalman filter can be configured to estimate the phasors
similar to DFT-based methods. An adaptive Kalman filtering approach, also referred to as extended Kalman filter, however, depends on accurate frequency estimation. It can be thought of as a filter bank with arbitrary center frequencies. The main advantage of this approach is that it can effectively track the fundamental frequency along with its harmonics and specified inter-harmonics.
It is worth noting that, the aforementioned techniques differ in terms of robustness against measurement noise, response time, and computational aspects. Apart from the above meth-ods, other techniques such as wavelet-based algorithms [31], signal subspace and adaptive filtering methods [32, 33] can be found in the literature.
2.3.2 Synchrophasor Data Communications
The IEEE standard C37.118.1-2011 defines a data frame as a set of phasor, frequency, and ROCOF samples that correspond to the same measurement time tag [24]. The reporting rate of synchrophasor data by PMUs is usually measured in frames per second (fps). The reporting rate is usually much smaller than the internal sampling rate of voltage/current waveforms. Therefore, a downsampling and delay compensation is normally required before transmission of data frames via communication links. There are two common protocols that may be used in synchrophasor data communication: transport layer protocol (TCP) and user datagram protocol (UDP).
In realistic scenarios, smart grids need effective mechanisms and protocols in order to ensure reliable data transmission and handling. The IEEE standards C37.118.2-2011 and
C37.244-2013 aim to address some issues regarding synchronization, processing, and real-time access to phasor data streams [34, 35]. These standards also define PDC as a unit that gathers phasor data, time stamps and other parameters from several PMUs (or other PDCs), and transmits the collected data to other devices. According to the this definition, a PDC can be thought of as an elaborate algorithm which can be integrated into other devices. In addition to data concentration, a PDC may fulfill other objectives such as data archiving, conditioning and validation [36]. PDCs are particularly helpful in intelligent applications such as situational awareness. In this study, we elaborate on PDCs as powerful data pre-processing tools for intelligent and hierarchical control/protection applications in smart grids.
2.4 Existing Trends and Applications
This section discusses some of the recent control and protection methods that rely on syn-chrophasor data processing. The existing methods are concisely reviewed from the perspective of high-level control and protection applications that are pertinent to this research.
2.4.1 Control Methods Based on Data Communications
Zheng et al. propose a centralized networked controller for a power system with parallel DG units connected with a single load [37]. They only consider the impact of communication delay in transferring the measured voltage and the reference values. The proposed schemes are applicable to scenarios where all inverters have access to a common communication link, hence, spatially distributed inverters are not considered.
The authors in [38] propose a robust networked control scheme that complies with the hier-archical structure. Specifically, they propose a distributed secondary control strategy where each DG system collects amplitude/frequency data from all operational systems and then calculates and broadcasts their average values using the communication network. This sec-ondary control scheme can take into account spatially separated DG systems. However, its performance is liable to large errors due to DG failures in providing the true information under measurement noise.
Network control schemes for stabilizing the inter-area oscillations in power systems are dis-cussed in [39] and [40]. These works only deal with the impact of packet loss on the stability margin of interconnected power systems. The effect of measurement noise and the procedure for estimation of power system states are not discussed. Moreover, the application is confined to oscillatory stability of wide-are power systems.
Networked control of power systems based on wide area measurements is discussed in [41] and [42]. The work presented in [41] accounts for the communication delay and packet dropout and aims to design a robust controller using wide area data as feedback signals. The adverse effects of limited bandwidth availability on the flexible AC transmission system (FACTS) controllers are explained in [42]. The underlying idea is to approximate the actual behavior of power system during the intervals when data from PMUs are not available. However, this work does not deal with packet loss and communication delays.
The work presented in [43] uses a networked control scheme for accurate and optimized power sharing in hybrid AC/DC microgrids. In this work, a centralized controller is implemented in an interconnecting voltage source converter (VSC) in order to optimally exchange power between the ac and dc sub-grids. The impact of a constant communication delay on the per-formance of interconnecting VSC is also investigated. However, most of modern networking technologies are based on packets for data transfer and thus variable communication delays and random losses are inevitable.
2.4.2 State Estimation Applications
The high reporting rate of PMUs basically allows control applications to effectively estimate the power system states in real-time. The authors in [44] propose a two-stage Kalman filter-ing approach for simultaneous estimation of both static and dynamic states in power systems, i.e., voltage magnitudes/phase angles and generator rotor angles/speeds. They also consider networked control of multiple inverters which are connected to a common bus and share a high speed communication link. Moreover, a data analyzer is proposed to determine the quality of data for power sharing. Specifically, their proposed data analyzer investigates the communication link failure and the abnormal values of power data. In [45] a distributed state estimation algorithm is proposed based on information exchanges with immediate neighbor-ing nodes in large-scale power grids. The proposed state estimation algorithm incorporates the data obtained by both the SCADA system and PMUs to avoid the observability prob-lem. Ghahremani and Kamwa propose a decentralized PDC-based state estimation method of the generators in large-scale power systems [46]. Their Kalman filtering technique pro-cesses PMU data extracted from the generator buses in order to estimate the rotor angle and speed of generators. In [47], a PMU-based robust state estimation method is proposed where synchrophasor data are used as priori information in a modified weighted least square estimation algorithm.
observability of static and dynamic states. Finding an optimal PMU placement strategy to minimize uncertainty in state estimation is addressed by several researchers [48, 49, 50, 51, 52]. The authors in [48] discuss an important trade-off between the accuracy of the state estima-tion and the number of PMUs/smart meters in distribuestima-tion grids. The genetic algorithm is used to solve an optimization problem in order to reach an optimal measurement infrastruc-ture. The method proposed in [49] is basically a two-stage state estimation scheme which decomposes state vectors into observable and unobservable parts. A linear estimator receives PMU measurements to estimate the observable states variables. The resulting estimates are then used in a reduced-order state estimator to obtain the PMU unobservable state variables. In [50], a unified method is proposed for finding the minimum number and locations of PMUs such that all the state variables can be estimated. Their proposed approach yields the least infrastructure cost while preserves the grid observability. The methodology proposed in [51] aims at finding the optimal placement for both observability and detection of bad PMU data in critical measurements. According to their proposed approach, bad data in critical mea-surements are detected and subsequently converted to non-critical meamea-surements through appropriate PMU placement. The ultimate advantage of their unified approach is that the robustness of the state estimation can be improved. In a paper written by Qi et al. [52], the empirical observability concept is applied to quantify the degree of observability of the dynamic power system states. The optimal PMU placement is formulated as an optimization problem which maximizes the determinant of the empirical observability Gramian.
2.4.3 Monitoring Applications
An important aspect of synchrophasor data is related to monitoring applications and sit-uational awareness in smart grids. In fact, the PMU is deemed to be one of the most effective measurement devices in power system monitoring. According to the IEEE standard C37.118.1-2011, two operation classes are defined for PMUs, namely M class and P class. The M class is usually adopted in applications where high data accuracy is required while larger delays in data acquisition can be tolerated. Hence, most of monitoring applications may necessitate hiring PMUs that operate in the M class.
The authors in [53] propose a data-driven method for monitoring of short-term voltage sta-bility in smart grids. In this approach, the time-series data reported by PMUs are used for the calculation of finite time Lyapunov exponents. They also address the impact of some data impairments (such as measurement noise, communication delay, and the length of mea-surement window) on the stability prediction. In [54], the authors improve the quality of PMU data by developing a state estimator for high-voltage buses. Their approach relies
on redundant PMU data in order to compute the power flows for disturbance and stability monitoring. An effective method for stability margin monitoring is proposed in [55]. In this method, first the generator angles are measured by PMUs and then then the phase angle difference between critical buses are calculated. An alarm is issued uppon detection of a disturbance which may violate the system transient stability.
The paper written by Kaci et al. proposes a comprehensive approach to monitor the power system stability based on the synchrophasor data streams [56]. Their approach is basically a data baselining method which relates PMU measurements with the grid performance mea-sures under normal operating conditions. It combines conventional descriptive statistics with predictive data mining by means of a big database of power system information. Such a huge database comprises both load flow and dynamic data which can be collected over a time span of several years.
2.4.4 Protection Applications
Most of commercially available PMUs can operate according to the P class specifications. System designers may choose the P class for protection applications where a fast synchropha-sor reporting is required [57]. A high data rate (which means more information in a shorter time period) comes at the cost of lower data accuracy. The accuracy of synchrophasor data, however, is of lower importance in protection applications.
Use of synchrophasor data for protection of power transmission lines is discussed by several papers [58, 59, 60, 61]. In this class of protection schemes, the main objective is to find the accurate location of faults independent of fault type/resistance, source impedance, and power flows. The fault detection and localization for high-voltage parallel transmission lines are well investigated in the paper written by Chen et al. [58]. They use two PMUs to measure voltage and current phasors at the two ends of transmission lines. An eigenvalue-based method is applied to decouple the mutual coupling effects between the parallel lines. The authors also propose an adaptive line parameter estimation algorithm for transposed and untransposed parallel lines. They employ ElectroMagnetic Transients Program (EMTP) simulations to show that their PMU-based protection scheme responds accurately to faults under the ac-tual power system conditions. The authors in [59] propose a new method for backup distance protection of transmission lines. Similar to the method given in [58], their method relies on the use of the voltage and current phasors at both ends of the transmission lines. A system protection center receives the phasor data and eliminates the infeed effect (which increases the apparent impedance seen by the distance relays). The numerical results presented in [59]
show that this backup protection scheme has a good performance with different values of the fault resistance.
Current differential relaying for protection of transmission lines with PMU data is discussed in [60]. This paper also analyzes the sensitivity of the differential protection method for dif-ferent values of fault resistance, location, and inception angle. The authors also evaluate the impact of communication delay on the performance of the differential protection scheme. An adaptive backup protection scheme for transmission lines is developed in [61]. In this paper, the linear least squares method is used to obtain a closed-form and non-iterative solution for the fault identification problem. The authors also propose an optimization model in order to minimize the number of required PMUs and alleviate the related issues such as data storage limitation and communications burden.
Synchrophasor data can also improve wide-area and backup protection in power systems [62, 63, 64, 65]. The authors in [62] point out that event detection and identification based on synchrophasor data play an important role in verifying the operation of relays. A fast variant of discrete S-transform is used for time-frequency analysis of voltage and frequency data reported by PMUs. Afterward, a set of features are derived from the time-frequency representation of data that are relevant to the characteristics of disturbances. Finally, the calculated features are fed into a multi-class extreme learning machine classifier that identifies the power system disturbances. Zare et al. propose a wide-area backup protection scheme that relies on communication systems to obtain synchrophasor data over a large power system [63]. The advantages of the proposed method is that it requires phasors of positive-sequence and identifies different types of faults under both normal and stressed conditions. The au-thors have also investigated the effect of communications/PMU failures on the applicability of their proposed scheme.
Intelligent protection algorithms can process PMU data in order to automatically generate early alarms before a voltage collapse occurs [64]. In [64], a method is presented for filtering synchrophasors with the aim of attenuating unwanted perturbations and removing the bad PMU data. The filtered synchrophasor data are subsequently used to calculate the sensitivity parameters by differentiating bus voltages with respect to the real/reactive powers transfered between buses. A warning alarm is generated before these sensitivities abruptly possess a large positive value (comparison with a threshold).
![Figure 3.6 The single-line schematic of a microgrid with a radial structure and residential loads [1]](https://thumb-eu.123doks.com/thumbv2/123doknet/2348163.35396/58.918.285.637.106.483/figure-single-schematic-microgrid-radial-structure-residential-loads.webp)
![Figure 4.5 The per-phase real powers generated by DG systems in the period of one day: (a) Sunny day (b) Cloudy day [2]](https://thumb-eu.123doks.com/thumbv2/123doknet/2348163.35396/88.918.231.683.108.522/figure-phase-powers-generated-systems-period-sunny-cloudy.webp)