HAL Id: hal-01851835
https://hal-mines-albi.archives-ouvertes.fr/hal-01851835
Submitted on 15 Nov 2019
HAL is a multi-disciplinary open access
archive for the deposit and dissemination of
sci-entific research documents, whether they are
pub-lished or not. The documents may come from
teaching and research institutions in France or
abroad, or from public or private research centers.
L’archive ouverte pluridisciplinaire HAL, est
destinée au dépôt et à la diffusion de documents
scientifiques de niveau recherche, publiés ou non,
émanant des établissements d’enseignement et de
recherche français ou étrangers, des laboratoires
publics ou privés.
Effect of Applied Electrical Field and the Initial Soil
Concentration on Species Recovery During Application
of the Electroremediation Process
V. Pomès, A. Fernández, D. Houi
To cite this version:
V. Pomès, A. Fernández, D. Houi. Effect of Applied Electrical Field and the Initial Soil
Concen-tration on Species Recovery During Application of the Electroremediation Process. Process Safety
and Environmental Protection, Elsevier, 2002, 80 (5), pp.256 - 264. �10.1205/095758202762277614�.
�hal-01851835�
EFFECT OF APPLIED ELECTRICAL FIELD AND THE
INITIAL SOIL CONCENTRATION ON SPECIES
RECOVERY DURING APPLICATION OF THE
ELECTROREMEDIATION PROCESS
V. POME`S1, A. FERNA´NDEZ1and D. HOUI2
1Laboratoire de Ge´nie des Proce´de´s des Solides Divise´s, Centre Energe´tique Environnement, Abli, France 2Institut de Me´canique des Fluides de Toulouse, Toulouse, France
E
lectrokinetic phenomena can be employed for a soil decontamination process generally called electroremediation. The ionic species in solution migrate through a porous medium essentially by electro-osmosis and electromigration. The aim of this work was to contribute to knowledge of this process by studying the effect of some operating conditions on the species recovery through an experimental program. The in uence of the electrical eld applied to the medium and the initial concentration of the soil solution, in particular, are studied. First, the electrokinetic transport phenomena are presented. Then, the experimental set-up and procedures carried out are described. The set-set-up consists of a speci c electroremedia-tion cell containing a Na-doped kaolinite medium. Chemical reacelectroremedia-tions were limited by using the sodium as a tracer. The experimental results show the important coupling existing between solution concentration and the electrical current and their in uence on both the amount and the rate of transported mass. Moreover, the dependence of the electro-osmotic coef cient on the electrical eld applied was demonstrated. The in uence of the solution concentration on the electro-osmosis is not obvious, probably due to the light modi cation of the zeta potential for the system studied.Keywords: electrokinetic transport; electromigration; electro-osmosis; electro-reclamation process; soil remediation.
INTRODUCTION
Electrokinetic transport phenomena have been known from the beginning of the twentieth century and some applica-tions, like electro-osmotic dewatering1–3and models, have
been developed during the last 50 years4. The most impor-tant applications on soil treatment, which can be called electroremediation, began nearly 15 years ago in research laboratories in the Netherlands5, and in the USA6,7, almost
at the same time. Electrokinetic processes, which can be used in situ8, are able to treat ionic pollutants such as heavy
metals9, or other cationic species like arsenic10and anionic
species like uorine11, but also some ionic or soluble
hydrocarbons like phenol12,13.
Process feasibility and ef ciency have been demonstrated at the laboratory scale and some industrial applications have been carried out, even where the phenomena involved and their coupling remain poorly understood. Soils are very complex chemical systems with signi cant implications for pollutant behaviour, such as retention by ion exchange or other chemical reactions14. In addition, they are usually
multicomponent systems with different levels of species concentration, as opposed to the monocomponent diluted
systems used in experiments, with important consequences for the electrical behaviour of the system and the pollutant recovery, as will be shown later. All of these factors make the transposition of experimental results from the laboratory to the eld dif cult15.
Usually, and independently of any chemical reactions in soils, two transport phenomena are considered to take place when an electrical eld is applied to a consolidated porous medium: electro-osmosis, a convective water transport, and electromigration, a forced diffusional species transport. Elec-trophoresis, the particle transport under an electrical eld, is usually neglected in soil applications13. Electrochemical
reactions at the electrodes guarantee the continuity of the electrical current transportation, but they also contribute to the practical feasibility of the process. Through electroche-mical reactions, the electrical potential applied induces a perturbation of the charge balance in the solution around electrodes: positive at the anode and negative at the cathode. Then, electromigration acts to keep electroneutrality, follow-ing the Nerst–Planck theory16. As a consequence,the
concen-tration involved in the application of the mass-transport equation by the electromigration mechanism is not the total concentration of the solution, but just the concentration
necessary to maintain electroneutrality. However, electro-osmosis concerns the total concentration of the solution.
Many research groups are working on this subject, and some fundamental problems of de nition and use of the involved mechanisms have been reported17,18. Acar and Alsawabkeh7 have shown that the relative importance of
different mechanisms can be estimated through dimension-less numbers, as is common in chemical engineering. Thevanayagam and Rishindran18do the same by calculating
the transport rates for different mechanisms involved, which is effectively equivalent. However, these calculations need transport parameters, such as electro-osmotic coef cient or ionic mobility, to be known, that are not constant as is often considered, but a function of the solution concentration19,
which is changing during the process.
In a previous paper, we tried to use dimensionless analysis in order to determine the relevant transport mechan-isms for a non-permeable system. As described in detail by Pome`s et al.20, an expression of the characteristic time of electrokinetic transport phenomena, Gek (electromigration
coupled to electro-osmosis), was de ned and experimentally validated. Even if the experimental error in this determina-tion is quite important for such tedious experiments, the characteristic times calculated are in fact very different to the transport times usually indicated in the literature18,21
(when other phenomena retard the transport). Thus, absolute errors can be considered of little importance.
The aim of this work is to contribute to knowledge on the electroremediation process by studying the effect of some operating conditions on species recovery through experimen-tal work. We have studied in particular the in uence of the electrical eld applied to the medium and the initial concen-tration of the species in soil, The electrical gradient imposed on the system directly in uences the rates of electromigration and electro-osmosis. The initial concentration in the soil mostly governs soil electrical conductivity and the value of the current intensity obtained, which determines the mass ow density of species displaced by electromigration.
For this, the experimental set-up developed and character-ized and a non-reactive ion (the sodium) were used in order to avoid chemical reactions. It is clear that the use of sodium as an ion is not signi cant from an environmental point of view. However, it is a very good support for those interested in transport mechanism research, for different reasons: it is electrochemically stable; characteristic transport parameters (such as ionic mobility) are well known; and it is easy to analyse (atomic absorption) and manipulate. Chemical reac-tions with the medium were limited by a pre-saturation treatment. The soil was experimentally modelled with a pure product, kaolinite, to guarantee constant physical prop-erties. The experimental set-up and the well-de ned protocol used were the same as those presented in Pome`s et al.20
In this paper, the most important phenomena, which occur during electroremediation, and their associated physico-chemical laws will be presented. They concern transport phenomena, electromigration and electro-osmosis, as well as the characteristic time employed to evaluate transport rates. Next, the experimental set-up and measurement methods will be described and followed by the presentation of the experimental results obtained. Finally, these results will be discussed with particular attention to three aspects: current intensity induced; electro-osmotic ow rate; and species recovery.
THEORETICAL BASIS
Two electrokinetic phenomena, electromigration and electro-osmosis, are usually considered to take place during the electrodepollution process of a soil. Electro-migration is diffusional transport promoted by an electrical potential gradient. Each species moves according to its own ionic mobility, which is a function of the electrical charge, the diffusion coef cient and temperature22.
Electro-osmotic transport takes place only in the presence of solid surfaces. Surface charges on the solid induce a particular organization of ions in the liquid phase close to the surface, called the double layer, which has been studied for many years4. Most authors consider electro-osmosis to
be produced by the movement of ions in the diffuse layer, which drag water by viscous ow. Electro-osmosis does not concern charge transport because of the neutrality of the phase.
Electrokinetic transport is usually considered as highly monodirectional owing to the electrical eld lines, and very often it is mathematically treated as a monodimen-sionnal system. This approach has been used in the following sections. Moreover, the porous medium was always considered as a homogeneous, isotropic and satu-rated system.
Electromigration
Transport by electromigration is only possible if a break-ing of electroneutrality balance is imposed to the system. During process application, this is the role of the electro-chemical reactions which are able to exchange electrons with electrodes. Then electromigration is produced and acts to maintain electroneutrality.
The mass ow density of one species by electromigration is given by: JA;emˆ ¡ zA jzAj u¤ AcAHF …1† u¤ AˆD ¤ AFjzAj RT ˆ y t DAFjzAj RT …2† with u¤
Athe effective ionic mobility of species A [which can
be calculated by equation (2)] and HF the applied electrical eld. The product of u¤
AHF gives the rate of the transport.
On the other hand, current intensity in the system is given by Faraday’s law22[equation (3)].
I ˆ FX i ziJiˆ F X i zi…Ji;em‡ Ji;d† …3†
In equation (3), I is the current density and Jirepresents
the mass ow density for all the mechanisms responsible for charge transport, electromigration (Jem) and diffusion (Jd):
in fact, electromigration produces in the system a concen-tration gradient which induces the transport by diffusion of the species. Then, the mass ow density of the species A is according to the Nerst–Plack equation [equation (4)]. Faraday’s law means that the total mass of all the species that can be transported by diffusional mechanisms, when expressed as charge, must be equivalent to the total charge in
the electrical circuit. However, for many systems diffusion can be neglected and only electromigration is considered23.
JAˆ JA;d‡ JA;emˆ ¡D¤AHcA¡ zA jzAj u¤ AcAHF ˆ ¡D¤A HcA‡ zA F RTcAHF ³ ´ …4† Simultaneous control of HF and I is impossible due to their coupling through the electrical conductivity of the system, k [equation (5)].
I ˆ kHF …5†
If the solid does not contribute to the system conductivity, k can be calculated from the solution composition:
k ˆ FX
i
ziu¤
ici …6†
In general, the ionic mobility is a function of the total solution concentration19, so the electrical conductivity of a
solution is a non-linear function. However, u¤
i is usually
considered constant, which is a good approximation at very low concentration. Conversely, at high total concentrations, it decreases when concentration increases, so that it is quite dif cult to predict conductivity values at these conditions. During the electrokinetic treatment, concentrations of the system are changing and then conductivity changes too.
Working at constant electrical potential6,9,18 allows the
control of the rate transport, but electrical intensity (and the amount of species that can be recovered) will be mostly regulated by the system resistivity and it will change during the treatment. On the contrary, working at a constant electrical intensity24,25 can be useful for controlling the
total amount of species recovered [equation (3)].
Electro-osmosis
From a microscopic point of view, electro-osmosis is equilibrium between the electrical and viscous forces in the double layer. Several theories have been proposed to explain and to predict electro-osmotic behaviour. The Helmholtz–Smoluckowski theory for electro-osmotic rate in a capillary [equation (7)] is one of the most widely used. The electro-osmotic ow for a system can be calculated by extension of this theory to the overall porous medium14
[equation (8)].
veoˆezmHF …7†
In equation (7), e is the dielectric constant of the medium, m is the solution viscosity and z is the zeta potential or electrical potential in the shear plane around particles4.
Qeoˆ veoyS ˆezmySHF …8†
The macroscopic treatment of electro-osmosis was principally introduced by Casagrande1. He found the
electro-osmotic ow mostly independent of pore size distri-bution and proportional to the applied electrical eld:
Qeoˆ keHF …9†
where kewas called, by analogy with Darcy’s law,
electro-osmotic coef cient, and it was found to be almost constant
…keˆ 5 £ 10¡9m2s¡1V¡1† by Casagrande1 for different
media.
Macroscopic and microscopic theories can only be joined [equation (10)] if the electro-osmotic coef cient is not considered as a constant: modi cation of species concentra-tion in soluconcentra-tion changes the zeta potential26and the
electro-osmotic ow27. So k
e and Qeo must be functions of the
solution composition, and they must also change during an electrokinetic operation.
keˆzemy …10†
Recovery of pollutants by electro-osmosis can be treated as an other convective transport, so the mass ow density for the species A is:
NA;eoˆ veocAˆ kecAHF …11†
Dimensionless Analysis
A previous study was carried out concerning character-istic times of different transport phenomena during the electrokinetic process. An expression for the characteristic time of electrokinetic transport was proposed [equation (12)] and experimentally validated.
Gekˆ ` zA jzAju ¤ A‡ ke ± ² HF …12†
The conclusion of this previous work was that diffusion can usually be neglected and, in non-permeable media, electromigration and electro-osmosis are the preponderant transport mechanisms23.
EXPERIMENTAL WORK Experimental Set-up
The experimental system (Figure 1) employed was designed and validated during a previous work which is pre-sented in detail elsewhere20. It consists of a cylindrical cell
placed on a continuous current electrical circuit. The cell contains an Na-doped kaolinite as the porous medium, which is enclosed by a system of grids and lters. The porous medium was put into the cell following a rigorous protocol to guarantee the control of physical properties of the system such as porosity, permeability and degree of saturation, validated by X-ray tomography. The cell was placed horizontally in order to avoid any hydraulic gradient and its absence was veri ed by following the cathode outlet concentration of sodium during an experiment without application of electrical eld. Moreover, an external circula-tion system, with a fast pumping rate, was used for each electrolytic compartment in order to evacuate the gases produced and to guarantee good mixing. Indeed, a hydro-dynamic study previously carried out showed that electro-lytic compartments can be considered as perfectly mixed. The cross-sectional area of the cell was 4.71 £ 10¡3m2.
A constant electrical eld was applied to the titanium– iridium electrodes placed in the electrolytic compartments, at each end of the cell.
Experimental Procedure
Before each experiment, the kaolinite was saturated with a known concentration of sodium sulphate (Na2SO4) which
was considered as the initial sodium concentration in soil,
co
s. It was veri ed, in previous works at the working
conditions, that the sodium can be considered as a tracer for the kaolinite and that sulphate ions did not modify the soil structure. During experiments, the sodium initially present in the medium migrated towards the cathode and the sulphate ions moved towards the anode due to their charge. The initial pH of the soil was between 5 and 6.
In order to detect a rise in the sodium concentration at the cathode, a high concentration of sodium in hydroxide form (NaOH) was introduced at the anode, cAnode. The basic pH of the anode feed solution allowed us to control the electrolysis reaction of water. Then, H‡ ions were not
produced at the anode, maintaining a basic pH in the compartment. The excess of hydroxide ions stayed in the anode compartment due to their negative charge.
At the cathode, the electrolytic solution introduced was ammonium peroxodisulfate [(NH4)2S2O8] which is easier to
reduce than water. It allowed us to avoid water electrolysis and any associated pH modi cations. This solution is naturally acid so its pH was adjusted to near 5–6 (as the initial soil pH) with potassium hydroxide solution. Potas-sium and ammonium ions remained in the cathode compart-ment due to their charge, while the S2O82¡and SO42¡ions
migrated through the soil towards the anode.
The electrolytic solutions allowed to control the pH and the electrolytic reactions, to recover the solution samples at the cathode, and to introduce at the anode a sodium solution with a well-known concentration. Finally, by keeping a high and constant conductivity in these compartments, the elec-trical potential gradient applied between the electrodes was effective in the soil.
During experiment, the current intensity and the electrical potential gradient between the electrodes (which is imposed)
were measured by two multimeters. Precision of current intensity measurements was §5 £ 10¡3 A, but this
para-meter is quite sensible to anomalies in the system (for example, the accumulation of a little amount of gas in the electrolytic compartments which introduces a new electrical resistance), in such a way that only its level and behaviour are strictly useful. Sodium concentration at the cathode was measured at the over ow of the electrolytic compartment by atomic absorption at 330.2 nm. Electro-osmosis uxes were calculated by mass balance at the cathode with a § 0.01 g precision balance.
Operating Conditions
The operating conditions chosen are summarized in Table 1. All the ve experiments were conducted with both the same length between the electrodes (` ˆ 0.11 m) and anode feed solution (cAnodeˆ 0.1 M).
To study the in uence of the electrical eld on the sodium recovery, three different values were employed, 100, 150 and 200 V m¡ 1, while the other operating conditions were kept
constant. These experiments are called cell A, cell B and cell C. Using the same procedure, the effect of the initial sodium concentration in the soil was shown using three different solutions to saturate the medium, 0.01, 0.05 and 0.14 M, while the other operating conditions were kept constant. These experiments are cell A, cell D and cell E.
Figure 1.Experimental set-up for electrokinetic studies: electroremediation cell with a gas elimination device at the anode, and fast solution recirculation pumps to guarantee a perfect mixing of the electrolytic compartments. Anionic and cationic feed solutions are introduced to control electrochemical reactions. Over ows are used to measure the electro-osmotic ow rate and to analyse the outlet sodium solution concentration.
Table 1.Operating conditions for electrokinetic experiments. Experiments Cell A Cell B Cell C Cell D Cell E Hf (V m¡1) 100 150 200 100 100 ‘…m† 0.11 0.11 0.11 0.11 0.11 co s (mol m¡3) 10 10 10 50 140 cAnode (mol m¡3) 100 100 100 100 100
RESULTS AND DISCUSSION Current Intensity
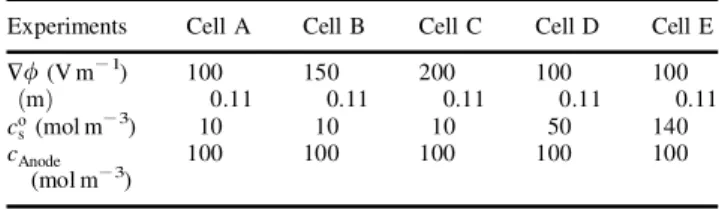
Electromigration and diffusion (which is neglected here) are the two mechanisms able to transport charge owing to the individual transport of ions. Figure 2 shows the evolu-tion of current intensity with time during experiments. Figure 2(a) represents the effect of the electrical potential gradient and Figure 2(b) shows the in uence of the initial concentration in the medium.
The current intensity is proportional to the electrical potential gradient through the soil conductivity. Table 2 shows a comparison between experimental and theoretical values of the initial solution conductivity in the system. At low initial concentrations of sodium, soil conductivity can be considered as a linear function of the concentration (ionic mobility being almost constant) and its prediction can be easily carried out. At high initial concentrations (over 50 mol m¡3), the theoretical calculation of this conductivity
is more dif cult due to the diminution of the ionic mobility. For instance, the values experimentally measured are much lower than the theoretical predictions using the same u¤
value than for low concentrations.
During the treatment, the current intensity increased rather linearly with time and it is also depending on HF.
That is easy to understand as a result of the increasing sodium concentration in the soil, which is different for each experiment, even if the anode feed solution was always the same. In fact, from Faraday’s law, sodium concentration which can pass from the anode to the medium is given by:
I ˆ F…zNa‡JNa‡‡ zSO2¡ 4 JSO2¡4 † ˆ FHF…zNa‡u¤Na‡cNa‡‡ zSO2¡ 4 u ¤ SO2¡ 4 cSO2¡4 † …13†
At constant electrical potential gradient and if the ionic mobility of sulphate and sodium can be considered as similar, the electroneutrality condition gives:
I ˆ 2Fu¤c
Na‡HF …14†
For all the experimental conditions we have considered
u¤ to be equal to 2.12 £ 10¡8m2s¡1V¡1: ionic mobility
of Na‡ in sulphate solution at in nite dilution is
4.7 £ 10¡8m2S¡ 1V¡1, porosity of the system was 0.6
and tortuosity was 1.33. For each experiment the amount of sodium penetrating into the medium can be calculated from equation (14) as a function of the current density. For instance, at 150 V m¡1 at the beginning of the experiment
the current density over the cross-sectional area of the cell was 14.5 A m¡2, so the displaced sodium concentration was
close to 24 mol m¡3(lower than the total concentration in
the anode compartment). The higher the electrical potential, the higher the displaced concentration (and the solution conductivity), so the slopes of the curves in Figure 2(a) are also a function of the electrical potential applied.
In experiments with higher initial concentrations in soil, the electrical intensity behaviour is more dif cult to under-stand. The sodium soil concentration changed in each experiment as a function of the current intensity (increased for cell A, decreased for cell E and stayed constant for cell D) and the current intensity followed it.
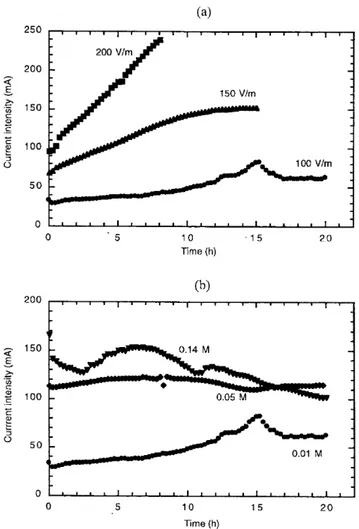
Electro-osmosis
The electro-osmotic ow rate, represented in Figures 3(a) and (b), was measured at the over ow of the cathodic compartment using a balance by difference between feed and outlet ow rates. Figure 3(a) shows the electro-osmotic ow rate measured during experiments A, B and C at different electrical potential gradient. Figure 3(b) represents the in uence of the initial soil solution concentration on the electro-osmotic ow rate, through experiments A, D and E.
Figure 2.Evolution of the current intensity with time during electrokinetic experiments: (a) in uence of the applied electrical eld; and (b) in uence of the initial sodium concentration in soil.
Table 2. Initial solution conductivity for different experiments: comparison between experimental and theoretical values.
Electrical conductivity of the solution (S m¡1)
Experiment Experimental Theoreticala
A 0.088 0.090 B 0.088 0.090 C 0.090 0.090 D 0.410 0.450 E 1.070 1.270
aCalculated from equation (6) with ionic mobilities
The electrical potential gradient applied between the electrodes acts directly on the rate of this transport mechan-ism [equation (6)], as can be seen in Figure 3(a) where the electro-osmotic ow rate increases with the applied electrical eld. In Figure 3(b) a clear effect of the initial concentration of the medium on the value of the electro-osmotic ow rate cannot be observed, as had been theoretically predicted.
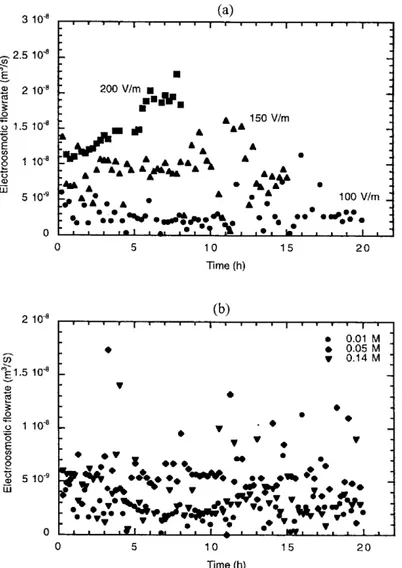
As explained before, a relation between the electro-osmotic ow rate and the electro-electro-osmotic coef cient can be established (equation 8), where the latter is generally considered as a function of the chemical composition of the system but not dependant on the imposed electrical potential gradient. Figure 4(a) and (b) represents the evolution with time of the electro-osmotic coef cient calculated using equation (8).
At constant electrical potential gradient, the electro-osmotic coef cient is expected to be a function of the soil solution concentration, through the zeta potential by equa-tion (10). For the sodium-kaolinite system in similar condi-tions, the zeta potential is weakly in uenced by the total solution concentration26: close to ¡17 mV at 10 mol m¡3
and close to ¡14 mV for 100 mol m¡3at pH 6. It is possible
that our measurement method is not precise enough to evaluate these experimental variations.
Even when the initial sodium concentrations of cells A, B and C were identical, their changes during experiments were not the same because of the different electrical eld applied. However, the behaviour of the electro-osmotic coef cient cannot be attributed to this variation in the medium concen-tration (except, perhaps, for experiment C) as discussed before. Then we can conclude from experiments A and B that the electro-osmotic coef cient is also a function of applied the electrical eld.
Sodium Concentration at the Cathode
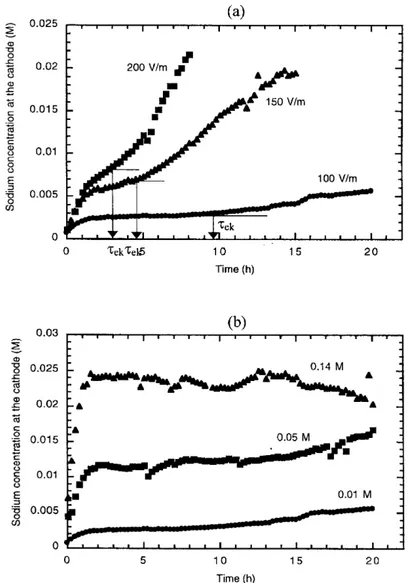
Figure 5(a) represents the evolution of the sodium concentration at the cathode with time as a function of the electrical potential gradient. The in uence of the initial sodium concentration in soil into sodium recovery is shown in Figure 5(b) for an applied electrical eld of 100 V m¡ 1.
The effect of HF on current intensity and electro-osmotic ow will be found on the amount of sodium recovery as much as on its rate. Outlet sodium solution concentration depends on electrokinetic transport but also on the cathode volume and outlet ow rate, according to Figure 6 and equation (15) which represents the mass balance for sodium
Figure 3.Electro-osmotic ow rate measured during electrokinetic experiments: (a) in uence of the applied electrical eld; and (b) in uence of the initial sodium concentration in soil. The measurement method introduces a high dispersion in results.
species into the cathodic compartment, which is considered perfectly mixed.
Qece;Na‡ Qeocs;Na‡ Jem;NaS ¡ QscNa…t† ˆ VdcNadt…t†
…15† For similar working conditions …Qe; Qs; S; V †, the outlet
sodium concentration increased with the applied electrical eld, in the same way that the current intensity does (see above). At the same time, the time necessary to transport species was reduced. In such a system, previous work23has
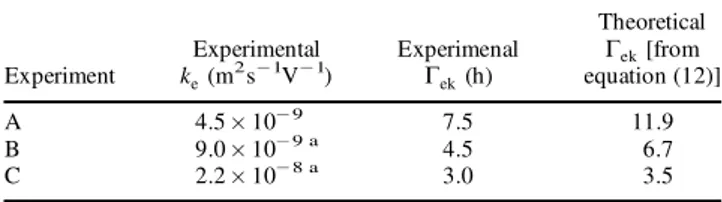
shown that the preponderant transport mechanisms in the porous medium were electromigration and electro-osmosis, so this time can be considered as the electrokinetic char-acteristic time …Tek†. From Figure 5(a) values of
character-istic times can be obtained and compared with the theoretical value from equation (12), as Table 3 shows. A practical dif culty for the calculation are the changes of electro-osmotic coef cient for experiments B and C, so an average value over the experiment was used. For all the experiments a value of u¤ equal to 2.12 £ 10¡8m2s¡1V¡1
was used. The theoretical results agreed quite well with the experimental ones. Conversely, for experiments D and E, a theoretical calculation of the characteristic times was not carried out because the real values of ionic mobilities are not known at these concentrations.
When initial sodium concentration in soil was increased, sodium concentration at the cathode also increased, but not in the same way. Of course the non-linear relationship between solution concentration and current intensity at high concentrations is found here and the amount of displaced sodium is lower.
CONCLUSIONS
In order to study electromigration and electro-osmosis phenomena, a well-characterized experimental set-up and protocol was developed20. In this work, the effect on the
electrokinetic transport of two key variables, the applied electrical eld and the initial concentration of species in soil, was analysed. Experimental work was carried out with a tracer in order to avoid chemical reactions.
Figure 4.Electro-osmotic coef cient determined from the electrokinetic experiments: (a) in uence of the applied electrical eld; and (b) in uence of the initial sodium concentration. Symbols represent experimental results. Straight lines were obtained by linear regression for each experiment.
The amount of species recovery and the rate of transport are improved by increasing the applied electrical eld. In a rst approach this is obvious owing to the linear relationship between the electromigration and electro-osmosis rates with the applied electrical eld. Nevertheless, we have also found that the electro-osmotic coef cient changes with electrical
eld in a stronger way than it does with solution concentra-tion. Solution concentration affects the zeta potential of particles in soil, and the hence electro-osmotic ow rate according to the Helhmoltz–Smoluckowski theory. However, our system was not sensitive enough to detect this in uence. During experiments at different constant electrical eld, we
Figure 5.Evolution of the sodium concentration at the cathode with time: (a) in uence of the applied electrical eld; and (b) in uence of the initial sodium concentration in soil. The inlet sodium concentration at the anode was in all the cases 0.1 M as NaOH. In (a) the characteristic times of electrokinetic transport phenomena (Gek) are also represented.
have found electro-osmotic coef cients to be rather constant and different for experiments A and B. In all cases, concen-trations are changing during the experiments and, therefore, both the effect of the electrical eld and the soil concen-tration are dif cult to dissociate as in experiment C.
The applied electrical potential gradient results in a current intensity as a function of the medium conductivity, and this current intensity establishes the amount of species which can be displaced through Faraday’s Law. However, at high solution concentration, a non-linear relationship exists between ionic concentration and current intensity that means that the presence in solution of higher quantities of species (particularly others than the pollutants) does not improve the process. A solution concentration ve times higher gives concentrations at the cathode about ve times higher (for instance, 0.01 and 0.05 M), but this cannot be extrapolated for upper concentrations (0.14 M).
NOMENCLATURE
cA; ci solution concentration of species A, i, mol m¡3
cAnode feed sodium solution concentration at the anode, mol m¡3
ce;Na feed sodium solution concentration at the cathode
(usually equal to 0), mol m¡ 3
cNa sodium concentration at the cathode, mol m¡3
co
s initial sodium concentration in soil, mol m¡3
DA diffusion coef cient in solution of the species A, m2s¡1
D¤
A effective diffusion coef cient of the species A, m2s¡1
F Faraday’s constant, F ˆ 96485C mol¡ 1 I current density, A m¡2
JA; Ji mass ow density by diffusional mechanisms of the
species A, i, mol m¡2s¡ 1
Ji;d mass ow density by diffusion of the species i,
mol m¡ 2s¡ 1
JA;em; Ji;em mass ow density by electromigration of the species: A, i,
mol m¡ 2s¡ 1
ke electro-osmotic coef cient, m2V¡1s¡ 1
‘ distance between electrodes, m
NA;eo mass ow density by electro-osmosis of the species A,
mol m¡ 2s¡ 1
Qe feed ow rate at the cathode, m3s¡ 1
Qeo electro-osmotic ow rate, m3s¡ 1
Qs outlet ow rate at the cathode, m3s¡1
R universal gas constant, R ˆ 8.3144J K¡1mol¡1 S cross-sectional area of the cell, m2
T absolute temperature, K
t time, s
u¤
A; u¤i effective mobility of the species A, i, m2V¡1s¡1
V volume of the cathode, m3
veo rate of the electro-osmotic transport, m s¡ 1
zA; zi charge of the species A, i
Greek symbols
F applied electrical potential, V HF applied electrical eld, V m¡1
e dielectric constant, F m¡ 1
y porosity of the porous medium
k electrical conductivity of the solution, S m¡1
m uid viscosity, Pa s¡1
t tortuosity of the porous medium Gek electrokinetic characteristic time, s
z zeˆta potential of the particles of the porous medium, V
REFERENCES
1. Casagrande, L., 1949, Ge´otechnique, 1: 3, 159–177.
2. Banerjee, S. and Law, S. E., 1997, Proceedings of the 25th Annual
Conference of the Electrostatistics Society of America, Athens, GA, 150–151.
3. Buijs, P. J., Van Diemen, A. J. G. and Stein, H. N., 1994, Colloids Surf, 85: 29–34.
4. Hunter, R. J., 1981, Zeˆta potential, in Colloid Science: Principles and
Applications(Academic Press, London, UK).
5. Lageman, R., 1993, Environ Sci Technol, 27(13): 2648–2650. 6. Shapiro, A. P. and Probstein, P. R. F., 1993, Environ Sci Technol, 27(2):
283–291.
7. Acar, Y. B. and Alshawabkeh, A. N., 1993, Environ Sci Tehcnol, 27(13): 2638–2646.
8. Lageman, R., Pool, W. and Sef nga, G., 1989, Chem Ind, September: 585–590.
9. Pamukcu, S., Newhart, G. and Wittle, J. K., 1995, in Waste Disposal
by landll—GREEN’93 Sarsby (ed). (Balkema, Rotterdam, The Netherlands).
10. Le Hecho, I., Tellier, S. and Astruc, M., 1998, Environ Technol, 19: 1095–1102.
11. Costarramone, N., Tellier, S., Astruc, M., Grano, B. and Lecomte, D., 1998, Waste Mgmt Res, 16(6): 555–563.
12. Acar, Y. B., Li, H. and Gale, R. J., 1992, J Geotech Engng, 118(11): 1837–1852.
13. Probstein, R. F. and Hicks, R. E., 1993, Science, 260: 498–503. 14. Mitchell, J. K., 1993, Fundamentals of Soil Behaviour, 2nd edition
(John Wiley, New York, USA).
15. EPA, 1997, Resource Guide for Electrokinetics Laboratory and Field
Processes Applicable to Radioactive and Hazardous Mixed Wastes in Soil and Groundwater from 1992 to 1997, Rapport 402-R-97-006 (US Environmental Protection Agency, Center for Remediation Technology and Tools, Washington DC, USA).
16. Helfferich, F., 1962, Ion Exchange (McGraw-Hill, New York, USA). 17. Segall, B. A. and Bruell, C. J., 1992, J Environ Engng, 118(1): 84–100. 18. Thevanayagam, S. and Rishindran, T., 1998, J Geotech Geoenviron
Engng, 124(4): 330–338.
19. Levine, I., 1978, Physical Chemistry (McGraw-Hill, New York, USA). 20. Pome`s, V., Ferna´ndez, A. and Houi, D., 2002, Chem Engng J, 87: 251–
260.
21. Dzenitis, J. M., 1997, Environ Sci Technol, 31: 1191–1197.
22. Newman, J. S., 1991, Electrochemical Systems, 2nd edition (Prentice-Hall, Englewood Cliffs, NJ, USA).
23. Pome`s, V., 2000, Etude du transport e´lectrocine´tique d’une espe´ce non re´active dans un milieu poreux mode`le, The`se de doctorat (INPT, France).
24. Acar, Y. B., Hamed, J. T., Alshawabkeh, A. N. and Gale, R. J., 1994,
Geotechnique, 44(2): 239–254.
25. Acar, Y. B. and Alshawabkeh, A. N., 1996, J Geotech Engng, 122(3): 173–184.
26. Vane, L. M. and Zang, G. M., 1997, J Hazard Mater, 55: 1–22. 27. Eykholt, G. R. and Daniel, D. E., 1994, J Geotech Engng, 120(5):
797–815.
Table 3. Experimental and theoretical characteristic times for experiments at different electrical potential gradient.
Experiment Experimental ke(m2s¡1V¡1) Experimenal Gek(h) Theoretical Gek[from equation (12)] A 4.5 £ 10¡ 9 7.5 11.9 B 9.0 £ 10¡ 9 a 4.5 6.7 C 2.2 £ 10¡ 8 a 3.0 3.5 aAverage value during the experiment.