HAL Id: hal-02291242
https://hal.archives-ouvertes.fr/hal-02291242
Submitted on 18 Sep 2019HAL is a multi-disciplinary open access
archive for the deposit and dissemination of sci-entific research documents, whether they are pub-lished or not. The documents may come from teaching and research institutions in France or abroad, or from public or private research centers.
L’archive ouverte pluridisciplinaire HAL, est destinée au dépôt et à la diffusion de documents scientifiques de niveau recherche, publiés ou non, émanant des établissements d’enseignement et de recherche français ou étrangers, des laboratoires publics ou privés.
Techno-Economic feasibility of Trigeneration systems
with thermal storage: the impact of the load size and
spark spread rates
M. Sandoval-Reyes, Pierrick Haurant, T.R. Sandoval-Reyes, Monica Eskander,
Carlos Silva, Bruno Lacarrière
To cite this version:
M. Sandoval-Reyes, Pierrick Haurant, T.R. Sandoval-Reyes, Monica Eskander, Carlos Silva, et al.. Techno-Economic feasibility of Trigeneration systems with thermal storage: the impact of the load size and spark spread rates. Sustainable Cities and Society, Elsevier, 2020, pp.101745. �10.1016/j.scs.2019.101745�. �hal-02291242�
HAL Id: hal-02291242
https://hal.archives-ouvertes.fr/hal-02291242
Submitted on 18 Sep 2019HAL is a multi-disciplinary open access
archive for the deposit and dissemination of sci-entific research documents, whether they are pub-lished or not. The documents may come from teaching and research institutions in France or abroad, or from public or private research centers.
L’archive ouverte pluridisciplinaire HAL, est destinée au dépôt et à la diffusion de documents scientifiques de niveau recherche, publiés ou non, émanant des établissements d’enseignement et de recherche français ou étrangers, des laboratoires publics ou privés.
Techno-Economic feasibility of Trigeneration systems
with thermal storage: the impact of the load size and
spark spread rates
M. Sandoval-Reyes, Pierrick Haurant, T.R. Sandoval-Reyes, Monica Eskander,
Carlos Silva, Bruno Lacarrière
To cite this version:
M. Sandoval-Reyes, Pierrick Haurant, T.R. Sandoval-Reyes, Monica Eskander, Carlos Silva, et al.. Techno-Economic feasibility of Trigeneration systems with thermal storage: the impact of the load size and spark spread rates. Sustainable Cities and Society, Elsevier, 2019, pp.101745. �10.1016/j.scs.2019.101745�. �hal-02291242�
Page 1 of 37
Techno-Economic feasibility of Trigeneration systems with thermal
storage: the impact of the load size and spark spread rates
A B S T R A C T
Trigeneration systems with Thermal storage (CCHP-TS) allow a distributed generation of
energy. They also contribute to reducing greenhouse gas emissions by producing electricity,
heating, and cooling from the same fuel. Current research targets their operational
performance and feasibility. Nevertheless, expressing these concepts into standard criteria
could foster their adoption by investors and policy-makers.
This paper finds some rules of thumb for the technical and economic feasibility of CCHP-TS
systems. The analysis comprises 600 scenarios, assessing the impact of different levels of
spark spread (SS) rate and load size of Electricity, Heating, and Cooling. The methodology
first optimizes the energy system with DER-CAM and after analyzes the output data through
the clustering method k-means and the Multi-Criteria Decision-Making method ELECTRE 1S.
Moreover, the paper proposes the dominance load rates to quantify the relative size of
electricity, heating and cooling loads. The results show that for high SS rates, the percentage
of savings improves with the dominance of electric loads. While for small SS rates, the
improvement comes from the equilibrium of loads. Furthermore, for any SS, a high
dominance of electricity promotes the use of Absorption and Cooling Storage, reducing the
Heat Scrap.
M.Sandoval-Reyes , Pierrick Haurant ,T.R.Sandoval-Reyes , Monica Eskandera ,Carlos A.Silva , Bruno Lacarrière
Page 2 of 37
1 . INTRODUCTION
Combined Heating and Power (CHP), also known as cogeneration, is a process that
generates simultaneously thermal and electrical energy from a single fuel. The fuel could be
either fossil or non-fossil. According to CODE2 report [1], cogeneration saves upwards to
25% of the primary energy compared to the separate production of both outputs, and
nowadays 10% of the electricity consumed worldwide is produced like that [2]. This
technology can significantly reduce greenhouse gases emissions, in residential and tertiary
sectors, by lowering fuels demand and transmission losses [3].
Combined Heating, Cooling and Power (CCHP), also known as Trigeneration, is a system
that includes CHP and technologies such as heat pumps or absorption cooling systems to
produce cooling from the heat and electricity generated by the CHP. These systems can
reach overall efficiencies as high as 90%, depending on the configuration [4].
Among other fields, the implementation of cogeneration and trigeneration is taking
importance in water desalinization. Cogeneration, trigeneration, and renewable energy are
part of the configuration of the multi-stage flash thermal distillation process [5], [6].
One of the challenges of CHP and CCHP is that the production of electricity and heat is
coupled, but their demand is not. As a solution, Thermal Storage (TS) could be implemented
to decouple electricity, heating and cooling supply and therefore promote the flexibility of the system [7]–[11]. A system that includes trigeneration and thermal storage can be called CCHP-TS.
The feasibility of CHP and CCHP systems can be evaluated based on energy savings or
economic savings. For the latter, spark spread rate (SS) has been identified as the key
variable influencing the feasibility of the systems. Spark spread expresses the ratio between
Page 3 of 37
extensive regarding this variable [12]–[16] and some international governmental organisms established as a thumb rule that the technology is economically feasible when the SS rate is
higher than three [1]. In other words, when the fuel is three or more times cheaper than the
electricity from the grid.
Other key variables have been proposed in the literature to explain the feasibility of this type
of systems: for example, to evaluate the primary energy savings generated by the CCHP
system, Wang et al. [17] studied the influence of performance from different equipment and
found that the most sensitive parameter belongs to the electric generation at the separate
production system, in other words, the electric efficiency of the grid. Fumo et al [18] showed
the relevance of the electrical efficiency of CHP and found that an increase of it reduces the
primary energy use more than proportionally. The Midwest CHP Application Center [19]
highlighted the importance of having a large number of CHP operating hours (greater than
3,000 hours/year). On the other hand, Mago et al. [20] evaluated the CCHP system based
on the reduction of pollutants and identified the interest of the fuel mix used to generate
electricity at the grid of each region, therefore, the CCHP system avoids more emissions in
regions where electricity from the grid comes mainly from fossil fuels, especially coal.
In the last years, some authors have suggested that the size of energy loads also plays an
important role to evaluate the feasibility of a CHP or CCHP system. Authors such as Cardona
et al. [21], Wang et al. [17], Mago et al. [20] and Fumo et al. [22] assessed the energy
reduction generated by these systems, using respectively load rates (Heating/Electricity,
Cooling/Electricity or Heating/Cooling), load rates vs. CHP production rates, the fraction of
electricity, heating and cooling loads covered by the CCHP. Similarly, Memon et al. [23], Wu
et al. [24], Knizley et al. [25] and Hajabdollahi [26] used measures related to load size to
assess the cost reduction of CHP or CCHP systems. Memon et al. [23] analyzed the net
Page 4 of 37
The authors found that the economic feasibility improves with the rise of fuel prices and load
factors. They defined the heating and cooling load factors as the fraction of time the products are required in a year. Their parametric study included a variation between 0.2–0.5 in the heating load factor and 0.4–0.75 in the cooling load factor. Wu et al. [24] applied Mixed Integer Nonlinear Programming (MINLP) to optimize the operation strategy of a micro-CCHP,
conducting a screening analysis over a small range of SS and the size of electric and heating
loads. They concluded that the operation strategy of a micro-CCHP is affected by load size
and SS. For their part, Knizley et al. [25] proposed that the economic savings of a CHP
system can be guaranteed when the ratio between electricity and heating loads of a building
is less than three. Six out of eight case studies verify the hypothesis, using an SS=2.77.
Finally, Hajabdollahi [26] studied the influence of load rates over the selection of the optimal
prime mover for a Trigeneration system with Organic Rankine Cycle. Assuming that the loads
are constant during the whole year, the author concluded that the gas turbine is convenient
when heating loads are high, while the diesel engine is more suitable for high electric and
heating loads.
The feasibility of the CCHP-TS systems can be assessed using models, either analytic or
parametric. Authors such as Cardona et al. [27] and Angrisani et al. [28] collect data through
experimental pilot plants, that is the basis to build a parametric model. Angrisani even
formulates a set of expressions. However, it is easier to find authors who develop analytical
models. Mago et al. [20], Fumo et al. [22], Wang et al. [17], and Knizley et al. [25] are authors
who use analytical models to simulate in steady-state. The first three assess the energy and
emission reduction, and the other assesses the cost reduction. As for Wu et al. [24] and
Hajabdollahi [26] use analytical models to optimize in steady-state. They implement a
multi-objective MINLP and Genetic Algorithms (GA) respectively as optimization algorithms for the
Page 5 of 37
systems. Cardona et al. [21], [29] and Li et al. [30] assess dinamically the energy reduction
for CCHP systems using GA and quantum GA. While H. Li et al. [31] and C.Z. Li et al. [32]
formulate models to optimize cost reduction in dynamic state, using GA and MINLP
respectively. Twaha et al. [33] conducted a review of the optimization approaches commonly
used in the field of distributed energy generation. They concluded citing Sedghi et al. [34]
and stating that metaheurisitics are promissing options. Nevertheless, the use of
computational tools is a cornerstone for modeling dynamically.
Some computational tools assisting the design and operation of distributed energy generation
are BALMOREL, BCHP Screening Tool, COMPOSE, EnergyPLAN, energyPRO,
RETScreen, and DER-CAM [35]. All of these use a bottom-up approach, have at least
one-year timeframe and use hourly time-step (except for RETScreen, which time-step is on a
monthly basis). The computational tools either simulate or optimize. Simulation software such
as BCHP Screening Tool, COMPOSE, EnergyPLAN, and RETScreen reside on the idea that
the user tests different scenarios and choose the most appropriate. On the contrary, software
with optimization capabilities such as BALMOREL, energyPRO, and DER-CAM use
algorithms to get the type, size and operation schedule of technologies. But among the three,
Lyden et al. [36] emphasized the multi-objective optimization capability of DER-CAM, as well
as its multiple features for storage and load shifting.
The objective of this paper is to characterize the effect of load size and spark spread rates
as key variables for the technical and economic feasibility of CCHP-TS systems. The analysis
based on the percentage of cost savings compares the use of CCHP-TS system instead of
importing electricity from the grid and producing heating and cooling separately. DER-CAM,
a software with optimization capability, is used to do 600 simulations that result from the
combination of different load sizes and spark spread rates. Then, for the data analysis, a new
k-Page 6 of 37
means method with the Multi-Criteria Decision-Making ELECTRE 1S method. The way to
analyze data has allowed to identify the best conditions of feasibility for these systems, in
terms of loads and spark spread rates.
2 . METHODOLOGY
This paper introduces a novel methodology to systematically analyze the impact of load size
and the spark spread rates in the design of CCHP-TS systems. The proposed methodology
is represented in Figure 1.
Figure 1 General methodology
Different scenarios of CCHP-TS implementation are generated based on different levels of
electricity, heating, and cooling loads and spark spread rates, resulting in a total of 600
scenarios. The optimal system configuration for each of them is obtained through DER-CAM.
To analyze the influence of the above-mentioned variables, the data analysis consists of
clustering the scenarios, combining k-means and the ELECTRE 1S multi-criteria
decision-making (MCDM) method. Determine optimal system configuration using DER-CAM Different levels of: -Energy prices -Size of loads
Determine impact of variables using
Ternary diagrams and dominance load rates
Energy System Optimization Data Analysis
Determine relevant Functioning variables Segregate data using k-Means clustering Results interpretation Determine number of clusters using MCDM ELECTRE 1S
Page 7 of 37 2.1 ENERGY SYSTEM OPTIMIZATION
DER-CAM (Distributed Energy Resources Customer Adoption Model) is the simulation tool
used to get the optimal design and the optimal operation strategy for the different scenarios
by varying the load sizes and spark spread rates. This tool has been developed by the
Lawrence Berkeley National Laboratory (LBNL) and is used to support the investment and
planning of distributed energy resources (DER) in the context of microgrids [37], [38]. The
tool allows modeling the technologies and its operation to provide energy services such as
space heating and cooling, hot water, and electricity for appliances.
DER-CAM includes modules for thermal storage [39], demand response, ancillary grid
services [40] and multi-node modeling approach [41]. It is written and executed in GAMS and
uses Mixed Integer Linear Programming (MILP) to minimize either the annual total energy
cost, or the CO2 emissions, or both. DER-CAM has been used as a simulation tool for a number of publications for different purposes: assessing the feasibility of distributed energy
generation [42], [43]; combining the distributed generation with energy conservation
measures [44]; analyzing the performance of the electrical distribution circuit for microgrids
[45]; and even studying the integration of communication technologies and information
models for the integration and interoperability of distributed energy generation systems [46].
The energy system optimization problem of this manuscript is a MILP type (Mixed-Integer
Linear Programming). It involves non-negative integer and continuous variables. DER-CAM
uses a branch and bound (B&B) algorithm for this kind of combinatorial optimization
problems. However, the computational cost of solving a MILP problem, requires
implementing a B&B and cut algorithm. It explores every branch of the tree (possible solution)
Page 8 of 37
each branch until the difference between the integer and the continuous solutions is only 5%.
Only then, it inspects the following branch and continues with the same procedure.
DER-CAM needs three key inputs to simulate and minimize the total annual cost of an energy
system:
- The end-use energy loads Ln(t) of electricity, heating, and cooling. They are on an hourly basis for the typical days per month (week, weekend and peak days). In this
paper, their calculation comes from a homothetic transformation of the hourly load
pattern dn(𝑡) and the different levels of the annual energy load size for each n carrier Yn (Eq. 1). Note that n={E: Electricity, H: Heating, C: Cooling}
Ln(t) = ( Yn 106) dn(t) ∑8760t=1 dn(t) Eq. 1
- The tariff structure of electricity and fuel, resulting in the different spark spread rates.
In this work, electricity and natural gas tariffs are constant, independently of the day
and time.
- The characteristics of the pool of technologies available. They include the installed
capacities, efficiencies, emissions, the variable and fixed cost of the technologies:
absorption and vapor-compression chiller, boiler, thermal storage and CHP generators–ICE (Internal Combustion Engines) ranging from 75 kW to 5 MW installed capacity, CT (Combustion Turbines) and CTDB (Combustion Turbine Duct Burner)
ranging from 15 MW to 25 MW installed capacity. All this information is available on
the DER-CAM default database.
The outputs of the simulation are the optimal combination of technologies, their size, their
Page 9 of 37
consumption, the CO2 emissions, and the resulting annual costs, as well as the percentage of savings compared with a reference design of the energy system.
The reference design of the energy system in this paper considers the use of electricity from
the grid to meet electric and cooling loads (through a vapor-compression chiller), and the use
of a natural gas boiler to meet the heating loads. Figure 2 shows the configuration of the
reference design and the one using a CCHP-TS system.
Figure 2 Scheme of the units used to fulfill the hourly energy loads 𝐿𝑛(𝑡) in the reference design of the energy system and the CCHP-TS system. NOTE: Energy Supply (dotted lines) and Energy Loads (solid lines)
The solution to each simulation represents the optimal configuration of the system with
specific technologies. They are characterized by the following functioning variables.
- The generation means for each energy carrier (%Grid, %Boiler, %Absorption);
- The percentage of non-consumed heat generated by the CHP units (% Heat scrap);
- The energy flow within a CCHP-TS system (E4E, E4C, E4CS, H4H, H4C, H4CS);
- The percentage of savings (of annual cost) obtained using the CCHP-TS system
instead of the reference design.
LE Boiler Vapor-compression Chiller Grid Reference design LH LC CHP Absorption chiller Cooling storage Heat storage LE Boiler (Aux) Vapor-compression Chiller (Aux) Grid (Aux)
Trigeneration sys. with Thermal storage (CCHP-TS)
LH LC
Page 10 of 37
The functioning variables of the generation means describe if the electricity comes from the
CHP or the Grid (Eq. 2), if the heating comes from the CHP or a Boiler (Eq. 3), and if the
cooling comes from absorption or vapor-compression chiller (Eq. 4). On the other hand, the
percentage of non-consumed heat generated by the CHP units is called %Heat scrap (Eq.
5).
Percentage of Electricity imported from the Grid: % Grid = ∑ Electricityt Grid(t)
(∑ Electricityt Grid(t) + ∑ Electricityt CHP(t))
Eq. 2
Percentage of Heating produced with Boiler:
% Boiler = ∑ Heatingt Boiler(t)
(∑ Heatingt Boiler(t) + ∑ Heatingt CHP(t))
Eq. 3
Percentage of Cooling produced with Absorption Chiller: % Absorption = ∑ Coolingt Absorption(t)
(∑ Coolingt Absorption(t) + ∑ Coolingt Electric(t))
Eq. 4
Percentage of Heat Scrap:
% Heat Scrap = HtE ∑ ElectricityCHP(t)
t − ∑ HeatingCHP
(t)
t
Eq. 5
The energy flow functioning variables define how the energy produced by the CHP fulfills the
different loads (Eq. 6 to Eq. 11).
Part of the electricity generated by the CHP that is used to meet the electric load: E4E =ElectricityCHP
LE (t)
EnergyCHP(t)
Eq. 6
Part of the electricity generated by the CHP that is used to meet the cooling load through a vapor compression chiller:
E4C =ElectricityCHP
LC (t)
EnergyCHP(t)
Eq. 7
Part of the electricity generated by the CHP that is used to supply the cooling storage: E4CS =ElectricityCHP
CS (t)
EnergyCHP(t)
Eq. 8
Part of the heat produced by the CHP that is used to meet the heating load: H4H = HeatCHP
LH (t)
EnergyCHP(t)
Eq. 9
Part of the heat produced by the CHP that is used to meet the cooling load through an absorption chiller: H4C = HeatCHP
LC (t)
EnergyCHP(t)
Page 11 of 37
Part of the heat generated by the CHP that is used to supply the cooling storage: H4CS = HeatCHP
CS (t)
EnergyCHP(t)
Eq. 11
where,
The total energy generated by the CHP, expressed in hourly basis [kWh]:
EnergyCHP(t) = ElectricityCHPLE (t) + ElectricityCHPLC (t) + ElectricityCHPCS (t) + HeatCHPLH (t) + HeatCHPLC (t) + HeatCHPCS (t)
Eq. 12
2.2 DATA ANALYSIS
After simulating the scenarios with different conditions (SS and load sizes), the next step is
to identify their key characteristics. The proposal is to use a methodology combining k-means
clustering and MCDM ELECTRE 1S.
Clustering methods segregate data in relevant categories, based on a concept of similarity
or proximity. The algorithm k-means [47] is the most popular unsupervised clustering tool
used in scientific and industrial applications [48]. Several studies of the energy fields have
used it, ranging from social studies [49] to the assessment of renewable energy [50], [51] and
analysis of energy loads [52]. The clustering method k-means is used to analyze the outputs
of the 600 simulations in DER-CAM.
The main input parameter of the k-means clustering method is the desired number of subsets
or clusters 𝑘 that are used to segregate the data. The choice is not trivial because it should
be a balance between minimizing the cluster dispersion (making elements of a cluster similar
to each other) and maximizing inter-cluster dispersion (making clusters different enough from
each other). For example, a larger k minimizes the cluster dispersion because it encourages
having small clusters with more similar elements within them. However, a larger k could also
cause that those small clusters have similar properties, that could allow to aggregate them in
Page 12 of 37
Establishing 𝑘 could base on the knowledge of the data behavior [53]. Otherwise, there are
different approaches to determine it. Some authors compare the variance within groups vs.
the variance between the groups, making sure that the latter is larger [54]; other use the silhouette and the Calinski–Harabasz criteria [55]; others like Ramos [52] conclude that none of the possible methods get the best result for all datasets. The authors of this work propose
a methodology based on MCDM (Multi-criteria Decision-Making) that ensures dense clusters
(with low dispersion inside) and large separation among them, measuring this at different
relative distances of their centers. One of the most well-known families in MCDM is ELECTRE
and its variations. It can be used in choice, ranking or sorting decision-making problems.
Therefore, this paper uses MCDM ELECTRE 1S to evaluate different alternatives for the
value of k under the opposing decision criteria.
K-means and ELECTRE 1S methods are combined to segregate data in relevant categories.
First, each data point corresponds to one DER-CAM simulation, consolidating a vector of
different segregation parameters. The segregation parameters come from the pool of
functioning variables introduced in the section 2.1. Their selection relies on a feature filtering
technique that uses correlation indexes to determine the relevance of each parameter. After, these data points are classified with k-means using 19 different values of k ϵ [2,20] clusters, generating a set of 19 alternatives 𝐴 = { a1: 𝑘 = 2, a2: 𝑘 = 3, ⋯ , a19: 𝑘 = 20}. These different values of k give origin to several clustering alternatives that are compared pair by pair with
the MCDM ELECTRE 1S method. The decision criteria in MCDM are the number of clusters
k, the intra-cluster distances, and the inter-cluster distances. Additionally, there is a constraint
to set eight data points (simulations) as the minimum cluster size. Finally, the authors select
the clustering alternative with the k value that minimizes the cluster dispersion and maximizes
Page 13 of 37
3. RESULTS AND DISCUSSION
3.1 CASE STUDY
The methodology applies to the hourly load profile of a University Campus, as an example of
a large set of buildings with use patterns equivalent to office buildings.
This University Campus is the IST – Alameda Campus in Lisbon, Portugal. It is a typical university comprising 26 buildings including classrooms, labs, multiple cafeterias with cooking
installations, sports facilities and a day nursery. The campus is used during weekdays by
students, faculty members, researchers, and general staff. The activity reduces during
weekends and holidays (August, Christmas and New Year).
Figure 3 presents the normalized campus hourly patterns of electricity, heating and cooling
loads [dn]. This data comes from the energy analysis performed with EnergyPlus calibrated with real data as part of the Project Campus Sustentável at the IST – Alameda Campus [56]. It is possible to observe the behavior of energy loads across the 8760 hours of the year and
notice that they decay for the three energy carriers every weekend and during the first two
weeks of August. For weekdays, electricity load reaches its maximum during
January-February, the minimum during the first two weeks of August and the rest of the year is in
general 60% of the maximum values. The heating highest values are from December to
February and the cooling load spans from March to November, with the maximum from June
Page 14 of 37
Figure 3 The pattern of the Electricity, Heating and Cooling loads for the IST Alameda Campus, expressed in hourly basis. NOTE: Electricity loads in this chart represent ONLY electricity demand, not the one used for cooling.
The study evaluates a set of scenarios, varying the size of Electricity, Heating and Cooling
loads, as well as the Spark Spread rate in different levels.
The levels of the annual energy load of each n carrier Yn are selected in a logarithmical way, to test different orders of magnitude in terms of load size. The levels (in GWh/y) are YE = {0.1, 1,10,100,500,1000} , YH= {0.1, 1,10,100,400}, and YC = {0.1, 1,10,100,500}. Cooling loads are in the amount of electricity required by a vapor-compression chiller to generate the
cooling. This study considers a COP of the vapor-compression chiller equal to 4.5 [57], [58]
and 0.8 for the absorption chiller [59]. Regarding the Spark Spread rate, it varies in four levels
SS = {3.0, 3.9, 5.4, 6.6}. These rates correspond to spark spread rates in different regions
around the world (two in Europe, Africa, and the US respectively) [57], [60].
Then, a full factorial experimental design is followed, testing the 600 scenarios resulting from
the combination of six levels for electricity, five levels of heating, five levels of cooling and
four levels of SS rate.
3.2 ENERGY SYSTEM OPTIMISATION USING DER-CAM
The energy analysis includes the simulation in DER-CAM for each of the 600 scenarios. The
Page 15 of 37
installing a CCHP-TS system is economically feasible only for 422 out of the 600 scenarios.
For the rest, it is cheaper to use the reference design of the energy system defined in Figure
2.
SS1 = 3.0 SS2 =3.9 SS3 = 5.4 SS4 = 6.6 Number of Feasible scenarios
(422 out of 600) 50 out of 150 118 out of 150 118 out of 150 136 out of 150 Maximum % cost savings 6.6% 21.8% 25.2% 42.9% Average % cost savings 4.3% 12.1% 15.1% 26.7% Minimum % cost savings 2.9% 1.1% 1.1% 1.6%
Table 1 General information of the energy analysis for the scenarios belonging to the different SS rates
Both, the number of feasible scenarios and the average percentage of savings, increase with
the spark spread rate. A larger SS means a higher difference in price between the electricity
imported from the grid and the fuel to run the CHP (natural gas for this paper). Therefore, a
larger SS improves the economic advantage of producing electricity in-house with the CHP.
3.3 DATA ANALYSIS USING CLUSTERING WITH MCDM
The implementation of the methodology for the data analysis suggests that the best
alternative is to group the solutions into three clusters (k=3) for SS1 and six clusters (k=6) for
SS2, SS3, and SS4. According to the feature filtering technique, the segregation criterion in
SS1 is the percentage of savings, while the other use the savings, Grid, Boiler, Absorption,
and energy flows.
The clusters group solutions according to similarities in the features before mentioned. Figure
Page 16 of 37
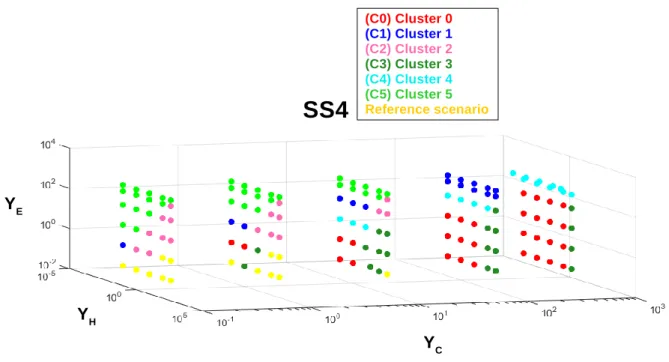
Figure 4 Clusters across the axis of annual loads 𝑌𝐸 , 𝑌𝐻 , 𝑌𝐶 (example of SS1).
Figure 4 illustrates that the solutions within each cluster share common characteristics
regarding load size. Therefore, to delve deeper into the impacts of the spark spread rate and
the size of loads, the analysis is structured as follows:
Analysis of generation mean for each energy carrier
Analysis of energy flows within the CCHP-TS system
Analysis of the percentage of savings
The results analysis in the following sections is in terms of the load dominance rates rn (Eq. 13 to Eq. 15). They are parameters, defined by the authors of this paper, to measure the
relative weight of the annual loads of electricity, heating, and cooling (YE, YH, and YC respectively).
Dominance rate for annual electricity load
rE=
YE
YE+ YH+ YC
Eq. 13
Dominance rate for annual heating load
rH= YH YE+ YH+ YC Eq. 14 YE YH YC (C0) Cluster 0 (C1) Cluster 1 (C2) Cluster 2 (C3) Cluster 3 (C4) Cluster 4 (C5) Cluster 5 Reference scenario
SS4
Page 17 of 37
Dominance rate of annual cooling load
rC=
YC
YE+ YH+ YC
Eq. 15
These three dominance rates are complementary numbers to make one (rE+ rH+ rC = 1). Then, using them in ternary diagrams aims to show the behavior of the functioning variables
and compare them among the spark spread rates. Each vertex of the ternary diagrams
represents dominance rates equal to 1 for each energy carrier. In other words, the left, right,
and top vertices represent respectively Heat, Cooling, and Electricity load only. Each square
in the diagram embodies a scenario, while the size reflects the value of the characterization
variable. The colors identify the different clusters that are particularly relevant for the analysis
of the percentage of savings. However, the color code keeps for all the section to facilitate
tracking and analyzing the different simulations across all the functioning variables.
The following two subsections analyze the results for each functional variable. They focus on
describing the behavior of them, across the load dominance and spark spread rates. The
relevance relies on showing the operational and financial performance of the CCHP-TS
system under different conditions. Subsection 3.3.2 describes the behavior of the percentage
of savings and makes clear that the spark spread strongly affects its value. Moreover, the
analysis addresses two cases: when the spark spread is equal to 3, and when it is higher
than 3. Each case has a distinct behavior of the percentage of savings depending on the load
dominance rates.
3.3.1 ANALYSIS OF GENERATION MEANS FOR EACH ENERGY CARRIER
This section aims to characterize the generation means for the energy carriers, given the
Page 18 of 37
Figure 5 Ternary diagram for the distribution of the percentage of Grid, Boiler, Absorption, and Heat Scrap across dominance rates (𝑟𝐸 , 𝑟𝐻 , 𝑟𝐶) and SS rates.
PERCENTAGE OF GRID
The percentage of the grid measures how much electricity is imported from the grid, apart
from the electricity that results from the CHP units. This electricity can be used directly to
%
G
ri
d
%
A
b
s
%
B
o
il
e
r
%
H
e
a
tS
c
ra
p
For SS2-SS4 (C0) Cluster 0 (C1) Cluster 1 (C2) Cluster 2 (C3) Cluster 3 (C4) Cluster 4 (C5) Cluster 5SS1
SS2
SS3
SS4
For SS1 (C0) Cluster 0 (C1) Cluster 1 (C2) Cluster 2 Size 99% 66% 33% 1% Size 94% 64% 33% 2% Size 92% 62% 31% 1% Size 44% 30% 16% 1%Page 19 of 37
meet electric load or to produce cooling through vapor compression chillers. Figure 5
presents the ternary diagrams in terms of percentage of the grid.
For all the spark spread and especially for SS1=3, the percentage of the grid reduces in two
cases. First, when the heating load dominates because it does not need the grid to cover
them. Second, when the dominance of loads is balanced (referring to the points in the middle
of the diagrams). It suggests that a load balance promotes the usage of the CCHP-TS
system, especially for SS1.
For SS2-SS4 (when the spark spread rate is larger than 3), the percentage of the grid is small
when the dominance of electric load is high. Therefore, this condition promotes the use of the
CCHP-TS system.
In contrast, the percentage of the grid is high when cooling load dominates. It is because it is
more convenient to use vapor compression chiller powered by the grid under these
circumstances. There is more detail of this in the analysis corresponding to the percentage
of absorption.
The analysis above points out that the behavior and trend of %Grid in SS1 is slightly different
from SS2-SS4. In the latter, the use of CCHP-TS systems is especially feasible when electric
load dominates.
PERCENTAGE OF BOILER
The percentage of Boiler measures how much heating is provided directly from a natural gas
boiler. For all the SS rates, it is larger when the heating load dominates, rH (Figure 5). Therefore, heating load alone never justifies the use of CHP, and then Boiler is used as the
generation unit. Note that the trend and average value (square size) are the same for all the
Page 20 of 37
PERCENTAGE OF ABSORPTION AND HEAT SCRAP
The percentages of Absorption and Heat Scrap are large when electric loads dominate
(Figure 5). Because when there is a surplus of heat produced by the CHP, the Absorption is
used as much as possible, trying to reduce the Heat Scrap.
On the contrary, Absorption and Heat Scrap are small when cooling loads dominate. Because
in those cases there is a preference for vapor-compression chiller, due to the large difference
in COP (4.5 for vapor-compression [58] and 0.8 for absorption [59]).
Notice that some of the clusters with the highest percentage of savings also have the largest
percentages of Heat Scrap. Therefore, these two variables are not directly correlated. The
reason is that from the economic point of view (and not strictly from the energy point of view),
it is cheaper to produce electricity rather than buying it from the grid, even if it produces a
surplus of heat.
The trends for the percentage of Absorption and Heat Scrap are the same for all the SS rates.
The only difference is the number of feasible scenarios that reduce accompanying the SS
rate.
3.3.2 ANALYSIS OF THE ENERGY FLOWS WITHIN THE CCHP-TS SYSTEM
Regarding the energy flow variables (Figure 6), the main flows of CHP (electricity and heat) –E4E, E4C, H4H, and H4C– have the same trend and average value (square size) across the spark spread rates. In other words, they are equal for all SS rates, except that the number of feasible scenarios reduces. In contrast, the flows for the storage –E4CS and H4CS– are different in square size (average value) but follow the same trend across the different SS
Page 21 of 37
As expected, E4E grows with the electric dominance rE, and H4H grows with the heating dominance rH. While E4C and H4C grow with the cooling dominance rC, but these are respectively more representative when Electric and Heating dominance is low.
On the other hand, the Cooling Storage gives flexibility to the CCHP-TS systems because it
decouples its production and consumption. The functioning variables E4CS and H4CS
(Figure 6) indicate if the accumulated cooling is produced with electricity or heat respectively.
In general, E4CS and H4CS are small, but they are slightly more representative for SS4=6.6.
Because a high SS favors the use of CHP for electricity loads, leaving the heat as co-product
and available to produce cooling and store it. E4CS is larger in clusters C0 and C3 (from
SS2-SS4) because it is preferable using the vapor-compression chiller when cooling loads
dominate (C0: rC=98% and C3: rC=58%). On the other hand, H4CS exists when rE ≫ rH, using heat from the CHP to produce cooling and store it. Therefore, Cooling Storage
Page 22 of 37
Figure 6 Ternary diagram for the distribution of E4E, E4C, E4CS, H4H, H4C and H4CS across dominance rates (𝑟𝐸 , 𝑟𝐻 ,
𝑟𝐶) and SS rates. For SS1 (C0) Cluster 0 (C1) Cluster 1 (C2) Cluster 2 For SS2-SS4 (C0) Cluster 0 (C1) Cluster 1 (C2) Cluster 2 (C3) Cluster 3 (C4) Cluster 4 (C5) Cluster 5
SS1
SS2
SS3
SS4
%
E
4
E
%
H
4
H
%
E
4
C
%
H
4
C
%
E
4
C
S
%
H
4
C
S
Size 100% 67% 34% 1% Size 60% 41% 21% 1% Size 56% 38% 19% 1% Size 56% 38% 19% 1% Size 16% 11% 6% 1% Size 12% 8% 4% 1%Page 23 of 37 3.3.3 ANALYSIS OF THE PERCENTAGE OF SAVINGS
This section analyzes the percentage of cost savings reached by using the CCHP-TS system
compared to the reference design of the energy system. For better characterization, the
analysis divides the cases when the spark spread is higher than three, and when it is equal
to three.
THE CASES OF SS > 3
This section analyzes the feasible scenarios corresponding to SS2=3.9, SS3=5.4, and
SS4=6.6. Note from Figure 7 that the three have the same number of clusters (six clusters).
Moreover, these clusters have similar characteristics along the three SS rates. The following
paragraph gives a brief outline of each cluster, making some references to the
characterization variables of section 3.3.2.
Cluster C5 consolidates the scenarios where electric load dominates and use the CHP almost
exclusively to cover it (high E4E and low %Grid). For scenarios in C1, electricity load
dominates slightly more than cooling. Therefore, electricity from the CHP covers the
corresponding load and the heat is used to produce cooling (refer to the analysis of E4E, and
H4C). Regarding C4, it is a cluster with a shared dominance between electricity and cooling
demand, then it uses CHP electricity production to cover electric demand, and uses both,
electricity and heat, to cover cooling demand (refer to the analysis of E4E, E4C, and H4C).
As for C2 has a shared dominance between electricity and heat demand, therefore, uses
CHP to cover these demands directly (refer to the analysis of E4E, and H4H). On the other
hand, C0 consolidates scenarios where the cooling demand is very high and then it uses
Page 24 of 37
E4C, and H4C). Finally, C3 has a shared dominance between heat and cooling demand, so,
it uses electricity to produce cooling and heat to cover the demand (refer to the analysis of
H4H, and E4C).
Regarding the percentage of savings, indicated by the size of the squares at Figure 7, the
smaller are at the bottom-left of the three diagrams (rH→1) and the larger at the top (rE→1). In other words, the dominance of the electric load favors the percentage of savings for the
CCHP-TS systems. In contrast the dominance of heating loads disfavors it. Regarding the
dominance of cooling, this diagram does not allow to draw conclusions.
On the other hand, the difference among SS2, SS3, and SS4 is that the percentage of savings
increases with the spark spread rate (Table 1 and Figure 7) because a higher SS makes
more feasible to produce electricity in-house.
Figure 7 Ternary diagrams of SS2, SS3 and SS4 for the distribution of the percentage of savings across dominance rates (𝑟𝐸 , 𝑟𝐻 , 𝑟𝐶)
Note that the percentage of savings are represented by the square size
Figure 8 shows boxplots for each cluster in terms of the percentage of savings and rE – rH – rC. It allows confirming the remark from the ternary diagram of Figure 7. The clusters with the largest dominance of electric load have the largest average percentage of savings (C5:
For SS2-SS4 (C0) Cluster 0 (C1) Cluster 1 (C2) Cluster 2 (C3) Cluster 3 (C4) Cluster 4 (C5) Cluster 5
SS2
SS3
SS4
Size 40% 27% 14% 1%%s
a
v
in
g
s
Page 25 of 37
rE=92% and %savings=39%; C1: rE=60% and %savings=37%). The clusters with middle dominance of electric load have a middle average percentage of savings (C4: rE=22% and %savings=33%; C2: rE=30% and %savings=23%). Note that C2 has larger rE than C4, but the latter has a better percentage of savings. The reader could think that it contradicts the
established trend above. However, this situation is related to the larger dominance of cooling
load (rC) in C4. The analysis of the percentage of absorption in section 3.3.1 shows that C4 uses more vapor-compression chiller than C2. Therefore, the trend established is still valid
because the cooling load of C4 contributes to an increase in the electric load. Finally, the
clusters with lower dominance of electric load have the lowest average percentage of savings
(C0: rE=7% and %sav=16%; C3: rE=3% and %sav=11%). This pair of clusters is an excellent example of the low impact that the heating and cooling loads have over the percentage of
savings when electric loads are not present. For the dominance of cooling loads, note that
C0 and C3 have the largest rC among all the clusters. Section 3.3.1 shows that they are covered mostly with a vapor-compression chiller. However, this transformation of cooling
loads into electric one is not enough to drive savings up. On the other hand, the dominance
of heating loads (rH) also demonstrates a lack of relevance since both clusters have the same level of %savings, although only C3 has larger heating loads.
Page 26 of 37
Figure 8 Boxplots comparing 𝑟𝐸, 𝑟𝐻, 𝑟𝐶, and the percentage of savings for each cluster across the spark spread rates SS2-SS3-SS4.
THE CASE OF SS=3
This section analyzes the 50 scenarios that are feasible with SS1=3. Note that the scenarios
in SS1, different from SS2-SS3-SS4, have a lower percentage of savings and are segregated
into three clusters only. The ternary diagram in Figure 9 shows them distributed according to
their dominance load rates.
Figure 9 Ternary diagrams of SS1 for the distribution of the percentage of savings across dominance rates (𝑟𝐸 , 𝑟𝐻 , 𝑟𝐶) Note that the percentage of savings are represented by the square size
SS1
Size 6.6% 5.6% 2.9% For SS1 (C0) Cluster 0 (C1) Cluster 1 (C2) Cluster 2%s
a
v
in
g
s
Page 27 of 37
Cluster C1 consolidates the scenarios with the highest percentage of savings (bigger
squares). It is in the middle-right of the ternary diagram, corresponding to a balance among
the loads with a slight trend to a low dominance of heating.
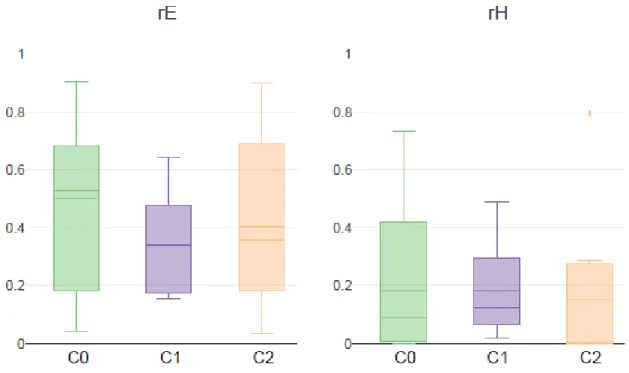
Figure 10 presents the boxplots of dominance load rates and the percentage of savings for
the three clusters. The chart shows that all the scenarios in C1 present the three loads, as
well as the highest savings. In contrast, the other clusters take more frequently low or
inexistent dominance rates for one or two energy vectors. The boxplots also show big ranges
of variation for rE – rH – rC, even in the case of C1. Then, the higher percentage of savings in SS1=3 relates to the balance of Electric, Heating, and Cooling loads, but the variation for
this balance is wide.
Page 28 of 37
Figure 10 Boxplots comparing 𝑟𝐸, 𝑟𝐻, 𝑟𝐶, and the percentage of savings for each cluster across the spark spread rate SS1 = 3.0
The finding in this section regarding the relationship between the savings and the balance of
loads is aligned with the study presented by Knizley et al. [25]. They use an SS rate=2.77
and propose that the monthly economic savings of a CHP system are likely to occur if
electricity loads are not much larger than the heating loads (these authors measure it with
the monthly PHR). They verified their hypothesis with seven out of eight case studies
(buildings).
3.4 SUMMARY OF RESULTS
The results stemming from the proposed analysis indicate that the design of systems should
follow different guidelines depending on the spark spread and the load dominance rates. For
low spark spreads (SS=3), the load should be balanced among the energy vectors. While for
Page 29 of 37
The trend for the percentage of Boiler, Absorption and Heat Scrap are the same for all the
SS rates, differing only in the number of feasible scenarios. It is more profitable to use the
boiler when heating loads dominate. Absorption for cooling is only economically better when
the cooling loads are relatively low. Furthermore, the advantage of using absorption is that it
reduces the heat scrap and fosters the operation of cooling storage.
In general, heat scrap does not affect the percentage of savings. Meaning that it is more
profitable to oversize heat production and ensure that the CHP covers the electricity load.
4. CONCLUSIONS
This work demonstrated the importance of analyzing multiple scenarios of energy load size
and spark spread rates to assess the techno-economic feasibility of a Trigeneration system
with Thermal Storage (CCHP-TS). The methodology proposed combines the energy system
optimization, the clustering method k-means, and the Multi-Criteria Decision-Making method
ELECTRE 1S. The results highlight the interest of using load dominance rates rE, rH, rC to assess this feasibility.
A threshold in the Spark Spread rate (SS) influences the techno-economic feasibility of a
CCHP-TS system. For high SS levels (3.9, 5.4 and 6.6), the dominance of electric load rE improves the percentage of savings obtained. On the other hand, for low SS rates (equal to
3.0), an equilibrium in the dominance rates rE, rH and rC increases the percentage of savings. The work also reveals the importance of electricity loads for any spark spread rate, because
the use of CCHP-TS is feasible when these exist or even dominate. In contrast, heating loads
do not have the same relevance because the system could be feasible despite a high
percentage of Heat Scrap. In general, when heating or cooling loads dominate, it is preferable
Page 30 of 37
On the other hand, electric load dominance favors the use of Absorption and Cooling Storage
(H4CS), because they help to reduce the Heat Scrap. This behavior is stronger with larger
SS rates.
Overall, the proposed methodology allowed to analyze multiple optimal scenarios resulting
from the use of DER-CAM. As a result, this feasibility analysis brings further insights on the
rules of thumb for the design of CCHP-TS systems.
Future work considers expanding further on the methodology and includes sensitivity analysis
methods to narrow the search space.
A C K N O W L E D G E M E N T
The authors would like to thank Rui Pereira and João Patricio from the Project Campus
Sustentável at the Instituto Superior Técnico, and Diana Neves, from IN+, Instituto Superior
Técnico, Universidade de Lisboa, for their help to get the hourly loads distribution of the IST – Alameda Campus.
Also, our sincere thanks to Gonçalo Cardoso and the Energy Storage & Distributed
Resources Division of the Lawrence Berkeley National Laboratory, for providing the
DER-CAM training and for their technical assistance in this study.
This work was performed within the framework of the Erasmus Mundus Joint Doctorate
SELECT+ program Environomical Pathways for Sustainable Energy Services and funded
with support from the Education, Audiovisual, and Culture Executive Agency (EACEA) (Nr
Page 31 of 37
This publication reflects the views only of the author(s), and the Commission cannot be held
responsible for any use, which may be made of the information contained therein.
R E F E R E N C E S
[1] CODE2 - Cogeneration Observatory and Dissemination Europe, “European cogeneration roadmap,” no. January, 2015.
[2] Cogeneration and District Energy. OECD, 2009.
[3] G. Angrisani, A. Akisawa, E. Marrasso, C. Roselli, and M. Sasso, “Performance assessment of cogeneration and trigeneration systems for small scale applications,”
Energy Convers. Manag., vol. 125, pp. 194–208, 2016.
[4] L. Fu, X. L. Zhao, S. G. Zhang, Y. Jiang, H. Li, and W. W. Yang, “Laboratory research on combined cooling, heating and power (CCHP) systems,” Energy Convers. Manag., vol. 50, no. 4, pp. 977–982, 2009.
[5] M. Shatat, M. Worall, and S. Riffat, “Opportunities for solar water desalination worldwide : Review,” Sustain. Cities Soc., vol. 9, pp. 67–80, 2013.
[6] X. Luo, Y. Zhu, J. Liu, and Y. Liu, “Design and analysis of a combined desalination and standalone CCHP (combined cooling heating and power) system integrating solar energy based on a bi-level optimization model,” Sustain. Cities Soc., vol. 43, no. June, pp. 166–175, 2018.
[7] X. Song, L. Liu, T. Zhu, T. Zhang, and Z. Wu, “Comparative analysis on operation strategies of CCHP system with cool thermal storage for a data center,” Appl. Therm.
Eng., vol. 108, pp. 680–688, 2016.
[8] W. Liu, G. Chen, B. Yan, Z. Zhou, H. Du, and J. Zuo, “Hourly operation strategy of a CCHP system with GSHP and thermal energy storage (TES) under variable loads: A case study,” Energy Build., vol. 93, pp. 143–153, 2015.
[9] A. D. Smith, P. J. Mago, and N. Fumo, “Benefits of thermal energy storage option combined with CHP system for different commercial building types,” Sustain. Energy
Technol. Assessments, vol. 1, no. 1, pp. 3–12, 2013.
[10] G. Pagliarini and S. Rainieri, “Modeling of a thermal energy storage system coupled with combined heat and power generation for the heating requirements of a
Page 32 of 37
[11] S. Paiho et al., “Increasing flexibility of Finnish energy systems—A review of potential technologies and means,” Sustain. Cities Soc., vol. 43, no. September, pp. 509–523, 2018.
[12] A. D. Smith, N. Fumo, and P. J. Mago, “Spark spread - A screening parameter for combined heating and power systems,” Appl. Energy, vol. 88, no. 5, pp. 1494–1499, 2011.
[13] K. C. Kavvadias, “Energy price spread as a driving force for combined generation investments: A view on Europe,” Energy, vol. 115, pp. 1632–1639, 2016.
[14] M. B. Tookanlou, M. M. Ardehali, and M. E. Nazari, “Combined cooling, heating, and power system optimal pricing for electricity and natural gas using particle swarm optimization based on bi-level programming approach: Case study of Canadian energy sector,” J. Nat. Gas Sci. Eng., vol. 23, pp. 417–430, 2015.
[15] P. Fonseca, G. Markogiannakis, C. Kofod, and N. Feilberg, “Characterization of the household electricity consumption in the EU , potential energy savings and specifi c policy recommendations,” pp. 781–793, 2020.
[16] D. Chan, M. Cameron, and Y. Yoon, “Key success factors for global application of micro energy grid model,” Sustain. Cities Soc., vol. 28, pp. 209–224, 2017.
[17] J. J. Wang, Y. Y. Jing, C. F. Zhang, and Z. J. Zhai, “Performance comparison of combined cooling heating and power system in different operation modes,” Appl.
Energy, vol. 88, no. 12, pp. 4621–4631, 2011.
[18] N. Fumo, P. J. Mago, and L. M. Chamra, “Energy and economic evaluation of cooling, heating, and power systems based on primary energy,” Appl. Therm. Eng., vol. 29, no. 13, pp. 2665–2671, 2009.
[19] Midwest CHP Application Center and Avalon Consulting Inc., “Combined Heat and Power Resource Guide,” p. 59, 2005.
[20] P. J. Mago, N. Fumo, and L. M. Chamra, “Methodology to perform a non-conventional evaluation of cooling, heating, and power systems,” Proc. Inst. Mech. Eng. Part A J.
Power Energy, vol. 221, no. 8, pp. 1075–1087, 2007.
[21] E. Cardona, A. Piacentino, and F. Cardona, “Energy saving in airports by
trigeneration. Part I: Assessing economic and technical potential,” Appl. Therm. Eng., vol. 26, no. 14–15, pp. 1427–1436, 2006.
[22] N. Fumo and L. M. Chamra, “Analysis of combined cooling, heating, and power systems based on source primary energy consumption,” Appl. Energy, vol. 87, no. 6, pp. 2023–2030, 2010.
Page 33 of 37
[23] A. G. Memon and R. A. Memon, “Parametric based economic analysis of a
trigeneration system proposed for residential buildings,” Sustain. Cities Soc., vol. 34, no. February, pp. 144–158, 2017.
[24] J. Y. Wu, J. L. Wang, and S. Li, “Multi-objective optimal operation strategy study of micro-CCHP system,” Energy, vol. 48, no. 1, pp. 472–483, 2012.
[25] A. Knizley, P. J. Mago, and J. Tobermann, “Evaluation of the operational cost savings potential from a D-CHP system based on a monthly power-to-heat ratio analysis,”
Cogent Eng., vol. 2, no. 1, pp. 1–13, 2015.
[26] H. Hajabdollahi, “Investigating the effects of load demands on selection of optimum CCHP-ORC plant,” Appl. Therm. Eng., vol. 87, pp. 547–558, 2015.
[27] E. Cardona and A. Piacentino, “A measurement methodology for monitoring a CHCP pilot plant for an office building,” Energy Build., vol. 35, no. 9, pp. 919–925, 2003. [28] G. Angrisani, A. Rosato, C. Roselli, M. Sasso, and S. Sibilio, “Experimental results of
a micro-trigeneration installation,” Appl. Therm. Eng., vol. 38, pp. 78–90, 2012.
[29] E. Cardona, P. Sannino, A. Piacentino, and F. Cardona, “Energy saving in airports by trigeneration. Part II: Short and long term planning for the Malpensa 2000 CHCP plant,” Appl. Therm. Eng., vol. 26, no. 14–15, pp. 1437–1447, 2006.
[30] B. Li, P. Hu, N. Zhu, F. Lei, and L. Xing, “Performance analysis and optimization of a CCHP-GSHP coupling system based on quantum genetic algorithm,” Sustain. Cities
Soc., vol. 46, no. January, p. 101408, 2019.
[31] H. Li, R. Nalim, and P. A. Haldi, “Thermal-economic optimization of a distributed multi-generation energy system - A case study of Beijing,” Appl. Therm. Eng., vol. 26, no. 7, pp. 709–719, 2006.
[32] C. Z. Li, Y. M. Shi, and X. H. Huang, “Sensitivity analysis of energy demands on performance of CCHP system,” Energy Convers. Manag., vol. 49, no. 12, pp. 3491– 3497, 2008.
[33] S. Twaha and M. A. M. Ramli, “A review of optimization approaches for hybrid distributed energy generation systems: Off-grid and grid-connected systems,”
Sustain. Cities Soc., vol. 41, no. January, pp. 320–331, 2018.
[34] M. Sedghi, A. Ahmadian, and M. Aliakbar-Golkar, “Assessment of optimization algorithms capability in distribution network planning: Review, comparison and modification techniques,” Renew. Sustain. Energy Rev., vol. 66, pp. 415–434, 2016. [35] D. Connolly, H. Lund, B. V. Mathiesen, and M. Leahy, “A review of computer tools for
Page 34 of 37 Energy, vol. 87, no. 4, pp. 1059–1082, 2010.
[36] A. Lyden, R. Pepper, and P. G. Tuohy, “A modelling tool selection process for planning of community scale energy systems including storage and demand side management,” Sustain. Cities Soc., vol. 39, no. August 2017, pp. 674–688, 2018. [37] M. Stadler, M. Groissböck, G. Cardoso, and C. Marnay, “Optimizing Distributed
Energy Resources and building retrofits with the strategic DER-CAModel,” Appl.
Energy, vol. 132, pp. 557–567, 2014.
[38] M. Stadler et al., “DER - CAM User Manual,” pp. 1–55, 2016.
[39] D. Steen, M. Stadler, G. Cardoso, M. Groissböck, N. DeForest, and C. Marnay, “Modeling of thermal storage systems in MILP distributed energy resource models,”
Appl. Energy, vol. 137, pp. 782–792, 2015.
[40] G. Cardoso, M. Stadler, S. Mashayekh, and E. Hartvigsson, “The impact of ancillary services in optimal DER investment decisions,” Energy, vol. 130, pp. 99–112, 2017. [41] S. Mashayekh, M. Stadler, G. Cardoso, and M. Heleno, “A mixed integer linear
programming approach for optimal DER portfolio, sizing, and placement in multi-energy microgrids,” Appl. Energy, vol. 187, no. Cl, pp. 154–168, 2017.
[42] E. R. Morgan, S. Valentine, C. A. Blomberg, E. R. Limpaecher, and E. V. Dydek, “Boston Community Energy Study – Zonal Analysis for Urban Microgrids,”
Massachusetts Inst. Technol. Lincoln Lab., 2016.
[43] Grid Integration Group - LBNL, “California CHP Potential In 2030,” 2016. [44] E. S. Lee, C. Gehbauer, B. E. Coffey, A. McNeil, M. Stadler, and C. Marnay,
“Integrated control of dynamic facades and distributed energy resources for energy cost minimization in commercial buildings,” Sol. Energy, vol. 122, pp. 1384–1397, 2015.
[45] J. Jung and M. Villaran, “Optimal planning and design of hybrid renewable energy systems for microgrids,” Renew. Sustain. Energy Rev., vol. 75, no. August 2015, pp. 180–191, 2017.
[46] G. Ghatikar, S. Mashayekh, M. Stadler, R. Yin, and Z. Liu, “Distributed energy
systems integration and demand optimization for autonomous operations and electric grid transactions,” Appl. Energy, vol. 167, no. 2016, pp. 432–448, 2016.
[47] M. A. Hartigan and M. A. Wong, “Algorithm AS 136 : A K-Means Clustering Algorithm,” J. R. Stat. Soc., vol. 28, no. 1, pp. 100–108, 1979.
[48] J. Kogan, C. Nicholas, and M. Teboulle, Grouping multidimensional data: Recent
Page 35 of 37
[49] R. García Ochoa and B. Graizbord Ed, “Privation of energy services in Mexican households: An alternative measure of energy poverty,” Energy Res. Soc. Sci., vol. 18, pp. 36–49, 2016.
[50] G. Grigoras and F. Scarlatache, “An assessment of the renewable energy potential using a clustering based data mining method. Case study in Romania,” Energy, vol. 81, pp. 416–429, 2015.
[51] P. A. Sánchez-Pérez, M. Robles, and O. A. Jaramillo, “Real time Markov chains: Wind states in anemometric data,” J. Renew. Sustain. Energy, vol. 8, no. 2, 2016. [52] S. Ramos, J. M. Duarte, F. J. Duarte, and Z. Vale, “A data-mining-based
methodology to support MV electricity customers’ characterization,” Energy Build., vol. 91, pp. 16–25, 2015.
[53] E. Estrada, R. Maciel, A. Ochoa, B. Bernabe-Loranca, D. Oliva, and V. Larios, “Smart City Visualization Tool for the Open Data Georeferenced Analysis Utilizing Machine Learning,” Int. J. Comb. Optim. Probl. Informatics, vol. 9, no. 2, pp. 25–40, 2018. [54] G. Cruz-Cárdenas, J. T. Silva, S. Ochoa-Estrada, F. Estrada-Godoy, and J.
Nava-Velázquez, “Delineation of Environmental Units by Multivariate Techniques in the Duero River Watershed, Michoacán, Mexico,” Environ. Model. Assess., vol. 22, no. 3, pp. 257–266, 2017.
[55] R. Silva-Flores, J. C. Hernández-Díaz, and C. Wehenkel, “Does community-based forest ownership favour conservation of tree species diversity? A comparison of forest ownership regimes in the Sierra Madre Occidental, Mexico,” For. Ecol. Manage., vol. 363, pp. 218–228, 2016.
[56] Instituto Superior Técnico, “Campus Sustentável.” [Online]. Available:
http://sustentavel.unidades.tecnico.ulisboa.pt/quem-somos/683-2/. [Accessed: 01-Jun-2018].
[57] Lawrence Berkeley National Laboratory - University of California, “DER-CAM Web Optimization tool.” [Online]. Available: https://microgrids2.lbl.gov.
[58] M. A. Alzoubi and T. Zhang, “Characterization of Energy Efficient Vapor Compression Cycle Prototype with a Linear Compressor,” Energy Procedia, vol. 75, no. 2, pp. 3253–3258, 2015.
[59] M. A. Abd Majid, S. A. Sulaiman, T. Fujii, and Naono, “Studies on Steam Absorption Chillers Performance at a Cogeneration Plant,” MATEC Web Conf., vol. 13, p. 05003, 2014.
Page 36 of 37
https://ec.europa.eu/eurostat/statistics-explained/index.php/File:Electricity_and_gas_prices,_second_half_of_year,_2013– 15_(EUR_per_kWh)_YB16-fr.png.
A C R O N Y M S
CCHP Combined Heating, Cooling, and Power (Trigeneration)
CHP Combined Heating and Power (Cogeneration)
MCDM Multi-Criteria Decision-Making
SS Spark Spread
TS Thermal Storage
Nomenclature
CoolingAbsorption(t) Cold produced with an Absorption chiller, at hour t [kWh]
CoolingElectric(t) Cold produced with vapor-compression chiller, at hour t [kWh]
dn(t) Hourly load pattern of the n energy carrier, where n={E,H,C} [-/h]
ElectricityCHP(t) Electricity produced by CHP, at hour t [kWh]
ElectricityGrid(t) Electricity imported from the national grid, at hour t [kWh]
ElectricityCHPCS (t)
Electricity produced by CHP that is used to produce cold and store it, at hour t [kWh]
ElectricityCHPLC (t) Electricity produced by CHP and used to supply Cooling loads, at hour t [kWh]
ElectricityCHPLE (t)
Electricity produced by CHP and used to supply Electric loads, at hour t [kWh]
EnergyCHP(t)
Total energy produced by CHP, at hour t [kWh] NOTE: including Electricity and Heat
HeatingBoiler(t) Heating produced by a boiler, at hour t [kWh]
HeatingCHP(t)
Heating produced by CHP, at hour t [kWh]
NOTE: This is useful heat. Non-useful heat is the one that is produced and not consumed
HeatCHPCS (t)
Heat produced by CHP that is used to produce cold and store it, at hour t [kWh]
HeatCHPLC (t) Heat produced by CHP and used to supply Cooling loads, at hour t [kWh]
Page 37 of 37 HeatCHPLH (t)
Heat produced by CHP and used to supply Heating loads, at hour t [kWh]
𝐻𝑡𝐸 Heat to Electricity rate: Units of heat produced by the CHP for each unit of electricity produced [kWH / kWe-]
Ln(t) Energy load of n carrier, at hour t [kWh], where n={E,H,C}
n Type of energy carrier, where n={ E:Electricity , H:Heating , C:Cooling }
rn Dominance load rate of the n carrier [-], where n={E,H,C}
Yn
Annual size of energy load for the n carrier [GWh/y], where
n={E,H,C} Subscripts
E Electricity
H Heating