Université de Montréal
Odd-Even Effects in Electroactive Self-Assembled
Monolayers
par Yanqi Feng
Département de chimie, Université de Montréal Faculté des arts et des sciences
Mémoire présentéà la Faculté des études supérieures et postdoctorales en vue de l’obtention du grade de maîtrise (M.Sc.)
en chimie
Octobre, 2017
i
Abstract
Odd-even effect in the redox-induced molecular reorientations that occur in electroactive molecular films were investigated using surface plasmon resonance (SPR) coupled with cyclic voltammetry. Experiments were conducted on self-assembled monolayers (SAMs) of ferrocenylalkanethiolates on gold (FcCnSAu) with n = 6-16. SPR was used to follow in situ and real time the electrochemical oxidation and reduction of the FcCnSAu SAMs. An increase in the resonance angle was observed upon the oxidation of the SAM-bound ferrocene to ferrocenium due to an untilting of the Fc+CnS molecules which resulted in a film
thickening of ~0.2 nm. An odd-even variation of the resonance angle shift was observed, which originated from a difference in the dielectric constants of FcCnSAu SAMs with an odd (SAModd) versus even (SAMeven) number of methylenes.
Cyclic voltammetry (CV) was used to characterize the oxidation of the ferrocene group in the presence of sodium perchlorate, and to investigate odd-even effects in the electron transfer and ion pairing reactions. The peak splitting observed in CV was attributed to different packing structures of the SAM related to the polycrystalline nature of the thermally evaporated, gold thin films and annealed gold beads used as the substrates. The apparent redox potential of SAMeven is higher than that of SAModd, which implies that it is harder to oxidize
the surface-tethered ferrocenes for even chain lengths. This corroborates theoretical predictions that the van der Waals interactions between the even FcCnS chains, and therefore the SAMeven packing energy, are more favorable.
This work supports a general understanding of the structure-property relationships in ferrocene-terminated SAMs to guide their use as charge transport and storage elements in electronic and electrochemical devices.
Keywords: Self-assembled monolayers, ferrocenylalkanethiolates, electrochemistry, surface
ii
Résumé
L’effet de longueur de chaîne paire-impaire sur la réorientation des molécules induites par les réactions rédox dans un film moléculaire électroactif est investigué en utilisant la spectroscopie de résonnance des plasmons de surface (SPR) couplée à la voltampérométrie cyclique. Les expériences ont été réalisées sur des monocouches auto-assemblées (SAMs) de ferrocénylalcanethiolates sur l’or (FcCnSAu) avec n = 6-16. La SPR est utilisée pour suivre in situ et en temps réel les réactions rédox des SAMs de FcCnSAu. Une augmentation de l’angle de résonance est observée lors de l’oxidation du ferrocène de la SAM en ferrocénium. Ceci est dû au redressement des molécules de Fc+CnS qui cause une augmentation de 0.2 nm de
l’épaisseur de la SAM. Une variation pair-impair du déplacement de l’angle de résonnance est observée, et est due à la différence entre les constantes diélectriques des SAMs de FcCnSAu ayant un nombre impair de méthylènes (SAModd) et les SAMs de FcCnSAu ayant un nombre
pair de méthylènes (SAMeven).
La voltampérométrie cyclique (VC) a été utilisée pour caractériser l’oxydation du groupement terminal ferrocène en présence de perchlorates de sodium, ainsi que pour investiguer les effets pair-impair sur les réactions de transfert électronique et de pairage ionique. Le dédoublement de pic observé dans les VCs est attribué aux différentes structures de paquetage dans la SAM dues à la nature polycristalline du substrat d’or: films minces thermo-évaporés et billes recuites. Le potentiel rédox apparent des SAMpair est plus élevé que
celui des SAMimpair, ce qui implique qu’il est plus difficile d’oxyder les ferrocènes attachés à la
surface pour les chaînes paires. Ce résultat corrobore les prédictions théoriques qui stipulent que les interactions de van der Waals entre les chaînes FcCnS paires sont plus favorables, et donc que l’énergie de paquetage des SAMpair est plus grande.
Ce travail vise une meilleure compréhension de la relation entre la structure et les propriétés des SAMs ayant un groupement terminal ferrocène, afin de guider leur utilisation en tant qu’éléments de transport de charges et de stockage dans les dispositifs électroniques et électrochimiques.
iii
Mots-clés : Monocouches auto-assemblées, ferrocénylalcanethiolates, électrochimie,
iv
Table of Contents
Abstract ... i Résumé ... ii Table of Contents ... iv List of Tables ... viList of Figures ... vii
List of Frequently Used Symbols ... xii
List of Frequently Used Abbreviations ... xiii
Acknowledgements ... xiv
Chapter 1. INTRODUCTION ... 1
1.1 Motivation and Objectives ... 1
1.2 Self-Assembled Monolayers (SAMs) ... 3
1.3 Electroactive Ferrocenylalkanethiolate SAMs ... 12
1.4 Odd-Even Effects in SAMs ... 17
1.5 SAM Characterization ... 29
1.5.1 Surface Plasmon Resonance (SPR) ... 29
1.5.2 Cyclic Voltammetry (CV)... 36
1.5.3 Electrochemical Impedance Spectroscopy (EIS) ... 40
Reference ... 44
Chapter 2. Experimental Section ... 54
2.1 Materials ... 54
2.2 Choice of FcCnSH Chain Lengths and Gold Substrates ... 54
... 55
2.3 Preparation of FcCnSAu SAMs ... 56
2.4 Electrochemical Surface Plasmon Resonance (EC-SPR) ... 58
2.5 Electrochemical Impedance Spectroscopy (EIS) ... 60
Reference ... 61
v
3.1 Electrode Surface Characterization... 61
3.2 FcCnSAu SAM Electrochemistry ... 63
3.2.1 Cyclic Voltammetry ... 63
3.2.2 Peak Deconvolutions ... 66
3.3 Redox-Induced Resonance Angle Change... 72
3.4 EIS of the FcCnSAu SAMs ... 74
3.5 SAM Thickness Change ... 79
Reference ... 80
Chapter 4. Discussion ... 83
4.1 Surface Microstructure... 83
4.2 Film Structure Insights via Cyclic Voltammetry ... 85
4.3 Odd-Even Effects in the Electrochemical Parameters ... 88
4.4 Chain Length Dependence of the Oxidation-Induced Thickness Change ... 91
4.5 Dielectric Properties of the FcCnSAu SAMs ... 94
Reference ... 96
Chapter 5. Summary and Conclusions ... 102
Reference ... 104
vi
List of Tables
Table 2.1. Fresnel Layer Model Used to Determine the Oxidation-Induced Change in the
vii
List of Figures
Figure 1.1. Schematic illustration of an -functionalized alkylthiolate SAM on gold. ... 1 Figure 1.2. Illustration of the preparation of RSAu SAM modified Au surfaces. ... 4 Figure 1.3. Scheme of the film formation process. ... 6 Figure 1.4. Optical photograph demonstrating a gradient in hydrophilicity, as measured by the
spreading of water drops on a CH3(CH2)11SAu SAM. ... 6 Figure 1.5. Schematic depiction of some intrinsic and extrinsic defects found in SAMs formed
on a polycrystalline metal substrate. ... 7
Figure 1.6. An STM image of CH3(CH2)11S SAM chemisorbed on Au (111) from ref 32.. ... 8 Figure 1.7. (A) A schematic representation of an alkanethiols SAM (large shaded circles) on
an Au (111) surface (small open circles) where the SAM forms (√3×√3)R30° lattice. (B) Alkanethiolates SAM forms a c(4×2) superlattice structure with a rectangular unit cell composed of four distinct molecules on the Au (111) surface. (C) Commensurate c(2×2) overlayer structure of sulfurs bonded to the rectangular hollow sites of the Au (110) surfaces. ... 10
Figure 1.8. CVs of Fc(CH2)4COO(CH2)9SAu SAMs recorded in the presence of different
electrolyte anions in aqueous solution. Electrolyte concentration is 0.1 M. Potential scan rate is 100 mV/s. T = 25 °C. ... 14
Figure 1.9. Schematic illustration of the structure of ferrocenylalkanethiol. ... 15 Figure 1.10. Illustration of the FcC12S/Fc+C12SAu reorientation induced by the redox reaction.
The anion is not shown. ... 16
Figure 1.11. Melting points of ferrocenylalkanethiols (bulk or 3D material)... 18 Figure 1.12. Schematic illustration of ω-functionalized alkanethiolates (S(CH2)nCH2X)
chemisorbed onto a metallic surface. ... 19
Figure 1.13. Friction images of CH3(CH2)nS monolayers patterned on smooth gold at a
contact load of ~25 nN by microcontact printing (P), followed by solution deposition (SD): (A) n15(P), n16(SD); (B) n16(P), n15(SD); (C) n14(P), n15(SD); (D) n15(P), n14(SD);
viii
(E) n13(P), n14(SD) and (F) n14(P), n13(SD). The brighter contrast corresponds to higher friction. ... 20
Figure 1.14. (A) Idealized structure of n-alkanethiolates on gold substrate. (B) Plots of friction
force (f) vs. the contact load (FN) for n-alkanethiolates monolayers chemisorbed on gold. The inset plots represents the f and the absorbance of the s(CH3) obtained from infrared reflection spectroscopy in function of n. ... 21
Figure 1.15. Contact angle measurement: contact angle (θ).. ... 22 Figure 1.16. Surface roughness and contact angles observed on Au surfaces. AFM images of
the AuTS substrate: (A) two-dimensional (2D) view. (B) tilted three-dimensional (3D) view of
a 3 × 3 m surface. (C) Surface roughness and polycrystallinity were confirmed by SEM. (D) Static contact angles measured by a drop of water on n-alkanethiolate SAMs formed on AuTS
substrate. (E-H) Similar images for the AuAD (“as-deposited”) surface. ... 23 Figure 1.17. (A) Schematic illustration of junctions of AgTS-SCnFc//Ga
2O3/EGaIn; (B) Values
of the rectification ratio R as a function of the alkyl chain length n. ... 25
Figure 1.18. (A) Schematic illustration of the odd-even difference in the orientation of the
terminal ferrocene unit suggested by NEXAFS and MD simulations in FcCnSAu SAMs of neven and nodd for an ideal all-trans extended conformation of the alkyl chains. (B) Tilt angle ()
of the linear backbone of the alkyl chain away from the surface normal as a function of the number of methylenes (n), is estimated by molecular dynamics. (C) The ferrocene tilt angles (NEXAFS) as a function of n are derived from the angular dependence of the NEXAFS spectra.
(D) The ferrocene tilt angles (MD) calculated by MD simulations. (B), (C) and (D) are from
ref 6. ... 26
Figure 1.19. Characteristics of junctions with SAMs of SCnFc on Au and Ag as a function of n. (A) Tunneling current, |J| of the junctions at +1.0 V, (B) Rectification ratio, R and (C) Calculated SAM packing energy. ... 27
Figure 1.20. Schematic illustration of the electromagnetic field with surface plasmons
traveling along a metal/dielectric interface.. ... 29
Figure 1.21. Schematic illustration of the Kretschmann attenuated total reflectance (ATR)
geometry for the excitation of surface plasmons from ref 92. ... 32
ix
Figure 1.23 Illustration of the electrochemical surface plasmon resonance (EC-SPR) setup
used for the investigations of the FcCnSAu SAMs. ... 35
Figure 1.24. (A) Surface plasmon resonance angle shifts to higher value when Fc is oxidized
into Fc+ due to an oxidation-induced structural rearrangement of the SAM. (B) Current density
j and resonance angle change min for five consecutive voltammetric cycles of a FcC16SAu
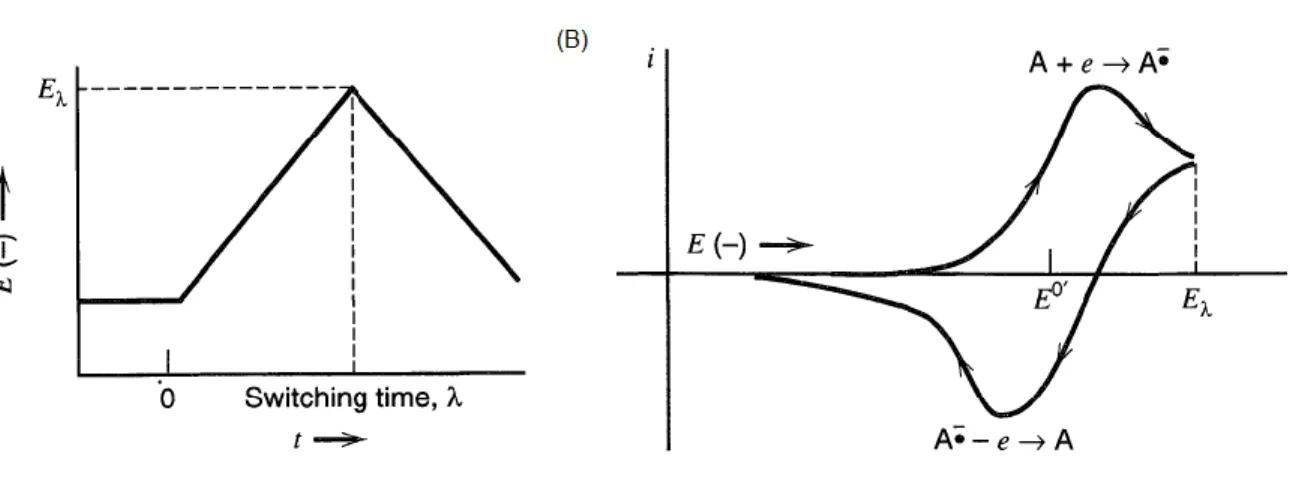
SAM in 0.1 M NaClO4(aq) are shown. ... 35 Figure 1.25. (A) Cyclic potential sweep. (B) Typical reversible cyclic voltammogram for a
soluble redox species at a bare electrode surface. ... 36
Figure 1.26. Characteristics of a cyclic voltammogram of a redox-active component adsorbed
to an electrode surface. ... 38
Figure 1.27. Characteristics of a cyclic voltammogram of a redox-active component adsorbed
on an electrode surface. (A) A peak-broadening CV scan of FcC6SAu SAM in perchlorate
solution. (B) A CV of a single component FcC12SAu SAM with peak splitting. CVs in (A) and
(B) were scanned at 10 mV s-1. ... 39 Figure 1.28. (A) Phasor diagram for alternating current and voltage signals at frequency ω. (B)
(C) An impedance response displayed on Bode plots for a series circuit with R = 100 Ω and C = 1 F. ... 41
Figure 2.1. AFM height images of (A) thermally-evaporated gold on B270 glass used for
ESPR, (B) annealed gold bead electrode used for EIS, (C) FcC8SAu SAM, and (D) FcC14SAu
SAM. Image sizes are (A), (B) 1 m 1 m and (C), (D) 0.5 m 0.5 m. ... 55
Figure 3.1. Cyclic voltammograms (current density j, right-hand axis) and corresponding
resonance angle changes (min, left-hand axis) recorded by ESPR for FcCnSAu SAMs in 0.1
M NaClO4(aq) (pH = 5.0). Only data from the second of five consecutive oxidation-reduction
cycles is shown for clarity. Scan rate of 10 mV s-1. ... 63 Figure 3.2. Electrochemical data for FcCnSAu SAMs formed on gold thin film substrates. (A) Anodic and cathodic peak potentials Epa and Epc, (B) apparent formal redox potential Eoˊ
, (C) anodic-cathodic peak separation ∆Ep, and (D) ferrocene surface coverage ΓFc as a function of
the number of methylenes n in the alkyl chain. Values for peak 2 are not given for n = 6 and 7 in (A)–(C) because their positions are not discernable by eye. Data points and error bars represent the mean and standard deviation of N different FcCnSAu SAMs: (A)–(C) N = 7–23
x
and (D) N = 10–15. The dotted lines are guides to the eye. The black open circles in (D) are the ΓFc values reported in ref 8 for FcCnSAu SAMs formed on ultraflat, template-stripped gold
films. ... 65
Figure 3.3. Examples of the anodic peak deconvolution. Blue curves are the individual
Gaussian and Lorentzian peaks and red curves are the cumulative fits. The green curves are the fitting residuals. The anodic peaks were baseline corrected with Boltzmann function before mathematical deconvolution. Functions used for the peak deconvolutions: FcC6SAu
Gaussian-Gaussian, FcC9SAu Gaussian-Gaussian, FcC12SAu Gaussian-Lorentzian, and FcC15SAu
Gaussian-Lorentzian. ... 67
Figure 3.4. Anodic peak deconvolution results. (A) Peak potential Epa, (B) percent area peak
area, (C) ferrocene surface coverage Fc, and (D) full width at half maximum Efwhm of the
individual peaks as a function of n. N = 10 different voltammetric sweeps were deconvoluted for each n. The data points and error bars represent the mean and standard deviation. The dotted lines are guides to the eye. ... 68
Figure 3.5. Interaction parameter 𝜈𝐺𝜃T as a function of the alkyl chain length n. ... 71 Figure 3.6. Resonance angle change recorded at the most anodic potential ∆Θminox versus
the number of methylenes n in the alkyl chain of the FcCnSAu SAMs. Each data point is the mean of N = 10–19 different FcCnSAu SAMs. Error bars represent the standard deviations (grey) and 95% confidence intervals (black) of the mean ∆Θminox values. The dotted line is a guide to the eye. ... 73
Figure 3.7. Electrochemical impedance spectroscopy (EIS) data for selected chain lengths. (A)
Bode plot – impedance magnitude |Z| vs. frequency. (B) Complex plane plot – imaginary part of the impedance Z˝ vs. the real part Z′. (C) Bode phase plot – phase angle vs. frequency. Impedance spectra were acquired at 0.0 V versus Ag/AgCl in 0.1 M NaClO4(aq) (pH = 5.0).
Symbols are the experimental data and solid lines are the result of CNLS fits to the data using the equivalent circuit model shown in inset in (A) which consists of a solution resistance Rs in
series with a constant phase element CPE. ... 76
Figure 3.8. (A) Plot of the reciprocal of the FcCnSAu SAM capacitance CSAM-1 as a function
of n. The solid line represents the linear regression analysis to all of the data. Error bars represent the standard deviations of the mean values of N = 10–16 independent measurements
xi
per n. Inset shows the difference CSAM-1 between CSAM-1 obtained experimentally and CSAM-1
calculated based on the regression line. (B) Dielectric constant ϵSAM calculated from the SAM
capacitance using equation 31 and the computed SAM thicknesses reported in ref 6. The thickness of the n = 16 SAM was extrapolated from the reported values. Error bars represent the standard deviations (grey) and 95% confidence intervals (black) of the mean values. Dashed lines are guides to the eye. ... 78
Figure 3.9. Oxidation-induced FcCnSAu SAM thickness change dox calculated using the
mean values of ϵSAMdetermined by EIS and ∆Θminox determined by ESPR. Dashed lines
xii
List of Frequently Used Symbols
Å angstrom (10-10 m)
A electrode area, in cm2
Ci capacitance
Γ surface coverage
E p anodic-cathodic peak separation
min resonance angle shift in SPR
Ea anodic peak potential
E°’ apparent redox potential
Ec cathodic peak potential
ΔEFWHM full width at half maximum
F Faraday constant, 96 485.3 C mol-1
i Faradic current
Q charge
xiii
List of Frequently Used Abbreviations
AFM atomic force microscopy
Fc ferrocene
Fc+ ferrocenium ion
FcCnSAu ferrocenylalkanethiolate SAM on gold, n represents the alkyl chain length or number of methylene units
CV cyclic voltammetry
DSC differential scanning calorimetry
EC-SPR electrochemical surface plasmon resonance
RSH n-alkylthiol
RSSR alkyldisulfide
SPR surface plasmon resonance
SAM self-assembled monolayer
xiv
Acknowledgements
First and foremost, I would like to express my sincere gratitude to my supervisor, Professor Antonella Badia, for her continuous support throughout my degree. She was always there whenever I encountered problems in my research or experienced dilemmas in planning for the future. Her passion and knowledge encouraged me throughout my research. Her patience and advice calmed me and helped me rationally plan for the future. I feel grateful to have been a member of her group.
In addition to my supervisor, I have benefited greatly from the helpful comments, suggestions, and endless encouragement of my lab colleagues during the entire process. I would like to especially thank my coworkers Tania Sultana for her instructions on SPR experiments and Dr. Eric Dionne for his help with various instruments. I would like to thank Dr. Olga Borozenko and Fadwa Ben Amara for their homemade cakes, which provided me with some enjoyable breaks from work. Thank you Dr. Ngoc Duc Trinh for the many discussions that helped make my work exciting. Your knowledge and suggestions greatly assisted my PhD application process.
I would also like to thank Dr. Violeta Toader in Mcgill for her help with the synthesis of ferrocenylalkanethiolates applied in our experiments.
A special thanks is directed to Patricia Moraille (LCM) for her continuous assistance in collecting AFM images and for helpful discussions. I would also like to thank Jacqueline Sanchez (LCM and RQMP) for her humor and positive attitude which benefited me greatly.
Finally, I would like to thank my parents. Without their selfless moral and economic support, I would never have had the chance to pursue my dream in Canada and meet all of the wonderful people mentioned above. I would also like to thank Zhirou Mao. His presence and encouragement greatly supported my current academic accomplishments.
1
Chapter 1. INTRODUCTION
1.1 Motivation and Objectives
Molecular self-assembly, as one of the most popular approaches for the modification and functionalization of solid surfaces, has attracted intense interest over the past three decades.1 Self-assembled monolayers (SAMs) are formed by the spontaneous adsorption of
organic molecules on the surfaces of noble metals or semiconductors such as silicon. The intrinsic chemical stability of SAMs, particularly ω-functionalized alkanethiolates on metal surfaces, provide possibilities for fabricating well-defined, flexible, and simple organic interfaces with significant control over their physicochemical properties, such as wetting and lubrication,2 chemical or biochemical reactivity3 or electrochemistry.4
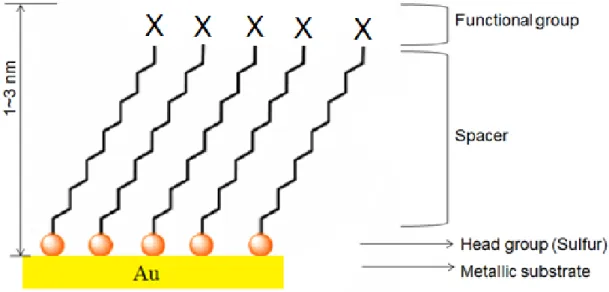
Tailored SAM surfaces are generally produced by attaching an appropriate functional group (X) at the chain end (e.g., X = -CH3, -OH, -COOH, redox couple or a biological
receptor) to achieve the desired surface property (Figure 1.1).
2
Studies have shown that subtle conformational-based distinctions in the supramolecular structure of SAMs of ω-functionalized alkanethiolates on metal surfaces can have a significant impact on their interfacial and film properties.1 The work presented in this
thesis was specifically motivated by recent investigations of molecular tunneling junctions comprised of SAMs of ω-ferrocenylalkanethiolates on gold (FcCnSAu) or silver (FcCnSAg) which show that the relatively small difference of 5° in the tilt angles adopted by the ferrocenes in SAMs of odd versus even-numbered alkyl chains lead to dramatic variances in the electron transport properties and performance of the SAM-based devices.5 Junctions of
FcCnSAg SAMs with nodd rectify current 10 times more effectively, give a 10% higher yield of
working devices, and can be fabricated 2-3 times more reproducibly than neven.6
These previous studies focused on electrical measurements on metal (EGaIn)-FcCnS-metal (Au or Ag) junctions (EGaIn: Eutectic Gallium Indium) in the solid-state (no solvent) and the characterization of the electronic properties of FcCnSAu or FcCnSAg SAMs under vacuum.6 However, FcCnS-based SAMs have traditionally been investigated and used in
electrolyte solution where both electron transfer and ion pairing reactions are operative. Furthermore, most of the information with regards to the odd-even distinctions in the FcCnS SAM packing structure was derived from molecular dynamics simulation (theory). The degree of conformational order in these SAMs and the effect of the redox reaction on the SAM structure remain to be established.
The objectives of the project are to investigate odd-even effects in the (i) Faradaic electrochemistry of FcCnSAu SAMs, (ii) redox-induced molecular reorientations that occur in these electroactive SAMs using surface plasmon resonance coupled with cyclic voltammetry and (iii) dielectric properties of the SAMs in the reduced/neutral state.
This introduction chapter is divided into five sections: i) the motivation and objectives of the work, ii) a general introduction to SAMs, including the common preparation protocol and SAM structure, especially ferrocenylalkanethiolate SAMs, iii) the electrochemical characterization of electroactive SAMs and parameters used to define their redox properties, iv) a brief review of the odd-even effects in SAMs, and more specifically odd-even effects in the electric properties of FcCnS-based junctions, and v) the principle of surface plasmon resonance and its application to the investigation of ultrathin films.
3
1.2 Self-Assembled Monolayers (SAMs)
The fabrication and characterization of thin film organic surfaces is the focus of intensive research since the interfacial properties may provide insight into fundamental aspects of surface chemistry.1 The interesting topics include film adhesion, wetting/dewetting
phenomena, corrosion, catalysis, bio-chemical reactivity and electron transfer. The spontaneous adsorption of molecular constituents on a solid surface or compression-induced organization of amphiphilic molecules at the air/water interface provides a rational methodology for the preparation of structurally well-defined, organic thin film (Langmuir monolayers). Adsorbates, on self-assembled monolayer (SAM), can be transferred from the solution or gas phase and self-organize into crystalline (or semi-crystalline) structures immediately after adsorption.1 The self-assembly process is primarily driven by
molecule-substrate interactions and intermolecular forces. This concept was first introduced by Zisman and coworkers in 1946 who demonstrated the preparation of SAMs through the adsorption of a surfactant on a platinum substrate.7 Other SAM systems have since been developed, for
example, alcohols on silicon and iron oxides, acid-functionalized alkanes on metal oxides (i.e., α-Al2O3, FexOy, Ti/TiO2) and organosulfurs on noble metals and metallic compounds (i.e., Ag,
Cu, Au, FePt, AgS).8
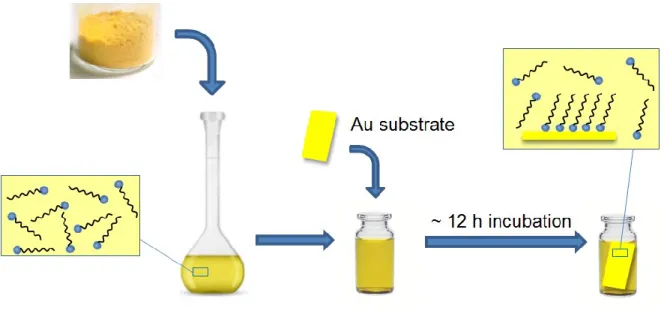
The molecular structure of the SAM can be briefly divided into three distinct parts (Figure 1.1): a functional headgroup that has a specific affinity for the solid substrate; a spacer group, usually an alkyl chain that defines the 2D organization and conformational order, and a terminal group that defines the monolayer function properties. The most common protocol for RSAu SAM preparation (Figure 1.2) involves the immersion of clean metal-coated substrates into a dilute solution of the thiol in a polar solvent such as EtOH (~1-10 mM RSH concentration) for several hours to overnight incubation at room temperature. The substrates are then rinsed copiously with solvent to remove physisorbed material. Finally, the substrates are dried with nitrogen. This method is largely adopted for the preparation of SAMs due to its reproducibility, cost effectiveness, and convenience.
4
Figure 1.2. Illustration of the preparation of RSAu SAM modified Au surfaces.
The great majority of studies of SAMs are derived from the chemisorption of alkanethiols (RSHs) or alkyldisulfides (RSSRs) on metals such as gold, silver, copper, palladium, platinum and mercury.1 Among the metals, gold has been regarded as a standard
substrate in the study of SAMs for two reasons: (i) it forms good SAMs and (ii) it is reasonably inert in ambient air. The adsorption of n-alkanethiols exhibits hydrophobic surfaces with the lowest free energy (19 mJ/m2) compared to any other hydrocarbon surface studied to
date.9
Although there is currently no direct supporting evidence, the adsorption of organosulfur compounds is supposed to proceed via oxidative addition between the S-H or S-S and Au which results in a surface gold-thiolate species.8
R − SH + Au𝑛𝑜 − 1 2H2? → R − S𝛿−Au 𝑛 δ+ ∙ Au 𝑛−1 o RS − SR + Au𝑛𝑜 → 2(R − S𝛿−Au𝑛δ + ) ∙ Au𝑛−2o (1)
Infrared10-13 and Raman spectra14-15 indicate the rupture of the S-H and S-S chemical
5
thiols have a strong affinity for gold and form a largely covalent, but with partial ionic character, Au-S bond of bond energy of ca. 165-210 kJ/mol.16-17 Additionally, X-ray
photoelectron spectroscopy (XPS) measurements confirm the partial ionic character of the Au-S bond.9,13, 18-19 The sulfur has a partial negative charge of 0.2 e. 20
The mutual effects from the gold-sulfur chemical electrostatic bond and non-covalent lateral interactions (e.g. van der Waals interactions) among the alkyl chains determine the kinetics and thermodynamics of SAM formation.21-22 The kinetics of SAM formation is
relatively complicated with the involvement of solvent molecules, but the process approximately follows the Langmuir adsorption model in which the rate of deposition is proportional to the available free space.1, 23 Bain and coworkers initially verified this model
by measuring the ellipsometric thickness and contact angles of the SAMs at different incubation times.9, 24-26 The results indicated that the film formation process can be divided
into two steps: (i) a quick and dense coverage of the adsorbates is observed during the first milliseconds to minutes (~ 80-90%);9 followed by (ii) a slow reorganization process on the
order of hours to maximize the structural order and minimize the defects in the system. This explains why overnight incubation is frequently employed to prepare SAMs (Figure 1.3).1 The
final result is a well-ordered, densely-packed surface monolayer with optimal configuration. In practice, there are also a number of experimental conditions that affect the rate of deposition and the resulting SAM structure such as temperature,27 nature of the solvent,28 thiol
concentration,9, 29 thiol purity, oxygen content of the solution (usually a problem for easily
oxidized metals only),18, 30 and cleanliness of the substrate surface. Proper experimental
6
Figure 1.3. Scheme of the film formation process.
Studies by Nicholas et al. further support this model. They generated a hydrophobicity gradient film by forming regions/areas of different surface coverage of alkanethiolates along the immersion axis of the gold-coated silicon substrate by increasing the immersion time from bottom to top (Figure 1.4).31
Figure 1.4. Optical photograph demonstrating a gradient in hydrophilicity, as measured by the
spreading of water drops on a CH3(CH2)11SAu SAM. Reprinted from ref 31. Copyright 2003
American Chemical Society.
The thermodynamic nature of the self-assembly process is such that the SAMs formed are embedded with both intrinsic and extrinsic types of defects as illustrated in Figure 1.5.1
These originate from external factors such as the substrate preparation method (i.e. surface immersion axis
7
roughness and crystallographic microstructure), cleanliness of the substrate, and purity of the immersion solution, while some intrinsic defects result simply from the SAMs dynamic systems with complex phase behaviors (i.e. the defects at the SAM crystal edges in Figure 1.5). In order to obtain reproducible SAMs, several factors should be taken into consideration such as the choice of substrate and incubation time.
Figure 1.5. Schematic depiction of some intrinsic and extrinsic defects found in SAMs formed
on a polycrystalline metal substrate. Reprinted from ref 1. Copyright 2005, American Chemical Society.
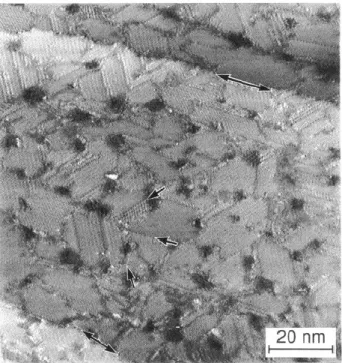
Scanning tunneling microscopy (STM) is one of the methods used to visualize SAM defects. Figure 1.6 is an STM image of a dodecanethiolate SAM (CH3(CH2)11S) on Au (111)
prepared by thermal annealing to increase the average domain area.32 The surface exhibits
terraces separated by two Au steps (double arrows), statistically distributed depressions (defects) surrounded by several domains and interconnected by domain boundaries as well as various superstructures within individual domains.
8
Figure 1.6. An STM image of CH3(CH2)11S SAM chemisorbed on Au (111) from ref 32.
Copyright 1994 American Chemical Society.
The SAM packing density and intermolecular separation depends on the underlying metal lattice. The SˑˑS spacing and alkyl chain packing density in RS-Au SAMs are largely decided by the structure of the underlying metal lattice. He diffraction,33-34 electron
diffraction35 and grazing incidence X-ray diffraction36 studies of alkanethiolates on Au (111)
surfaces demonstrate that alkyl chains form commensurate hexagonal arrays with an average SˑˑS spacing of 4.99 Å between alkanethiols chains. The area occupied by each alkyl chain within this structure is 21.7 Å2/molecule. Since the spacing between adjacent sulfurs in
alkanethiolates SAMs is greater than the distance with the closest packing arrangement of the alkyl chains (4.24 Å), the chains are typically tilted at an angle ~ 30° from the surface normal to maximize the overall van der Waals interactions. The ellipsometric measurements also confirm that the alkyl chains rotate around the axis chain by an angle (twist angle) of around 52° on surface of Au (111) crystals. The alkyl chains are in the all trans configuration with very few gauche defects. STM studies reveal that sulfurs are bonded to the Au triple hollow sites (Figure 1.7).24, 26, 37-42 More specifically, STM studies reveal that the sulfur atoms are
9
bonded to the Au (111) surface crystallographic structure, in which the alkanethiolate forms a ( √3 × √3 )R30° hexagonal lattice.21, 23, 43-44 and a secondary ordering of the chains
corresponding to a c(4×2) superlattice is also observed by grazing-angle X-ray diffraction in ultrahigh vacuum (Figure 1.7B).45-46 By comparison, the SˑˑS spacing of alkanethiolates
adsorbed on a Au (110) surface is 5.76 Å, with the sulfur atoms bonded to the rectangular hollow sites of the Au (110) surface in a commensurate c(2×2) adlayer lattice structure (Figure 1.7C).47-48 The alkyl chains tilt ~40° from the surface normal which results in a surface
packing of the chains ~ 8% less dense than the SAM formed on the Au (111) surfaces.
10
Figure 1.7. (A) A schematic representation of an alkanethiols SAM (large shaded circles) on
an Au (111) surface (small open circles) where the SAM forms (√3×√3)R30° lattice. (B) Alkanethiolates SAM forms a c(4×2) superlattice structure with a rectangular unit cell composed of four distinct molecules on the Au (111) surface. (C) Commensurate c(2×2) overlayer structure of sulfurs bonded to the rectangular hollow sites of the Au (110) surfaces.
The structure of SAMs of alkanethiolates (CH3(CH2)nS) on gold has been extensively
characterized. Ellipsometric measurements of the monolayer thickness as a function of the chain length suggests two distinct regions: a non-linear region between n = 1 and n = 9, and a linear region between n = 9 and n = 21.12 A comparison between the measured thickness and
thicknesses calculated assuming a fully extended all-trans conformation for alkyl chains which are tilted 20-30° from the surface normal reveals a close agreement only for the chain lengths n = 10-21.12 The peak frequencies and peak widths of the methylene stretching modes in
infrared spectroscopy are sensitive markers for the extent of the lateral interactions between the polymethylene chains.49-50 For example, crystalline polymethylene exhibits
a(CH2) and
s(CH2) at 2920 cm-1 and 2850 cm-1. The peak positions shift to 2928 cm-1 and 2856 cm-1 in
the liquid phase. A similar trend is observed for bulk n-alkanethiols, where a(CH2) shifts
from 2918 cm-1 to 2924 cm-1 and
s(CH2) shifts from 2851 cm-1 to 2855 cm-1 from the
crystalline to liquid state.12 A comparison of the
a(CH2) peak frequencies measured for
11
reveals a definite trend toward higher peak frequencies as the alkyl chain length decreases. More specifically, the peak positions (~2918 cm-1) of chain lengths n = 15-21 indicate that the
monolayer is in a high density, crystalline-like state, whereas the average local environment of the assemblies with n ≤ 7 is akin to that of the liquid or disordered state. A similar, but less pronounced trend is also observed for the s(CH2) mode. Low energy helium diffraction
experiments show an abrupt decrease in the diffraction peak intensities for CH3(CH2)9SAu and
no diffraction is seen for CH3(CH2)5SAu monolayer, as the carbon chain length is shortened.51
Altogether, these results indicate a sudden decrease in the SAM order at chain lengths of n ˂ 10, which correlates with the finding of the IRRAS investigation.
12
1.3 Electroactive Ferrocenylalkanethiolate SAMs
Charge transfer from one site to another over nanometer-scale distances is fundamental to important redox processes in biology,52 and to the development of a wide range of devices,
such as transistors and diodes.53 Electron transfer in biology is often achieved by the
immobilization of biologically-active molecules on organic matter. For instance, the electrochemical oxidation of self-assembled monolayers with hydroquinone terminal groups can be used for the selective immobilization of proteins via Diels-Alder reaction.54
Electroactive SAMs therefore provide an attractive method for bio-immobilization and the preparation of a range of tailored substrates presenting peptides, carbohydrates, and other low-molecular weight ligands, for studies in cell biology and biotechnology.55
Electroactive SAMs (i.e. SAMs bearing a redox terminal group) can also be used in organic/molecular electronics. Two-terminal metal-molecule-metal junctions consist of molecules sandwiched between two metal contacts, in which at least one of the contacts is coated with an electroactive SAM.1 Common configurations employed in electrochemistry to
study the kinetics of electron transfer across SAM-modified electrodes include: (i) thick, hydrophobic SAMs to block a redox species from diffusing to the electrode12 and (ii) mixed
SAMs with at least one molecular component comprised of an electroactive terminal group to minimize diffusion effects.56-58 Chemical modification of an electrode with redox-tagged
alkanethiols makes it possible to immobilize electroactive species on the electrode itself while generating a dielectric barrier layer that prevents the free diffusion of electroactive species or ions to the electrode surface.59
The present work focuses on electroactive SAMs, where the oxidation state and charge of the electroactive end groups can be changed by applying a voltage or potential to the SAM-moditified electrode. The original motivation for immobilizing redox-active molecules on metal surfaces was to investigate interfacial electron transfer phenomena.60-61 The strength of
the metal-sulfur bond (i.e., 210 kJ/mol for Au-S)21 and stabilizing chain-chain interactions in
SAMs allows them to retain their structural integrity within a window of applied electrode potentials (-0.5 V—0.85 V vs. Ag/AgCl) and makes electrochemical measurements possible, especially in aqueous electrolytes. The SAM is an electrical, precisely switchable system in
13
which the redox state of the end groups can be controlled by the amplitude of the applied potential. These two distinct advantages motivate the study of electron transfer processes across metal-SAM interfaces. Due to the attractive electrochemical properties of ferrocene (facile electron transfer, low oxidation potential, and two stable redox states), ferrocene-terminated SAMs are among the most investigated electroactive SAM systems.56-57, 62-63
The ferrocene/ferrocenium couple exhibits a straightforward reversible single-electron redox reaction. The surface-confined oxidation proceeds via coupled single electron-transfer and ion-pairing reactions:62, 64-66
Fc ⇌ Fc++ 𝑒−
Fc++ X− ⇌ Fc+X− (2)
The formation constant K of the Fc+X- pair is expressed as:
𝐾 = ΓFc+X−/ΓFc+𝑎
X− (3)
where ΓFc+ and ΓFc+X- are the surface concentrations of ferrocenium and anion-paired
14
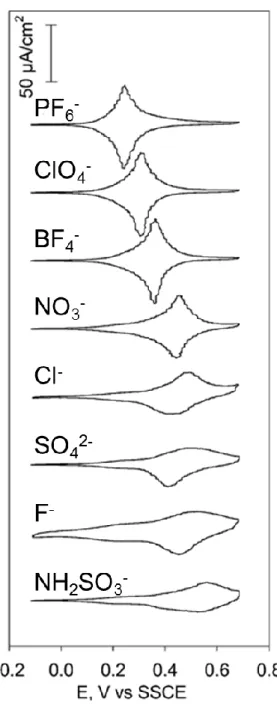
Figure 1.8. CVs of Fc(CH2)4COO(CH2)9SAu SAMs recorded in the presence of different
electrolyte anions in aqueous solution. Electrolyte concentration is 0.1 M. Potential scan rate is 100 mV/s. T = 25 °C. Reprinted from ref 62. Copyright 2004, American Chemical Society.
Ion-pairing between the anion and ferrocenium neutralizes the excess positive charge created at the SAM/electrolyte solution interface.62, 64-65, 67 It should be noted that the
ion-15
pairing interactions are not driven simply by an electrostatic force. Certain anions (X-) exhibit
better capacity to pair with the ferrocenium (greater K) to stabilize the oxidized form of the SAM. More “hydrophobic” (less hydrated) anions ion pair more effectively than “hydrophilic” ones.62, 64-65, 68-70 The ion-pairing ability is PF
6- > ClO4- > BF4- > NO3- > F-.62 The ability of the
anion to pair with the ferrocenium in the typically nonpolar and sterically crowded environment of the SAM determines the electrochemical response of the ferrocene-terminated SAM in terms of the redox potential, number of surface-available ferrocenes oxidized, peak current intensity, and stability to multiple oxidation-reduction cycles (Figure 1.8).62, 64-65 Fc+X-
ion pair formation is also known to cause structural changes in the oxidized SAM.62, 71
Figure 1.9. Schematic illustration of the structure of ferrocenylalkanethiol.
Ferrocenylalkanethiols have a lollipop shape (Figure 1.9) − there is a mismatch between the size of the ferrocene head and alkyl tail. The maximum surface coverage of the FcCnS assuming a hexagonal packing of ferrocene spheres of diameter of 6.6 Å is Γmax =
4.5×10⁻¹⁰ molˑcm-2.56 Due to the high density of the ferrocene groups in the SAM, the pairing
of anions to the ferrocenium cations is sterically constrained. Spectroelectrochemical measurements show that either the ferrocene heads and/or the alkyl chains adopt a more vertical position so that the ferrocenium can pair with the anions (Figure 1.10).5, 72 However,
there is still a debate as to which one of these reorientations is operative. Oxidation of the SAM-bound ferrocenes has been found to produce a film thickeness change of 0.1-0.5nm,5, 72
depending on the technique used (ellipsometry, SPR or AFM), and a film volume expansion of the order of 10-20 cm3ˑmol-1.73
A
Fc= 34 Å
216
Figure 1.10. Illustration of the FcC12S/Fc+C12SAu reorientation induced by the redox reaction.
17
1.4 Odd-Even Effects in SAMs
Odd-even effects in the structure and properties of materials are a widely observed phenomenon in the field of chemistry, biology, physics and materials science. In general, the odd-even effect describes an alteration of the structure caused by an odd versus even number of structural units in the molecule, such as a methylene group CH2 in an alkyl chain. These
small changes in molecular structure can cause large changes in the overall intermolecular interaction energy and, as a result, a huge difference in the macroscopic structure and properties of the material or films.74 The odd-even effect manifests itself in bulk materials,
including nanomaterials, and at various organic/solid surfaces and interfaces, and it can be applied in crystal engineering,75 drug design,76 exchange kinetics,77 and nanomechanical redox
electronics.78
Melting points are a classic manifestation of odd-even differences in the molecular structure of a solid. The melting points of the ferrocenylalkanethiols are a good example. Although there is a mismatch in the size of the ferrocene head and the alkyl chain, the melting points of the bulk state ferrocenylalkanethiols, measured by differential scanning calorimetry, exhibit an odd-even alternation as shown in Figure 1.11. The ferrocenylalkanethiols with an even number of CH2 units exhibit a closer molecular packing compared to the odd number
ones, and therefore, the ferrocenylalkanethiols with neven melt at a higher temperature than
18 6 7 8 9 10 11 12 13 14 15 16 10 20 30 40 50 60 Me lting p o int ( C )
Alkyl chain length, n
Figure 1.11. Melting points of ferrocenylalkanethiols (bulk or 3D material).
However, when the same molecules are chemically bonded to a solid surface to form 2D organic self-assembled monolayers, the all trans chain conformation results in a different orientation of the terminal group. This odd-even effect originates from the fixed bond angle of the chemical binding group and substrate, such as M-S-C bond angle (i.e., ~100° for Ag-S-C and 110° for Au-S-C)79 for all SAMs independent of the odd or even number of the
methylenes (n) in the alkyl chain (Figure 1.12), which leads to an odd-even alternation in the tilt angle () of the terminal group with respect of the surface normal and a difference in the molecular packing pattern of the SAMs to meet the energetic equilibrium.
19
Figure 1.12. Schematic illustration of ω-functionalized alkanethiolates (S(CH2)nCH2X)
chemisorbed onto a metallic surface.
Recently, several investigations have explored the capabilities of variants of scanning force microscopy (SFM) to map differences in the spatial orientations of terminal chemical groups and to exploit a range of interfacial properties such as adhesion and friction. For instance, Porter and coworkers demonstrated that the difference in the orientation of the terminal group of an organic monolayer has a detectable impact on the friction measured by friction force microscopy (FFM).80 To test the mapping concept, FFM was used to image
CH3(CH2)nS monolayers on gold films and the series of friction images, shown in Figure 1.13,
demonstrate two distinct contrasts, with brighter contrast corresponding to areas of higher friction. Figure A, C, D and Figure B, D, F are control experiments, in which the patterning sequence used to prepare the sample were inversed for the latter, to prove that the friction difference was independent from the preparative method. The dipole moment of the methyl groups in the odd-numbered SAM domains is oriented more close to the surface normal compared to that of the methyl groups in the even-numbered domains. The surface free energies of the systems are also correlated with the spatial orientation of the terminal methyl groups.81 Thus, the friction between the probe tip and the even-numbered domains is greater
20
Figure 1.13. Friction images of CH3(CH2)nS monolayers patterned on smooth gold at a
contact load of ~25 nN by microcontact printing (P), followed by solution deposition (SD): (A) n15(P), n16(SD); (B) n16(P), n15(SD); (C) n14(P), n15(SD); (D) n15(P), n14(SD); (E) n13(P), n14(SD) and (F) n14(P), n13(SD). The brighter contrast corresponds to higher friction. Reprinted from ref 80. Copyright 1998, American Chemical Society.
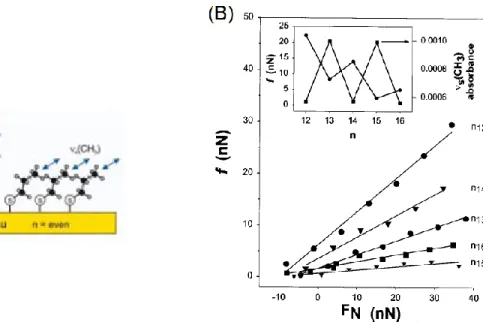
A more quantitative analysis, shown in Figure 1.14, represents the friction (f) as a function of the contact load (FN) on flat regions without contributions from substrate
topography. Apart from the linear relation between f and FN, the slopes (the coefficient of
friction) follow the trend, 15 < 16 < 13 < 14 < 12, in which the friction measured on adlayers with even-numbered chain length is higher compared to adjacent odd chain length ones. The inset also shows the absorbance of the lower energy s(CH3), which implies that the
permanent dipole moment of the methyl group is canted more from the surface normal of the gold substrate when n is even (~53°) than n is odd (~26°).82 The contact angle of the
n-alkanethiolates monolayers is only ~2° larger when n is odd.80, 83 The surface free energies are
then determined by the spatial orientation of the terminal group and results in a detectable difference in friction.
21
Figure 1.14. (A) Idealized structure of n-alkanethiolates on gold substrate. (B) Plots of friction
force (f) vs. the contact load (FN) for n-alkanethiolates monolayers chemisorbed on gold. The inset plots represents the f and the absorbance of the s(CH3) obtained from infrared reflection spectroscopy in function of n. Reprinted from ref 80. Copyright 1998, American Chemical Society.
The wettability was extensively studied for various organic SAMs on Au (111) and Ag (111) via measurements of the contact angle of liquid drops on the SAM (Figure 1.15).21 The
wettability of the SAMs is sensitive to the contact area of the organic monolayers with the contacting liquid,18, 83-85 and the contact angle of SAMs typically varies from 0° (complete
wetting) to 114° (partial or incomplete wetting) determined by the terminal groups.9 The
wetting properties of a number of organic monolayers exhibit an odd-even effect of the chain length, which is generally determined by the topmost structure of the SAM, such as the orientation and dipole of the terminal group, the geometry of the alkyl chain, and the binding of the tethered functional group. For instance, the CF3-terminated n-alkanethiols SAMs exhibit
a measurable odd-even effect on rough surfaces whereas the CH3-terminated SAMs do not.
One explanation is that the terminal -CH2CF3 has a larger dipole moment and interacts more
strongly with relatively weak dipole, such as water, which helps to overcome surface roughness effects and shows the interfacial property of SAMs.
22
Figure 1.15. Contact angle measurement: contact angle (θ). Reprinted from ref 21. Copyright
1992 Annual Reviews.
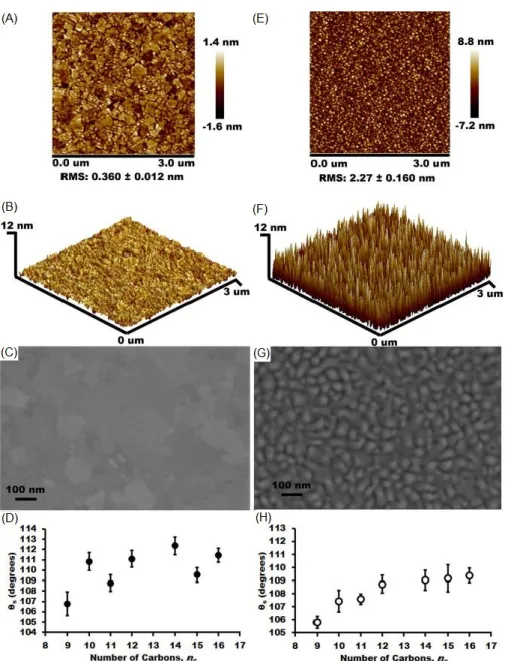
More specifically, Thuo and coworkers report that the hydrophobicity of SAMs is dominated by the nature of the substrate (surface roughness and identity) and SAM tilt angle (Figure 1.15), which results in surface dipoles and orientation of the terminal moiety.86 The
static contact angle formed by water droplets on n-alkanethiolate SAMs with an odd (SAModd)
or even (SAMeven) number of carbons is characterized by a zigzag oscillation in the values of
s. An odd-even effect is only observed on SAMs fabricated on ultraflat template-stripped (TS)
metal surfaces, in which the interfacial properties are dictated by the SAMs rather than the roughness of the substrates. The contact angle observed with SAModd on AuTS is lower than
that of SAMeven which implies water spreads better on SAModd surfaces than on the analogous
23
Figure 1.16. Surface roughness and contact angles observed on Au surfaces. AFM images of
the AuTS substrate: (A) two-dimensional (2D) view. (B) tilted three-dimensional (3D) view of
a 3 × 3 m surface. (C) Surface roughness and polycrystallinity were confirmed by SEM. (D) Static contact angles measured by a drop of water on n-alkanethiolate SAMs formed on AuTS
substrate. (E-H) Similar images for the AuAD (“as-deposited”) surface. Reprinted from ref 86.
24
Christian Nijhuis’s group found significant differences in the electrical properties of molecular diodes comprised of FcCnSAu or FcCnSAg with n = 6-15.6 Even though strong π-π
interactions (~40 kJˑmol-1) have been widely considered to be key for the rational optimization
of the performance of organic electronic devices,87 Nijhuis et al. were the first to show that
weak intermolecular van der Waals interactions (~15 kJˑmol-1) play a crucial role where the
film properties change as a function of the number n of the repeat unit.74 In their experiments,
they employed the ‘EGaIn’ technique,6, 74 in which SAMs of Fc(CH
2)nS are covalently bound
to template-stripped silver or gold bottom electrodes by Ag-S or Au-S bonds, and the ferrocene termini build van der Waals interactions with the Ga2O3/EGaIn top electrodes
(Figure 1.17 A). For junctions with FcCnSAg SAMs of n = 8-13, the values of the rectification ratio for the odd number chain lengths are tenfold larger for the even chain length homologues (Figure 1.17 B). For the shortest chain lengths where n = 6 and 7, the SAMs are disordered with weak alkyl-alkyl chain interactions, and the junctions give low yields of working devices (i.e., molecular diodes). For the longest chain length, where n = 14 and 15, these SAMs are also disordered due to the back-bending of the ferrocene moieties.6 As a result, an odd-even
effect exists only for the middle chain lengths in which van der Waals interactions are more favorable and more ordered SAMs are hypothesized to be formed.
25
Figure 1.17. (A) Schematic illustration of junctions of AgTS-SCnFc//Ga
2O3/EGaIn; (B) Values
of the rectification ratio R as a function of the alkyl chain length n. Reprinted from ref 6 and 79. Copyright 2015, American Chemical Society.
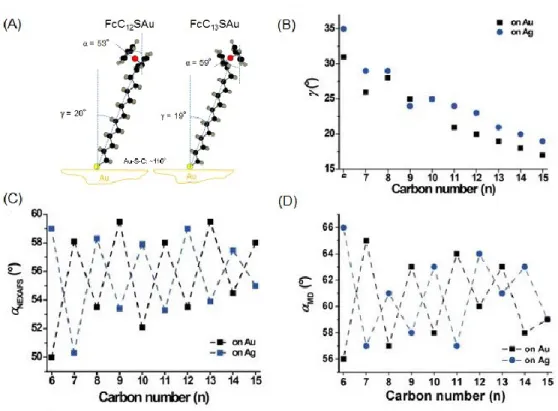
In the neutral state, molecular dynamics suggest that the alkyl chains are tilted about 20 degrees from the vertical. NEXAFS (Near Edge X-ray Absorption Fine Structure) measurements indicate that the ferrocene heads are oriented around 55 degrees from the surface normal.6 It is also noted there is ~5° difference in the tilt angle of the ferrocene heads
in the neutral state for FcCnS SAMs of odd versus even number of methylenes (Figure 1.18). On gold, the ferrocene headgroups are standing more upright towards the surface normal when
26
n is even-numbered, which results in improvements in the computed SAM packing energy. The odd-even effect in the tilt angle of the Fc units in turn results in an odd-even effect in the surface dipole, work function, rectification ratio, tunneling current, and SAM packing energy (Figure 1.19).6 Less steric hindrance between the Fc termini when ferrocenes stand more
upright causes a more ordered supramolecular structure which is less susceptible to substrate defects. A completely reverse trend is observed on Ag.
Figure 1.18. (A) Schematic illustration of the odd-even difference in the orientation of the
terminal ferrocene unit suggested by NEXAFS and MD simulations in FcCnSAu SAMs of neven and nodd for an ideal all-trans extended conformation of the alkyl chains. (B) Tilt angle ()
of the linear backbone of the alkyl chain away from the surface normal as a function of the number of methylenes (n), is estimated by molecular dynamics. (C) The ferrocene tilt angles (NEXAFS) as a function of n are derived from the angular dependence of the NEXAFS spectra.
(D) The ferrocene tilt angles (MD) calculated by MD simulations. (B), (C) and (D) are from
27
Figure 1.19. Characteristics of junctions with SAMs of SCnFc on Au and Ag as a function of n. (A) Tunneling current, |J| of the junctions at +1.0 V, (B) Rectification ratio, R and (C) Calculated SAM packing energy. Reproduced from 6. Copyright 2015, American Chemical Society.
(A)
(B)
28
Although several studies have focused on the electrical and electrochemical properties of ferrocenylalkanethiolate SAMs, there is a lack of information concerning the FcCnSAu packing structure and conformational order, and how the alkyl chain length impacts the Fc+X
29
1.5 SAM Characterization
1.5.1 Surface Plasmon Resonance (SPR)
During the last two decades, surface plasmon resonance (SPR) has become a remarkably popular label-free analytical tool due to its high sensitivity and relatively simple instrumentation required.88-93 SPR is an all-optical technique used to follow in situ and in real
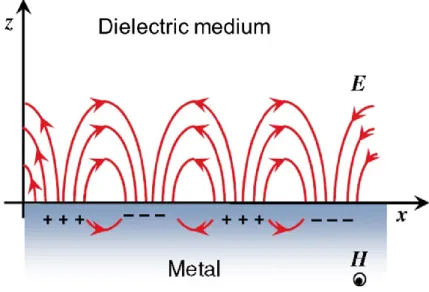
time molecular processes occurring on metal and dielectric interfaces in gas or liquid environments. The detection relies on the resonant excitation of freely oscillating electrons (plasmons) at the metal/dielectric interface by p-polarized light, resulting in a surface-bound evanescent electromagnetic wave of optical frequency (Figure 1.20).94 The resonance
excitation is extremely sensitive to the refractive index (RI) of the medium adjacent to the metal surface as small as 10-7 with a time resolution of seconds97, which leadsSPR to many
potential applications in the field of chemistry, physics and biology, for example, it, as a surface-oriented technique, has shown great potential for affinity biosensors, allowing the examination of the kinetics of biomolecular interactions. SPR can detect the adsorption or desorption of molecules from the metal sensing surface and changes in the molecular orientation of the adsorbate with sub-monolayer sensitivity. This makes the SPR technique ideal for accurately monitoring molecular events occurring at the interface.
Figure 1.20. Schematic illustration of the electromagnetic field with surface plasmons
30
SPR is a quantum phenomenon, which has been reviewed extensively in the literature.90, 95-97 and can readily be understood with Maxwell equation for the electromagnetic
waves. In the classical model, a semi-infinite media with frequency-dependent dielectric functions εi () separated by a plane at z = 0 is considered. Maxwell’s solutions, “surface
waves”, at the boundary between the two media have the relation:
𝐸𝑖 = (𝐸𝑥𝑖, 0, 𝐸𝑧𝑖)𝑒𝑥𝑝𝑖(𝑘𝑥𝑖𝑥+𝑘𝑧𝑖𝑧−𝜔𝑡) (4)
𝐻𝑖 = (0, 𝐻𝑦𝑖, 0)𝑒𝑥𝑝𝑖(𝑘𝑥𝑖𝑥+𝑘𝑧𝑖𝑧−𝜔𝑡) (5)
Where E and H represent the electric and magnetic fields, ki is the magnitude of the wave vector and the parameter i denotes the different media (i = m for the metal and i = d for the dielectric medium). Even though every lineally polarized radiation can be represented as a superposition of p- and s-polarization, it is only the p-polarization that can lead to a charge density oscillation in the z-direction at an interface, as shown in Figure 1.20.
The interfacial boundary conditions require that the E and H fields should be continuous at the interface and results in a nontrivial solution:
𝑘z1 𝑘z2= −
𝜀2
𝜀1 (6)
where kz1 and kz2 are the wave vectors at the interface between two media. This equation
indicates that the surface plasmons can only exist at the interface between two media with dielectric constants of opposite sign, so the case where one media is dielectric (𝜀𝑑 > 0) and the other is a metal (𝜀𝑚 < 0) follows the rule. The interfacial boundary conditions also stipulate
the continuity of the two-dimensional wave vector, i.e. kxm = kxd =kx, and for any
electromagnetic mode, the wave vector kzi is given by:
𝑘𝑧𝑖 = √𝜀𝑖 ( 𝜔
𝑐) 2− 𝑘
𝑥2 (7)
With the equations (6) and (7), the wave vector of the surface plasmons at the metal/dielectric interface is given by:
31 𝑘𝑥 = 𝑘𝑠𝑝 = 𝜔
𝑐 √ 𝜀𝑚∙𝜀𝑑
(𝜀𝑚+𝜀𝑑) (8)
where both the dielectric functions and wave vectors are complex. The real part of 𝑘𝑥 indicates the finite surface plasmon propagation and the imaginary part describes the dampening of the surface plasmon in the metal and dielectric media. Since the refractive index (n) is defined as the square root of its dielectric constant (n = √𝜀), the surface plasmon resonance also depends on n.
The coupling and excitation of the surface resonance plasmons require that the both angular frequency and momentum are matched with that of the incident photon and surface plasmon, which means that the wave vectors of the photons and surface plasmons are equal in both magnitude and direction with the same wave frequency. The momentum of a free photon propagating in a dielectric medium is given as
𝑘𝑝ℎ = (𝜔
𝑐𝑑)√𝜀𝑑 (9)
where the dispersion of the photons is described by the light line (𝜔 = 𝑐𝑑𝑘). While the wave vector of the plasmon is bound to the planar metal/dielectric interface, it is only the part in parallel direction that is taken into consideration by
𝑘𝑝ℎ𝑥 = (𝜔
𝑐𝑑) sin Θ√𝜀𝑑 (10)
where is the incident angle of incidence. The wave vector 𝑘𝑝ℎ𝑥 can be tuned to equate the
surface plasmon ksp by changing the incidence angle (Θ). Nevertheless, it is obvious that there
is no angle of incidence on the metal surface for which the horizontal component of light matches the surface plasmon for any value of Θ and 𝜔. In other words, the momentum of the photon ( 𝑘𝑝ℎ𝑥 ) in a dielectric medium is always smaller than the momentum of the surface
32
Figure 1.21. Schematic illustration of the Kretschmann attenuated total reflectance (ATR)
geometry for the excitation of surface plasmons from ref 92. Copyright 1968, Verlag der Zeitschrift für Naturforschung.
However, there are mechanisms which make the external radiation possible to be coupled with surface plasmons, called attenuated total reflection (ATR).91-92 Two most
popular configurations of the ATR method are the Kretschmann geometry91 and the Otto
geometry.92 In the Kretschmann geometry, a high refractive index prism with refractive index
(np) is interfaced with a metal-dielectric waveguide consisting of a thin metal film of permittivity (𝜀𝑚) and a semi-infinite dielectric with a refractive index (nd) where nd < np,
Figure 1.21. The effect of the more optically dense medium (prism) is to modify the wave vector of the incident light by increasing the momentum of the photons, so that the new dispersion relation of the photon is given by
𝑘𝑝ℎ = (𝜔
𝑐𝑑) sin Θ√𝜀𝑝 (11)
With the involvement of the prism, kph can be easily modified by the refractive index of the prism. The Kretschmann configuration is one of the optical techniques which rely on the phenomenon of the total internal reflection (TIR) of light at a two-media boundary. For the incident light beam propagating through the optically dense prism, Snell’s law98 requires that
at an incident angle exceeding the critical value all light will be completely reflected. As the angle of incidence approaches the critical angle, gradually improved energy accumulates in the reflected beam, and the reflectivity reaches its maximum (unity) at the critical value.
33
Although the incident light is internally reflected, there still exists a proportion of light that penetrates into the adjacent medium with a lower refractive index (Figure 1.21). The amplitude of this evanescent field wave decreases exponentially with increasing distance from the interface. When a high refractive index substrate is coated with a metal film of an appropriate thickness (typically 45-50 nm), the electrical field of the evanescent wave can overlap with that of the surface plasmon and energy transfer between the two waves is possible. The angle at which the phenomenon occurs is called the resonance angle, SPRor
min.
Figure 1.22. Illustration of a reflectivity-incident angle (R-) or SPR curves.
When the reflectivity is monitored as a function of i, it shows a minimum in the
reflectance that corresponds to the resonant coupling of photon energy by the surface plasmon, as shown in Figure 1.22. min is extremely sensitive to the refractive index of the solution
directly adjacent to the metal film, and a shift in the resonance angle (min) is observed if the
refractive index of the medium changes. Because it senses evanescent waves, SPR-based sensor responds to the refractive index of the analyte within a depth of 200 nm from the sensor
34
(metal) surface. Notably, layer thickness changes of 1-2 Å or nanograms of adsorbed mass are readily measured.
The reflectivity vs. profiles are generally analyzed using a multilayer Fresnel model to obtain the structural information at the interface. It is assumed that each phase is homogeneous and parallel to the planar interface. Moreover, the analysis requires knowledge of the refractive index in each phase. Gold and silver are the two most frequently used metals for SPR, with the inherent stability of gold in air and a sharper peak is provided by silver. The metal surface can act as a surface for chemisorption or deposition of an organic film with specific chemical functionality.
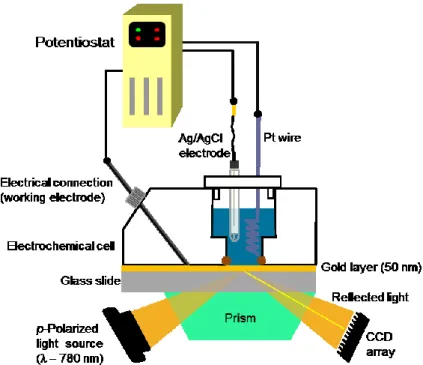
In the work herein, the SPR is used to detect redox-induced changes in molecular orientation of the terminal moieties by the changes in dielectric constant. Instead of using independently, SPR can also be coupled to cyclic voltammetry to follow in situ and in real time the oxidation and reduction on surface and demonstrate the possible effects on the surface-confined redox and ion-pairing reactions, and oxidation-induced changes of the SAM structure. If the study targets are SAMs, the modified metal substrate acts as both the working electrode in a conventional three-electrode cell and as the surface plasmon supporting surface (Figure 1.23). Changes in the thickness of the SAM cause an increase in the resonance angle (Figure 1.24A), and it is this angle shift which is monitored with applied potential during the cyclic voltammetric scans. The angle of minimum reflectivity, or resonance angle, can be tracked as the SAM is cycled between the reduced and oxidized state (Figure 1.24B).
35
Figure 1.23 Illustration of the electrochemical surface plasmon resonance (EC-SPR) setup
used for the investigations of the FcCnSAu SAMs.
51.8 51.9 52.0 52.1 0.0 0.1 0.2 Fc+ R ef lec tiv ity
incident angle, / degree)
Fc -2 0 2 -0.1 0.0 0.1 0.2 0.3 0.4 0.5 0.6 0.7 0 1 2 m in x 10 -2 / d egr ee E / V (vs. Ag/AgCl) j A cm -2
Figure 1.24. (A) Surface plasmon resonance angle shifts to higher value when Fc is oxidized
into Fc+ due to an oxidation-induced structural rearrangement of the SAM. (B) Current density
j and resonance angle change min for five consecutive voltammetric cycles of a FcC16SAu
SAM in 0.1 M NaClO4(aq) are shown.