HAL Id: hal-02268492
https://hal.archives-ouvertes.fr/hal-02268492
Submitted on 21 Aug 2019
HAL is a multi-disciplinary open access
archive for the deposit and dissemination of
sci-entific research documents, whether they are
pub-lished or not. The documents may come from
teaching and research institutions in France or
abroad, or from public or private research centers.
L’archive ouverte pluridisciplinaire HAL, est
destinée au dépôt et à la diffusion de documents
scientifiques de niveau recherche, publiés ou non,
émanant des établissements d’enseignement et de
recherche français ou étrangers, des laboratoires
publics ou privés.
Trung-Hien Nguyen, Laurent Bramerie, Mathilde Gay, Marwa
Kazdoghli-Lagha, Christophe Peucheret, Robin Gerzaguet, Simon-Pierre
Gorza, Jérome Louveaux, François Horlin
To cite this version:
Trung-Hien Nguyen, Laurent Bramerie, Mathilde Gay, Marwa Kazdoghli-Lagha, Christophe
Peucheret, et al.. Experimental Demonstration of the Trade-off between Chromatic Dispersion and
Phase Noise Compensation in Optical FBMC/OQAM Communication Systems. Journal of
Light-wave Technology, Institute of Electrical and Electronics Engineers (IEEE)/Optical Society of
Amer-ica(OSA), 2019, 37 (17), pp.4340-4348. �10.1109/JLT.2019.2923763�. �hal-02268492�
Abstract—Filterbank multicarrier based on offset-quadrature
amplitude modulation (FBMC/OQAM) is a promising candidate for optical fiber communication systems, thanks to its better time/frequency confinement compared to other multicarrier modulations. Among linear impairments, the compensation of fiber-induced chromatic dispersion (CD) and laser-induced phase noise (PN) in FBMC/OQAM systems induces a compromise in terms of the number of used subcarriers. Considering a fixed dedicated signal bandwidth, the number of subcarriers is expected to be large enough to allow a better frequency-domain CD compensation. On the other hand, it should be sufficiently small in order for the compensation of common phase error inherent to the PN to work properly. In this paper, we experimentally demonstrate the trade-off between CD and PN compensation that we previously highlighted by simulations. More specifically, considering a 20-GHz FBMC/4−−OQAM modulation and an aggregated laser linewidth of about 200 kHz, we show that the maximum transmission distance reaches 3100 km with nearly 512 active subcarriers and 3-tap equalizers, when a maximum 1-dB optical signal-to-noise ratio (OSNR) penalty at a bit-error-rate (BER) of 3.8××10–3 can be tolerated.
Moreover, we propose and validate a frame structure and an integrated synchronization/channel equalization architecture to implement a standalone demodulation system.
Index Terms—Filterbank multicarrier, offset-QAM, coherent
detection, PN estimation, CD compensation, CFO compensation, long-haul communications.
I. INTRODUCTION
ILTERBANK MULTICARRIER (FBMC) based on offset-quadrature amplitude modulation (OQAM) has currently This work is supported by the Belgian Fonds National de la Recherche Scientifique (FNRS) under Grant PDR T.1039.15.
T.-H. Nguyen, S.-P. Gorza and F. Horlin are with OPERA department, Université libre de Bruxelles, 1050 Brussels, Belgium (e-mail:
trung-hien.nguyen@ulb.ac.be).
L. Bramerie, M. Gay and C. Peucheret are with Univ Rennes, CNRS, FOTON - UMR 6082, F-22305 Lannion, France.
M. Kazdoghli Lagha and R. Gerzaguet are with Univ Rennes, CNRS, IRISA, F-22305 Lannion, France.
J. Louveaux is with ICTEAM institute, Université catholique de Louvain, 1348 Louvain-la-Neuve, Belgium.
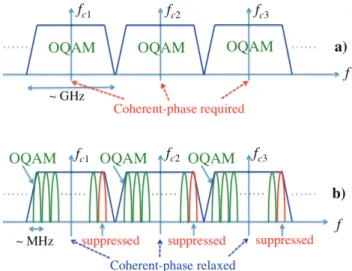
appeared as a promising multicarrier modulation candidate in optical fiber communication systems [1-4]. Compared to the commonly used optical orthogonal frequency-division multiplexing (OFDM) modulation, FBMC/OQAM has no cyclic prefix and hence increases the throughput rate. Originally, FBMC/OQAM was introduced assuming a large subcarrier bandwidth, i.e. 2-4 GHz. Thanks to OQAM, the orthogonality between adjacent subcarriers is preserved without requiring any redundant cyclic prefix as for OFDM. However, when the system is implemented with multiple optical sub-channels, phase-coherent lasers are required, leading to an increase of the system cost. We alternatively proposed to increase the number of subcarriers of the FBMC modulation [4]. In the multiple optical sub-channels case, by deactivating one subcarrier at the spectrum edge of each sub-channel, multiple sub-channels can be placed closer to each other at the cost of negligible guard bands (tens of MHz only). The constraint on phase-coherent lasers is also relaxed. This approach is made possible thanks to the good time-frequency confinement of FBMC modulation and a better side-lobe suppression compared to OFDM. Fig. 1 illustrates the multiple sub-channels case with a constraint of a negligible guard band
Experimental Demonstration of the Trade-off
between Chromatic Dispersion and Phase Noise
Compensation in Optical FBMC/OQAM
Communication Systems
Trung-Hien Nguyen, Member, IEEE, Laurent Bramerie, Mathilde Gay, Marwa Kazdoghli Lagha,
Christophe Peucheret, Robin Gerzaguet, Simon−Pierre Gorza, Jérôme Louveaux, Member, IEEE, and
François Horlin, Member, IEEE
F
Fig. 1. Examples of multiple sub-channels multiplexing in WDM systems. a) Coherent-phase lasers required; b) Coherent-phase lasers relaxed with a negligible guard band.
In contrast to single carrier systems, multicarrier systems leverage the use of a simple 1-tap equalizer on a per-subcarrier basis to compensate for the fiber-induced chromatic dispersion (CD) by using a sufficiently high number of subcarriers. This is made possible by the fact that the channel is nearly flat at the subcarrier level. Several studies aimed at enhancing the transmission distance by using more advanced equalizer structures [3−5], albeit at the price of additional computational complexity. Increasing the number of subcarriers leads to the increase of symbol duration and unfortunately makes the multicarrier systems more prone to the time-varying laser-induced phase noise (PN) effects. PN creates loss of the OQAM orthogonality, resulting in inter-carrier interference (ICI) and inter-symbol interference (ISI). Considering the FBMC symbol level, PN causes both common phase error (CPE) and ICI [6]. Similar to OFDM systems, ICI compensation methods often require feedback structures that may be undesirable in real-time implementations. In contrast, CPE compensation methods only need feedforward structures to still deliver a good performance [7]. We hence focus on CPE compensation methods. Research on CPE compensation methods is very active in both wireless [6, 8-10] and optical communications [11-13]. Although the proposed algorithms for CPE compensation have proved their effectiveness, they provide a limited performance when the number of subcarriers is too high [7].
As pointed out in our recent work [4], there exists therefore a trade-off between CD and PN compensation when designing an FBMC/OQAM system utilizing a dedicated signal modulation bandwidth. However, this result was not validated experimentally. Note that, the trade-off study and system design can be extended quite straightforwardly to other multicarrier systems such as those using OFDM. In this paper, we apply the system-design methodology proposed in [4] to a particular system specification and experimentally validate it in a system using 20-GHz FBMC/OQAM modulation, a summed laser linewidth of about 200 kHz and 1- or 3-tap equalizers. Moreover, we propose a frame structure and an integrated synchronization/channel equalization architecture to enable the system to work properly.
The paper is organized as follows: in Section II, a mathematical description of an FBMC/OQAM transmission system is introduced. In Section III, we present the transceiver structure. The detailed digital signal processing (DSP) is discussed in Section IV. In Section V, we describe our experimental setup. The results are presented and discussed in Section VI. Section VII discusses the influence of the digital-to-analog converter/ analog-to-digital converter (DAC/ADC) limited resolution. Finally, Section VIII concludes the paper.
II. FBMC/OQAMTRANSMISSION SYSTEM MODEL In order to assess the trade-off between CD and PN compensation, we consider only one polarization, even if the results can straightforwardly be extended to two polarizations. An equalizer for polarization demultiplexing and polarization
designed based on the minimum mean-square-error (MMSE) criteria [2]. We denote the number of subcarriers, subcarrier index and QAM symbol duration as 2M, m and T, respectively. At the transmitter, a burst of NS QAM symbols, cm,q, are firstly passed to the OQAM block, where the real and
imaginary components of QAM symbols are delayed with respect to each other to form the real-valued symbols, dm,l, at
the rate 2/T. These real-valued symbols are then multiplied by a phase rotation factor, θm,l = jm+l. After that, the samples are
up-sampled by M before being filtered by the synthesis filter bank (SFB). Note that we use a poly-phase network (PPN) [14] in order to get an efficient implementation of the SFB. We use the PHYDYAS filter [14] as the prototype filter
g[n] of length Lg = 2KM, where K is the overlapping factor set
to 4. The output FBMC signal at the rate FS = 1/TS = 2M/T is
obtained by the summation of all subcarriers and can be written as [15] s n
[ ]
= dm,l⋅gm,l[ ]
n m=1 2M∑
l=1 2NS∑
, (1) where gm,l[ ]
n = θm,lg n − lM[
]
exp jπ m / M(
(
)
(
n − (Lg−1) / 2)
)
.After generation and conversion into the analog domain, the electrical signal is then modulated onto the optical domain before propagating over optical fibers. In our studies, we work in the linear transmission region, where CD is the main impairment. The transfer function associated with CD, H f
[ ]
, can be expressed as [4]H f
[ ]
=e−jπDλ 2Lc f2, (2)
where L, λ and c are the fiber length, the wavelength and the
speed of light in vacuum, respectively. The fiber dispersion coefficient is denoted by D, whose typical value is 17 ps/nm/km for a standard single mode fiber (SSMF). Note that, f is the relative frequency with respect to the optical carrier frequency and f ∈ −F
[
S/ 2, FS/ 2]
.At the receiver side, the received signal, r[n], after heterodyne-detection is corrupted by zero-mean additive white Gaussian noise (AWGN) denoted by w[n], the carrier frequency offset (CFO) ΔfCFO (originating from the frequency
difference between the transmitter and receiver local oscillator lasers) and the PN φ[n] of linewidth Δν. The combined PN
coming from transmitter and receiver lasers is modeled as a Wiener process [7]
φ
[ ]
n =φ[
n −1]
+θ[ ]
n , (3)where θ[n] is a zero mean real Gaussian random variable with variance σθ2 = π⋅Δν⋅T/M. The received signal can be expressed
r n
[ ]
= S f[ ]
H f[ ]
ej2π fTSn f =−Fs/2 Fs/2∑
+w n[ ]
⎛ ⎝⎜ ⎞ ⎠⎟e j 2πn⋅f( CFO⋅TS+φ[ ]n), (4)in which S f
[ ]
is the Fourier transform of s[n]. Coarse CFO compensation is carried out within the framework of the frame synchronization (see Section IV.A). We denote !r n[ ]
as the received signal after frame synchronization. In order to build a proper receiver chain, some assumptions are made on the impairments and channel effects encountered by the received signal as follows− We assume that the remaining CFO is small (i.e., smaller than the subcarrier spacing) and constant over the FBMC symbol.
− We assume that the coherence bandwidth of the channel is larger than the subcarrier spacing [16]. It means that simple single tap equalization can be applied at the receiver stage.
− We assume that the coherence time of the phase noise process is shorter than, or equal to, the FBMC symbol duration. By doing so we can approximate (3) by the so-called CPE term φ.
Based on the aforementioned assumptions1, the received
signal at the output of the analysis filter bank (AFB), at the subcarrier m0 and the multicarrier symbol l0 can be expressed
as
1 It is important to note that these hypotheses are made to ease the receiver
stage processing. In practice, they are not mandatory to allow a functional chain. ym0,l0 = r n!
[ ]
gm0,l0 *[ ]
n n=1 Lg∑
≈ ej πl(
0⋅Δfl0+φl0)
H m0 dm,l gm,l[ ]
n gm0,l0 *[ ]
n n=1 Lg∑
m=1 2M∑
l=1 2NS∑
+ !wm0,l0 (5)where Hm = H[fm] with fm being the m-th subcarrier frequency,
Δfl0 and φl0 are the CFO and CPE at the multicarrier symbol
l0, respectively , w!m0,l0denotes the filtered additive noise with
zero mean and variance of the complex noise σw2 . Note that,
the coefficient 2 on the exponential term of the residual CFO disappears due to the fact that the time-frequency spacing product of FBMC is equal to 0.5. Since
Re gm,l
[ ]
n gm0,l0 *[ ]
n n=1 Lg∑
{
}
≈δm−m0,l−l0, in which δ is the Kronecker delta function and Re is the real part operator, the received signal in (5) can be reformulated as followsym,l≈Hm
(
dm,l+j ⋅um,l)
ej πl⋅Δf +φ( l)+ !wm,l, (6)where um0,l0 is the intrinsic interference coming from the
neighboring symbols on the subcarrier of interest. It is assumed to be independent of the transmitted data at the subcarrier and time index of interest.
After channel compensation, residual CFO and PN tracking, the transmitted signal can be recovered by taking the real part of the compensated signal. In the following sections, we discuss in detail the frame structure and the digital signal processing (DSP) procedure.
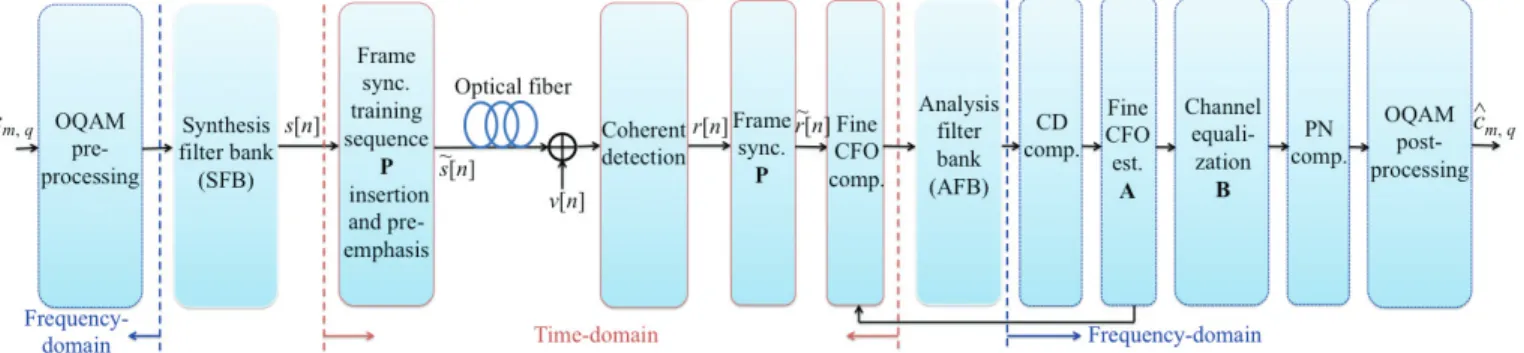
III. FRAME STRUCTURE AND RECEIVER ARCHITECTURE The schematic diagram of an optical FBMC/OQAM transceiver is illustrated in Fig. 2. At the transmitter side, the following stages are implemented:
− FBMC/OQAM generation: the QAM symbols are passed to the OQAM pre-processing block. The OQAM data symbols and the training symbols are sent to the SFB in order to construct the time-domain FBMC signal.
− Training sequences for the fine CFO (A) and channel Fig. 2. Block diagram of an equivalent FBMC/OQAM transmission system.
Fig. 3. Illustration of an FBMC/OQAM frame structure in frequency-time lattice coordinate.
symbols (D), as shown in Fig. 3. Considering the data-bearing training symbols, zeros are alternatively inserted along with pilot symbols, which are binary phase-shift-keying (BPSK) data. The zeros play the role of avoiding interference from the adjacent pilot symbols. Note that, we deactivate the subcarriers at the center (DC subcarrier) and the two edges of the spectrum due to the bandwidth limitation of the digital-to-analog converter.
− FBMC frame construction: the frame synchronization training sequence (P) is appended in front of the generated FBMC signal before being optically modulated and propagated over the optical fiber. For simplicity, we choose this training sequence of the BPSK modulation and assume that it is known beforehand at the receiver side.
At the receiver side (Fig. 2), after coherent detection, we carry out the following steps
− Time-domain frame synchronization and coarse CFO compensation: the detailed algorithms will be discussed later in Section IV.A.
− Frequency-domain processing: the signal is converted to the frequency-domain by passing through the AFB. The processing consists of the coarse CD compensation, fine CFO estimation (using A), channel equalization (using B) and blind PN tracking. Note that, in order to compensate for the channel response, we use a two-stage compensation, in which the first stage suppresses the static CD based on the method in [4] and the second stage uses the channel estimation (CE) pilots to compensate for residual CD and other frequency responses inherent to bandwidth-limited devices (see Sections IV.B and C).
− Finally, the OQAM post-processing block transforms the OQAM signals back to QAM signals for bit-error-rate (BER) calculation. In what follows, we describe the algorithms used in each block at the receiver side.
IV. DIGITAL SIGNAL PROCESSING (DSP)ALGORITHMS
A. Frame Synchronization
The training sequence for the frame synchronization, p[n], is used for start of frame (SoF) identification and coarse CFO compensation. Before doing coarse CFO compensation, we need to identify the SoF. In case the received signal r[n] suffers mainly from the influences of the CFO and the laser PN, a good correlation property of the training sequence can be maintained. Instead of using a timing metric that requires a specific structure of the training sequence, i.e., Schmidl-Cox timing metric [17], we propose to use only a known random sequence and to identify the SoF by the following differential cross-correlation Dk
[ ]
n = 1N − k(
r*[
n + l]
p l[ ]
)
(
r*[
n + l − k]
p l − k[
]
)
* l=k N−1∑
, (7)where k is the cross-correlation window index, 1 ≤ k ≤ W, W is the cross-correlation averaging window and N is the length of the considered received signal. It is worth noticing that in
transmission systems, the CD effect in the fiber cannot be neglected. Fortunately, a coarse estimate of the CD accumulated over a link is normally known beforehand. Instead of applying a coarse CD compensation to the received signal, we propose here to pre-distort the training sequence
p[n] with the known CD using (2) and then apply (7) for the
SoF identification. It is worth mentioning that this pre-distortion can be applied once for all, at a rate that is negligible compared to that of the received signal. The complexity is hence low because of the short sequence and low rate refreshing calculation. In order to derive a closed-form expression of the cross-correlation, which allows the coarse CFO estimation, we neglect the additive noise term in (4). Eq. (7) can be re-written as
Dk
[ ]
n ≈ 1N − ke−j2π⋅fCFO⋅kTS
(
z*[
n + l]
z n + l − k[
]
)
⋅(
p l[ ]
p l − k[
]
*)
l=kN−1
∑
(8)where z is the received signal without AWGN, different from r in the CFO component, thus enabling to estimate the CFO. The SoF can then be estimated by
n! = argmaxn Dk
[ ]
n k=1 W∑
. (9)Based on (8), the coarse CFO can be estimated as follows
f!CFO= − 1W ∠2πkTDk
[ ]
ˆn S k=1 W∑
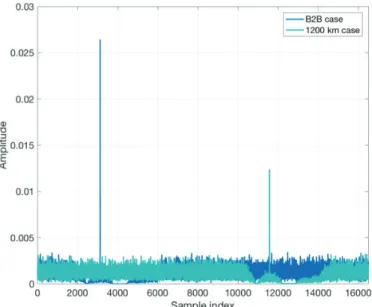
. (10)where ∠ is the angle operator. In our experiments, we set the training sequence length to 512 and the cross-correlation averaging window is 2. Fig. 4 presents experimental Fig. 4. Cross-correlation functions of the frame synchronization in the back-to-back configuration and after 1200 km transmission. The SoF corresponds to the peak maxima.
realizations of identification of the SoF in the back-to-back (B2B) and 1200 km transmission cases. In both cases, the peak corresponding to the SoF is clearly visible. After detecting the SoF, coarse CFO estimation is carried out using (10) with an estimation range of [−1/(2WTS), 1/(2WTS)]. Note
that, by using a periodogram, which can provide a better spectral resolution [18], the coarse CFO estimation accuracy can be further increased. As our purpose is to show the trade-off between the CD and PN compensation, a detailed comparison of the proposed frame synchronization method with others is skipped in this paper.
B. Chromatic Dispersion Compensation
After frame synchronization, which is carried out in the time-domain, the received signal is passed through the AFB block in order to process the signal in the frequency-domain.
The CD compensation method used here is similar to the one in [4, 19] that consists in using a finite impulse response (FIR) filter applied per subcarrier. The core idea of the filter design is based on the frequency sampling technique that is thoroughly analyzed in [19]. In principle, the equalizer coefficients are set so that the equalizer frequency response is forced to pass through some desired frequency points in the subchannel of interest. Based on the zero-forcing criterion, the equalizer frequency response can be derived at the corresponding points in frequency. Finally, we can deduce a FIR equalizer hm[n] by applying the inverse Fourier transform.
Although there are several CD compensation methods, as mentioned in [5], we choose this method as it provides a good performance at a moderate complexity. The equalizer is implemented based on the knowledge of the CD. As already stated, this is a reasonable assumption for many transmission systems, where a coarse estimate of the CD is known. Therefore, this stage acts as a coarse CD compensation. Any residual CD can be compensated at the channel equalizer stage.
C. Fine CFO Compensation and Channel Equalizer
Due to the fact that, after coarse CFO compensation, there remains a residual CFO, which is normally in the range of the subcarrier frequency spacing, i.e., less than 86 MHz (as detailed later in Section V), the phase noise tracking can only guarantee to compensate for laser phase noise, whose linewidth is less than 10 MHz [7]. In order to successfully demodulate the signal, we design the training sequences for fine CFO compensation in order to get the residual CFO in the operational range of the phase noise tracking.
Based on the design of the frame structure (Fig. 2), the second and the fourth FBMC symbols are used for fine CFO estimation. Note that, the third symbol is null to avoid any ISI. The two active symbols contain the same training symbol values on each sub-carrier m, for example, am,2 is equal to am,4.
Note that, the pilots are protected against ICI from adjacent symbols by inserting zeros surrounding it. Assuming that the PN φ in (6) is much smaller than the residual CFO, neglecting the additive noise term in (6) and multiplying the fourth symbol to the conjugate version of the second one, we can get
y!m=ym,2* ym,4 ≈ Hm*
(
am,2+jum,2)
* e−jπ 2Δf(
)
(
Hm(
am,4+jum,4)
ejπ 4Δf)
= Hm(
am,2+ jum,2)
2 ej2πΔf (11)The estimated residual CFO at the subcarrier level can be deduced by Δ!fm=
(
1 2π)
∠y!m. In order to reduce the effect ofthe additive white noise, we average the estimated residual CFO overall active pilot positions as follows
Δ!f = 1
2πQ ∠y"q0+2(m−1) m=1
Q
∑
(12)where Q is the number of active training symbols in one FBMC symbol (Q < M) and q0 is the first subcarrier index
containing the training symbol. The estimation range is Δ!f ∈ − F
[
s 4M ,Fs 4M)
. Once the residual CFO is estimatedand compensated in the time-domain (see Fig. 2), the channel estimation (CE) is carried out. Indeed, the CE can re-use the training symbols aiming at the fine CFO estimation. However, in order to clearly separate each stage of the signal processing, we assign the sixth FBMC symbol as the CE training symbols, whose value at the m-th subcarrier is bm,6 (Fig. 3). Similar to
the fine CFO training symbols, the CE training symbols are also alternated with the zero-symbols in order to reduce the ISI/ICI from adjacent symbols. From (6), the estimated channel (originating from the residual CD and other unknown response of the system) can be derived by
H!m = y " m,6 bm,6 (13) where
y!m,6 is the received symbol of the CE block after the
fine CFO compensation and m = q0+2(t−1) for t ∈ [1; Q−1].
The estimated channel value between two consecutive CE training symbols is linearly interpolated based on two adjacent derived estimated channel values. It should be noted that more zero-symbols could be inserted between the training symbols and the data symbols (instead of only one zero-FBMC symbol as in Fig. 3) in order to further remove the ICI between the pilots and the data. It is worth noticing that the channel equalization also compensates for the residual CD, which explains (as seen later in the experimental results) why with 1-tap equalizer we can propagate the signal for a longer distance than what was reported in [4].
D. Phase Noise Tracking
Several PN tracking methods have been proposed in the literature [6-13]. We are interested in blind feedforward PN compensation, as it does not require pilots that cause a reduction in spectral efficiency. Among blind PN compensation algorithms, despite its high computational effort, the modified-blind phase search (M-BPS) algorithm has
been shown to provide a better performance than the others [7], especially when the number of subcarriers is high. Even though the complexity of the M-BPS scales with the order of the modulation, it does not significantly influence the overall system complexity since the CD compensation block is by far the most complex DSP stage [20]. Therefore, we use the M-BPS method for our investigation. More details about this algorithm can be found in [7]. Note that, the phase noise tracking also compensates for the tiny remaining CFO.
V. EXPERIMENTAL SETUP
The goal is to assess the trade-off between the CD and PN compensation. Hence, in our experiments, we consider only one polarization in order to simplify our setup. Fig. 5 shows the overall experimental setup. The recirculating fiber loop is further detailed in Fig. 6. At the transmitter side, a random binary sequence is generated offline to build the FBMC/OQAM signal. A training sequence is appended in front of the frame. These signals are loaded into a high speed arbitrary waveform generator (AWG), which contains four 88 GS/s 6-bit digital-to-analog converters (DACs) [21].
The DACs impose to fix the sampling rate at 88 GS/s for the signal generation. The 88 GHz bandwidth is divided into many FBMC sub-carriers. In order to keep the pre-emphasis simple, we vary the subcarrier spacing (corresponding to a change of the number of subcarriers) and only activate the necessary number of subcarriers such that the signal bandwidth always occupies 20 GHz. For instance, the total DAC bandwidth is divided into 1024 sub-channels, such that the subcarrier spacing is about 86 MHz. We activate only 243 subcarriers surrounding the center frequency in order to create a 20.88 GHz FBMC/4−OQAM signal (equivalent 41.76 Gb/s signal). Note that, in order to facilitate reading in the
following text and figure legends, we use a number of active subcarriers of the form 2N, which is close to the real number of
active subcarriers, i.e., when 243 subcarriers of the FBMC signal are activated, we mention it as 256-subcarrier FBMC signal.
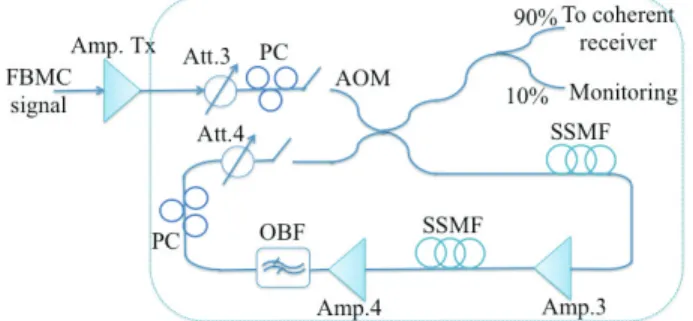
The digital signals modulate the optical carrier, originating from a continuous wave (CW) laser, by using an in-phase/quadrature (IQ) modulator. The laser wavelength is set to 1550 nm. Note that, the IQ modulator operates at the minimum bias point and the electrical signal amplitudes are adjusted so that the modulator is operated in the linear region of its transfer function. The modulated FBMC signal at the output of the IQ modulator is boosted by an optical erbium-doped fiber amplifier (EDFA), denoted by Amp. Tx. The output power is then attenuated using a variable optical attenuator (VOA), namely Att.3, in order to get the desired launching power. We are only interested in linear transmission impairments to evaluate the trade-off between CD and PN compensation. To this aim, we (without showing the results here) scan over several launching powers and search for the one with lowest bit-error-rate (BER). Finally, we select the launching power to be −4 dBm as the working value. The optical signal is launched into a recirculating fiber loop, consisting of two spans of 100 km of standard single mode fiber (SSMF), two inline EDFAs and an optical band-pass filter (OBF) of 1.6-nm bandwidth. The noise figure of each inline EDFA is about 6 dB. The attenuator Att.4 is tuned to keep the optical power equal after each loop. After passing the fiber loop, the signal is passed to another VOA (Att.1), followed by an EDFA (Amp.2) to adjust the optical signal-to-noise ratio (OSNR), which is measured in a 0.1 nm signal-to-noise bandwidth. Another OBF is used to reject the out-of-band amplified spontaneous emission (ASE) noise. The polarization controller at the receiver input is used to maximize the received signal on one polarization.
At the receiver side, the optical signal (S) is mixed with the local oscillator (LO) which is another CW laser of 10 dBm output power. Note that, the gain of the EDFA Amp.2 was adjusted in such a manner that the signal power at the input of the coherent receiver is held constant at −5 dBm. Both transmitter and receiver lasers have linewidths of about 100 kHz. The outputs of the 90° optical hybrid are detected by four balanced photodetectors. The output photocurrents are digitized using a 4-channel real-time digital sampling oscilloscope (DSO) of 100 GS/s sampling rate and 5-bit resolution [22]. Finally, the acquired digital signals are Fig. 5. Experimental setup. CW: continuous wave laser; Amp.: optical amplifier; AWG: arbitrary waveform generator; IQ mod.: in-phase/quadrature modulator; Att.: optical attenuator; DSO: digital sampling oscilloscope; OBF: optical band-pass filter; PC: polarization controller.
Fig. 6. Recirculating optical fiber loop. Amp.: optical amplifier; Att.: optical attenuator; OBF: optical band-pass filter; PC: polarization controller; SSMF: standard single-mode fiber; AOM: acousto-optic modulator.
resampled back to the DACs rate (88 GS/s), and processed offline for the digital receiver implementation. Note that, each FBMC frame contains about 20 000 data bit used for BER calculation and the BER is averaged over 5 acquisition frames.
VI. RESULTS AND DISCUSSION
The design of a 20-GHz FBMC transmission system based on 4−OQAM modulation is assessed in the presence of both CD and PN. The summed laser linewidth is about 200 kHz. Note that, this aggregated laser linewidth is utilized in our simulations in Section VII and the PN model is based on the Wiener process [23]. The CD equalizers have 1 or 3 taps. We investigate the suitable number of active subcarriers for the system. This number is varied in order to find the best trade-off between CD and PN compensation. It is worth noticing that the CD equalizers considered here with different number of taps are the static ones (the first block of the frequency processing in Fig. 2), which is different to the dynamic 1-tap channel equalization (the third block of the frequency processing in Fig. 2). Note that higher order OQAM constellations could be used. For instance, 16−OQAM modulation has been numerically investigated in [4] to assess the system performance in the presence of both CD and PN.
However, since we wish to validate the trade-off between PN and CD compensation, we limit ourselves to 4-OQAM modulation in the present experimental work. Indeed, for higher modulation orders, the limitation inherent to PN may be hidden by other effects, such as the limited resolution of the DAC/ADC.
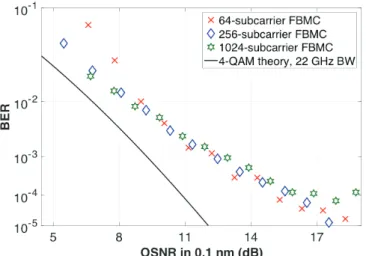
In order to make a benchmark of the experimental results in the absence of optical channel impairments, we first analyze the back-to-back (B2B) performance. Fig. 7 presents measured BERs as a function of the OSNR for different values of the number of subcarriers i.e., 64, 256 and 1024. At low OSNRs, a small number of subcarriers leads to poor BER performance, as the additive noise is dominant and the averaging operation of the M-BPS based PN compensation is less accurate. This explains why the BER when 64 subcarriers are used is higher than that when 256 and 1024 subcarriers are used. On the contrary at high SNRs, a larger number of subcarriers results in a longer FBMC symbol duration and the PN compensation is hence less effective, because the PN algorithm compensates only for the common phase error over an entire FBMC symbol. A likely origin of the error-floor observed when 1024 subcarriers are used could be the residual PN-induced inter-subcarrier interference. At moderate SNRs, all the considered numbers of subcarriers provide a similar BER performance.
In the next step, we consider only the 256-subcarrier FBMC transmission system using 1-tap and 3-tap CD equalizers. We investigate the OSNR penalty (compared to the B2B case) as a function of the transmission distance for maintaining the BER to 3.8×10⁻³ (corresponding to a hard-decision forward error
correction (FEC) limit [24]) in Fig. 8. As expected, the OSNR penalties increase with the propagation distance. We estimate the maximum transmission distance at 1 dB OSNR penalty, by the interpolation between the two points around the 1 dB penalty value. We find that the maximum transmission distances of 1-tap and 3-tap equalizers are 1300 km and 2900 km, respectively. This confirms the effectiveness of using a 3-tap CD equalizer over a 1-tap CD equalizer, at the cost of increasing the complexity [4]. Compared to our previous simulation results for 1-tap equalizer [4], it can be seen from Fig. 8 that in this experimental work we can transmit the signal further away, i.e., about two times Fig. 7. Back-to-back BER versus OSNR for FBMC/4-OQAM signal with
different number of subcarriers.
Fig. 8. OSNR penalty at a BER of 3.8×10⁻³ as a function of the transmission
distance using 1-tap and 3-tap equalizers for CD compensation when 256 subcarriers are considered.
Fig. 9. Maximum transmission distance versus number of subcarriers subjected to 1-dB OSNR penalty at a BER of 3.8×10⁻³ using 1-tap and 3-tap
extension of the transmission distance subject to 1-dB OSNR penalty at a BER of 3.8×10⁻³. This is due to the fact that, in
the present case, the pilot-aided channel compensation (Section III.C) much probably helps to compensate for the residual channel effect left from the static CD equalizer step.
We now investigate the maximum transmission distance for 1-tap and 3-tap equalizers versus the number of subcarriers under the constraint of a 1-dB OSNR penalty at a BER of 3.8×10⁻³ (Fig. 9). The same approach than in Fig. 8 was used
to extract the maximum distance at 1 dB OSNR penalty for each number of subcarriers and number of tap, as reported in Fig. 9. When the number of subcarriers is small, the compensation of CD is not fully efficient since the channel response is not flat enough at the subcarrier level. In this case, the 3-tap equalizer can help, increasing more than 2 times the transmission distance compared to the 1-tap equalizer for a number of subcarriers smaller than or equal to 256. The CD compensation is more effective when a higher number of subcarriers is used and the maximum transmission distance is hence increased; the distance is indeed improved by a factor of 10 from 64 to 1024 subcarriers in the 1-tap case. Finally, we observe that, in the current system configuration, with 1-tap equalizer, the transmission distance increases constantly with the number of subcarriers, whereas when applying 3-tap CD equalizers, the maximum transmission distance of 3100 km is achieved by using a 512-subcarrier FBMC system and slightly decreases with larger numbers of subcarriers. This can be explained by the fact that, in this case, PN becomes the dominant limitation. Consequently, with the considered link configuration, the optimum number of subcarriers are 1024 and 512 when using the 1-tap and 3-tap equalizers, respectively.
Relaxing the constraint about the FEC limit, we investigate the BER as a function of transmission distance when fixing the received signal power at −10 dBm in Fig. 10. The numbers of considered subcarriers are 64, 256 and 1024. The same observation as in Fig. 9 regarding the use of a larger number of taps in the equalizer depending on the number of subcarriers can be made. It can indeed be observed that a clear gain on the transmission distance can be achieved when increasing the number of equalizer taps from 1 to 7 for the
64-subcarrier FBMC system. While the 256-64-subcarrier FBMC system provides a moderate increase in the transmission distance when the number of equalizer taps varies from 1 to 3, no additional significant performance gain can be obtained in such a system by further increasing the number of equalizer taps from 3 to 7 (not shown in the plot). It can be observed that a 1-tap equalizer seems to be sufficient for the 1024-subcarrier FBMC system.
The slope difference for each number of subcarriers is worth to be noted. Interestingly, at short distance (for a BER of 2×10⁻⁴ typically), the 1024-subcarrier FBMC system shows
a maximum transmission distance much lower than the 256-subcarrier FBMC system and even the 64-256-subcarrier FBMC system with 3-tap and 7-tap equalizers. It is explained by the fact that the PN effect at this short distance becomes dominant over the CD effect and a large number of subcarriers is not advantageous anymore. This confirms again the trade-off between the CD and PN compensation found in our previous work [4]. The methodology gives us indications on how to optimize the transmission system based on the input parameters of laser linewidth, the number of equalizer taps (linked to the system complexity). Although our verification was carried out with FBMC/4−OQAM modulation within 20 GHz bandwidth, the same methodology can be applied to systems of higher bandwidth and higher modulation orders.
VII. DISCUSSION ON DAC/ADCLIMITED RESOLUTION In our experiment, we optimize the generated and received signals over the full-dynamic ranges of the DAC and ADC (the same approach has been followed by many previous works, for instance [3] and [25]). Furthermore, we modulate the electrical signal in the linear region of the IQ modulator transfer curve. Therefore, the impact of peak-to-average-power-ratio (PAPR) on the system performance is translated into the limitation of the DAC and ADC resolution.
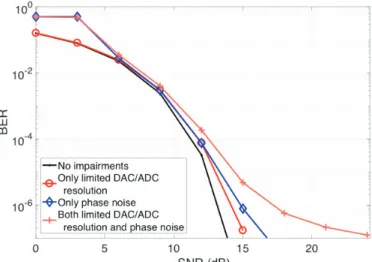
We numerically evaluate the limitation inherent to the PN and to the limited DAC/ADC resolution. Fig. 11 shows the BER as a function of the SNR in four cases: (1) No impairments (no PN and unlimited DAC/ADC resolution); (2)
500 1000 1500 2000 2500 3000 3500 4000 Transmission distance (km) 10-4 10-3 10-2 10-1 BER
64-subcarrier FBMC, 7-tap equalizer 256-subcarrier FBMC, 1-tap equalizer 256-subcarrier FBMC, 3-tap equalizer 1024-subcarrier FBMC, 1-tap equalizer 1024-subcarrier FBMC, 3-tap equalizer
Fig. 10. BER as a function of the transmission distance when the numbers of subcarriers are 64, 256 and 1024.
Fig. 11. BER as a function of SNR with impairments originating from PN and 5-bit DAC/ 6-bit ADC. The number of subcarriers is 256.
With only limited DAC/ADC resolution and no PN; (3) With PN of 200 kHz and no limited DAC/ADC resolution; (4) With both impairments. Note that, the number of bits of the DAC and ADC are set to 6 and 5 bits, respectively [21-22]. The number of subcarriers is set to 256. It can be seen that, at high SNRs, the BER of case (2) is lower than that of case (3), implying that the effect of PN is stronger than that originating from the limited DAC/ADC resolution. When the two impairments are present, the BER becomes worse. Note that, the same conclusions can be drawn for other numbers of subcarriers, but it is skipped here due to space constraint. The numerical results confirm again that the previously observed error floors obtained for measured BERs with a high number of subcarriers come mainly from the PN effect.
VIII. CONCLUSION
We have experimentally demonstrated the trade-off between CD and PN compensation in optical FBMC/OQAM systems. The previously proposed methodology for the transmission system design has been experimentally verified for a FBMC/4−OQAM signal occupying a 20-GHz bandwidth, about 200-kHz summed laser linewidth and 1- or 3-tap equalizers. The results showed that we could propagate the signal over a distance of 3100 km using 512 subcarriers and a 3-tap equalizer, subject to 1 dB OSNR penalty at a BER of 3.8×10⁻³. A frame structure and an integrated
synchronization/channel equalization architecture have also been proposed and validated to ensure the system works properly.
REFERENCES
[1] J. Fickers, A. Ghazisaeidi, M. Salsi, G. Charlet, P. Emplit, and F. Horlin, “Multicarrier offset-QAM for long-haul coherent optical communications,” IEEE/OSA J. Lightw. Technol., vol. 32, no. 24, pp. 4069-4076, Dec. 2014.
[2] F. Horlin, J. Fickers, P. Emplit, A. Bourdoux, and J. Louveaux, “Dual-polarization OFDM-OQAM for communications over optical fibers with coherent detection,” Opt. Express, vol. 21, no. 5 pp. 6409-6421, Mar. 2013.
[3] J. Zhao and P. D. Townsend, “Dispersion tolerance enhancement using an improved offset-QAM OFDM scheme,” Opt. Express, vol. 23, no. 13, pp. 17638-17652, Jun. 2015.
[4] T.-H. Nguyen, F. Rottenberg, S.-P. Gorza, J. Louveaux, and F. Horlin, “Efficient chromatic dispersion compensation and phase noise tracking for optical fiber FBMC/OQAM systems,” IEEE/OSA J. Lightw. Technol., vol. 35, no. 14, pp. 2909-2916, Jul. 2017.
[5] F. Rottenberg, T.-H. Nguyen, S.-P. Gorza, F. Horlin, and J. Louveaux, “Advanced chromatic dispersion compensation in optical fiber FBMC-OQAM systems,” IEEE Photon. J., vol. 9, no. 6, article # 7204710, Nov. 2017.
[6] A. Kakkavas, M. Castaneda, J. Luo, T. Laas, W. Xu, and J. A. Nossek, “FBMC-OQAM with phase noise: Achievable performance and compensation,” in Proc. SPAWC 2017, Sapporo, Japan, Jul. 2017. [7] T.-H. Nguyen, J. Louveaux, S.-P. Gorza, and F. Horlin, “Simple
feedforward carrier phase estimation for optical FBMC/OQAM systems,” IEEE Photon. Technol. Lett., vol. 28, no. 24, pp. 2823-2826, Nov. 2016. [8] J.-B. Dore, and V. Berg, “Blind phase tracking algorithm for FBMC
receivers,” in Proc. ISWCS 2015, Brussels, Belgium, Aug. 2015.
[9] A. A. Zaidi, et al., “Evaluation of waveforms for mobile radio communications above 6 GHz,” in Proc. Globecom Workshops, Washington, DC, USA, Dec. 2016.
[10] V. Moles-Cases, A. A. Zaidi, X. Chen, T. J. Oechtering, and R. Baldemair, “A comparison of OFDM, QAM-FBMC, and OQAM-FBMC
waveforms subject to phase noise,” in Proc. ICC 2017, Paris, France, Jul. 2017.
[11] T.-H. Nguyen, S.-P. Gorza, J. Louveaux, and F. Horlin, “Low-complexity blind phase search for filter bank multicarrier offset-QAM optical fiber systems,” in Proc. SPPcom 2016, Vancouver, Canada, Jul. 2016, p. SpW2G.2.
[12] T.-H. Nguyen, F. Rottenberg, S.-P. Gorza, J. Louveaux, and F. Horlin, “Extended Kalman filter for carrier phase recovery in optical filter bank multicarrier offset QAM systems,” in Proc. IEEE/OSA Optical Fiber Communication Conference (OFC), CA, USA, 2017, p. Th4C.3. [13] F. Rottenberg, T.-H. Nguyen, S.-P. Gorza, F. Horlin, and J. Louveaux,
“ML and MAP phase noise estimators for optical fiber FBMC-OQAM systems,” in Proc. IEEE International Conference on Communications (ICC), Paris, France, 2017.
[14] M. Bellanger, et al., “FBMC physical layer: a primer,” PHYDYAS project, 2010. Available: http://www.ict-phydyas.org.
[15] P. Siohan, C. Siclet, and N. Lacaille, “Analysis and design of OFDM/OQAM systems based on filterbank theory,” IEEE Trans. Signal Processing, vol. 50, no. 5, pp. 1170-1183, May 2002.
[16] T. Rappaport, Wireless communications: Principle and practice, 2nd
edition, Prentice-Hall, 2001.
[17] T. M. Schmidl, and D. C. Cox, “Robust frequency and timing synchronization for OFDM,” IEEE Trans. Commun., vol. 45, no. 12, pp. 1613-1621, Dec. 1997.
[18] T.-H. Nguyen, P. Scalart, M. Gay, L. Bramerie, C. Peucheret and M. Joindot, “Feedforward weighted-samples based carrier frequency offset compensation in optical coherent M-QAM systems,” in Proc. European Conference on Optical Communication (ECOC), Gothenburg, Sweden, 2017, p. P1.SC3.40.
[19] T. Ihalainen, A. Ikhlef, J. Louveaux, and M. Renfors, “Channel equalization for multi-antenna FBMC/OQAM receivers,” IEEE Trans. Veh. Technol., vol. 60, no. 5, pp. 2070-2085, Jun. 2011.
[20] M. Kuschnerov, T. Bex, and P. Kainzmaier, “Energy efficient digital signal processing,” in Proc. IEEE/OSA Optical Fiber Communication Conference (OFC), USA, 2014, p. Th3E.7.
[21] C. Schmidt, C. Kottke, V. Jungnickel, and R. Freund, “High-speed digital-to-analog converter concepts,” in Proc. SPIE 10130, Next-generation optical communication: Components, sub-systems, and systems VI, 101300N, Jan. 2017.
[22] Tektronix, “Scalable performance oscilloscopes: DPO70000SX series datasheet”. Link: https://www.tek.com/datasheet/scalable-performance-oscilloscopes.
[23] E. Vanin, and G. Jacobsen, “Analytical estimation of laser phase noise induced BER floor in coherent receiver with digital signal processing,” Opt. Express, vol. 18, no. 5, pp. 4246-4259, Feb. 2010.
[24] A. Leven, F. Vacondio, L. Schmalen, S. T. Brink, and W. Idler, “Estimation of soft FEC performance in optical transmission experiments,” IEEE Photon. Technol. Lett., vol. 23, no. 20, pp. 1547-1549, Oct. 2011.
[25] P. Poggiolini, A. Nespola, Y. Jiang, G. Bosco, A. Carena, L. Bertignono, S. M. Bilal, S. Abrate, and F. Forghieri, “Analytical and experimental results on system maximum reach increase through symbol rate optimization,” IEEE/OSA J. Lightw. Technol., vol. 34, no. 8, pp. 1872-1885, Apr. 2016.