Université de Montréal
Physical Activity and Screen Time Trajectories in
Adolescents
par Teodora Riglea
Département de médecine sociale et préventive École de santé sublique de l’Université de Montréal
Mémoire présenté
en vue de l’obtention du grade de Maîtrise en Épidémiologie
Août 2019
Université de Montréal
Département de médecine sociale et préventive, École de santé publique de l’Université de Montréal
____________________________________________________________________________
Ce mémoire intitulé
Physical Activity and Screen Time Trajectories in Adolescents
Présenté par Teodora Riglea
A été évalué par un jury composé des personnes suivantes
Bernard-Simon Leclerc Président-rapporteur Jennifer O’Loughlin Directeur de recherche Marie-Pierre Sylvestre Codirecteur de recherche Marie-Hélène Mayrand Membre du jury
i
Résumé
Introduction : Seulement 7% des Canadiens de 17 ans et moins pratiquent 60 minutes d’activité physique modérée à vigoureuse quotidiennement. La majorité dépasse le temps d’écran quotidien recommandé de deux heures. Plusieurs études transversales indiquent que les deux comportements évoluent indépendamment et ne seraient que faiblement corrélés. Objectifs et hypothèses : Les objectifs de ce mémoire est d’identifier des trajectoires
d’activité physique et des trajectoires de temps devant l’écran durant l’adolescence, par sexe, et de décrire la distribution des individus selon l’appartenance simultanée aux deux
trajectoires. Nos hypothèses stipulent que des trajectoires différentes seront observées pour les deux sexes et que les deux comportements ne s’influenceront pas.
Méthodes : Les données proviennent d’une étude prospective de 1294 adolescents de la région de Montréal, recrutés en 1999 à l’âge de 12-13 ans. Des questionnaires ont été remplis en classe à chaque 3 mois, de la première à la cinquième année du secondaire. Des
modélisations de trajectoires de groupe ont identifié des trajectoires d’activité physique et de temps devant l’écran. Une modélisation de trajectoires jointes a rapporté des probabilités d’appartenance aux trajectoires des deux variables.
Résultats : Cinq groupes ont été identifiés pour les trajectoires d’activité physique pour les deux sexes. Quatre groupes ont été identifiés pour les garçons et 5 pour les filles concernant le temps passé devant l’écran. 57% des garçons et 46% des filles ont fait des activités physiques pendant 6-7 jours par semaine, durant toute l’adolescence. Toutes les trajectoires de temps devant l’écran accumulent plus de deux heures d’écran quotidiennement. Les probabilités conditionnelles suggèrent une relation entre l’activité physique et le temps devant l’écran. Conclusion : Le développement de l’activité physique et du temps devant l’écran est hétérogène durant l’adolescence. Leur coévolution doit être prise en compte par les professionnels en santé publique.
Mots-clés : Activité physique, temps devant l’écran, comportements sédentaires, adolescence, modélisation de trajectoires, études longitudinales
ii
Abstract
Introduction: Only 7% of Canadians age ≤ 17 years engage in the recommended 60 minutes or more of moderate-to-vigorous physical activity (PA) daily. Further, most youth surpass the recommended screen time maximum of 2-hours daily. Many cross-sectional studies suggest that PA and screen time are only weakly correlated and that they evolve independently. Objectives and hypotheses: The first objective of this MSc thesis was to model PA and screen time trajectories during adolescence, in boys and girls. The second objective was to describe the distribution of participants according to concurrent membership in the two sets of trajectories. Our hypotheses were that trajectories differ by sex and that PA trajectories are independent of screen time trajectories.
Methods: Data were drawn from an ongoing longitudinal study of 1294 adolescents age 12-13 years recruited in 1999-2000 in 10 Montreal-area high schools. Self-report questionnaires were completed during class time, every 3 months from grade 7 to 11. Group-based trajectory modeling identified PA and screen time trajectories. Joint trajectory models provided
membership probabilities in both PA and screen time trajectories.
Results: Five groups of PA trajectories were identified in both sexes. Four and five screen time trajectory groups were identified in boys and girls, respectively. Half (57%) of boys and 46% of girls engaged in PA 6-7 days weekly during the entire 5-year follow-up. All screen time trajectories were above the recommended 2-hours daily. Conditional probabilities suggested weak associations between PA and screen time.
Conclusion: Patterns of PA and screen time are heterogeneous during adolescence. Their co-evolution may need to be considered by public health practitioners.
Keywords: physical activity, screen time, sedentary behaviours, adolescence, trajectory modeling, longitudinal studies
iii
Table of Contents
Résumé ... i
Abstract ... ii
Table of Contents ... iii
Tables List ... vi
Figures ... vii
Abbreviations ... viii
Acknowledgements ... ix
Chapter 1: Introduction ... 1
1.1 Early Determinants of Chronic Disease ... 1
1.2 Physical Activity and Sedentary Behaviour in Childhood ... 1
1.3 Purpose ... 2
Chapter 2: Literature Review ... 3
2.1 Physical Activity ... 3
2.1.1 Definition ... 3
2.1.2 Components of Physical Activity ... 4
2.1.3 Current Physical Activity Guidelines for Youth ... 4
2.1.4 Physical Inactivity in Children ... 5
2.1.5 Measurement of Physical Activity ... 6
2.2 Sedentary Behaviour ... 8
2.2.1 Definition and Distinction from Physical Inactivity ... 8
2.2.2 Components of Sedentary Behaviour ... 10
2.2.3 Current Screen time Guidelines for Youth ... 10
2.2.4 Sedentary Behaviour in Children ... 11
2.2.5 Measurement of Sedentary Behaviour ... 11
2.3 Association Between Sedentary Behaviour and Physical Activity ... 13
2.3.1 Current State of the Literature ... 13
2.3.2 Gaps in Knowledge ... 15
2.4 Group-Based Trajectory Modeling (GBTM) ... 15
iv
Chapter 3: Objectives and Hypotheses ... 18
Chapter 4: Methods ... 19
4.1 Data source: NDIT Study ... 19
4.1.1 Study Design and Sampling ... 19
4.1.2 Study Variables ... 22
4.2 Analytical Sample and Attrition ... 24
4.3 Data Analysis ... 26
4.3.1 GBTM ... 26
4.4 Ethical Considerations ... 29
Chapter 5: Results ... 30
5.1 Manuscript Presentation and Contribution ... 30
5.2 Manuscript ... 31
5.3 Additional Results ... 57
5.3.1 Trajectory Selection ... 57
5.3.1.1 PA Trajectories in Boys ... 57
5.3.1.2 Screen Time Trajectories in Boys ... 58
5.3.1.3 PA Trajectories in Girls ... 59
5.3.1.4 Screen Time Trajectories in Girls ... 59
5.3.2 Sensitivity Analyses: Seasonality ... 60
Chapter 6: Discussion ... 63
6.1 Summary and Interpretation of Findings ... 63
6.1.1 Physical Activity and Screen Time Trajectories ... 63
6.1.2 Joint Trajectory Modeling ... 64
6.2 Strengths and Limitations ... 65
6.2.1 NDIT ... 65
6.2.2. Group-Based Trajectory Modeling ... 66
6.2.3 Self-Report Questionnaires ... 68
6.3 Implications ... 68
6.4 Future Directions ... 69
Chapter 7: Conclusion ... 70
v
Appendix A: NDIT Parental Consent Form ... i ... ii Appendix B: Original Ethics Approval of the NDIT Study ... iii Appendix C: Histograms of the “Number of days active weekly” Variable in Cycle 1 and 20, Boys and Girls, NDIT 1999-2005 ... iv Appendix D: Histograms of the ‘Weekly Screen Time’ Variable in Cycle 1 and 20, Boys and Girls, NDIT 1999-2005 ... v Appendix E: Items from the Guidelines for Reporting on Latent Trajectory Studies Checklist addressed in the current study, NDIT 1999-2005. ... vi Appendix F: Supplementary Materials ... viii
vi
Tables List
Table 1. Dates when the first and last school were surveyed at each survey cycle and the within-survey time range. ... 21 Table 2. 7-day Physical Activity Recall Checklist, NDIT 1999-2005 ... 22 Table 3. Number of observations missing in each cycle among eligible participants ... 25 Table 4. Baseline (cycle 1) characteristics of included and excluded participants, NDIT 1999-2000 ... 26 Table 5. Average Posterior Probabilities (APP) by PA trajectory for the final model (boys), NDIT 1999-2005 ... 58 Table 6. Average Posterior Probabilities (APP) by screen time trajectory for the final model (boys) ... 58 Table 7. Average Posterior Probabilities (APP) by PA trajectory for final model (girls) ... 59 Table 8. Average Posterior Probabilities (APP) by screen time trajectory for final model (girls) ... 60
vii
Figures
Figure 1. Conceptual model of movement-based terminology based on a 24-hour period. ... 9 Figure 2. NDIT data collection cycles, 1999 to 2019 ... 20 Figure 3. Mean values of number of days active weekly (top) and screen time (bottom)
viii
Abbreviations
GBTM: Group-Based Trajectory Modeling ICC: Intraclass correlation
MET: Metabolic equivalent
MVPA: Moderate-to-vigorous physical activity NDIT: The Nicotine Dependence in Teens study PA: Physical activity
SBRN: Sedentary Behavior Research Network WHO: World Health Organisation
ix
Acknowledgements
I am extremely grateful for all the support and assistance I have received throughout the preparation of this thesis.
First, a sincere thank you to Dr. Jennifer O’Loughlin and Dr. Marie-Pierre Sylvestre. You have welcomed me in your team with arms wide open and have given me enormous support all along my studies. I am very lucky to have met such smart and driven women that set an immense example for a young person like myself of where hard work can lead you. Without your help this thesis would not have been possible. Thank you for all the
opportunities you have given me.
Second, I would like to thank all the professors and staff at the École de Santé Publique de Montréal for providing top quality teaching to your students. You have given me the
knowledge, the skills, and opportunities necessary to succeed during and beyond my time in the Master’s program. Thank you as well for your financial support with the bursaries provided to me and other students.
Third, I would like to acknowledge all the students and staff in our research team at the CRCHUM that provide a stimulating environment for sharing my work and helping me
improve. A special thank you to Erika Dugas for always being available for my ongoing questions.
Fourth, all my gratitude goes to the participants of the NDIT study and their families. Over the last 20 years, you have been part of a ground-breaking study that radiated around the world and continues to do so. Your contribution to science and public health is unmeasurable.
Fifth, to my Midnight Ladies (Anissa, Cloé, Elena, Emily) and all my friends, thank you for all the cheers and the never-ending support. The biggest thank you to Guillaume. I cannot acknowledge enough the support, the laughs, and the encouragements you provided throughout the production of this thesis.
Lastly, thank you to my parents. You are my biggest cheerleaders in everything I do. Your unconditional love and support have brought me to where I am today. A final thanks you to my family in Romania who endlessly cheer on me from far away.
1
Chapter 1: Introduction
Noncommunicable or chronic disease is a major public health challenge worldwide. In 2012, chronic diseases were responsible for 68% of all deaths, with close to half being
premature deaths under age 70 years (1). In 2016, 7 of the 10 leading causes of death in Canada were chronic diseases (2) including malignant neoplasms, heart disease and diabetes mellitus. Most premature noncommunicable diseases are preventable (1) through action on three modifiable risk factors including physical inactivity, unhealthy diet, and tobacco use (3), and research over many decades has demonstrated that these risk factors often manifest early in life during childhood or adolescence.
1.1 Early Determinants of Chronic Disease
Adolescent health lays the foundations for adult health. It is estimated that at least 70% of premature adult deaths are linked to behaviours initiated and reinforced during adolescence (4), and adolescence is increasingly viewed as a critical phase in the life course for achieving lifelong health potential (5). During adolescence, an individual acquires the physical, cognitive and social fundamentals for lifelong health and well-being. However it is also a period during which poor lifestyle habits can be acquired and consolidate, and associated health problems begin to emerge (5). While risk behaviours manifest during adolescence, they may still be amenable to change with appropriate interventions and favorable built environments (6). It is generally accepted that public health interventions to prevent unhealthy lifestyle behaviors, should be implemented early in the life course, before these behaviors become entrenched.
1.2 Physical Activity and Sedentary Behaviour in Childhood
A small number of common modifiable risk factors are responsible for most chronic diseases (3). In 2009, the World Health Organization (WHO) identified that physical inactivity is responsible for increasing the risk of chronic disease, and that it is the fourth leading risk for mortality globally. Physical activity (PA) has been studied extensively over the last 60 years, and evidence of its positive influence on health is irrefutable (7, 8). Scientific reports have
2
repeatedly shown that most youth are not sufficiently active, and that more than half of their waking hours are spent in sedentary behaviours such as watching television and playing on the computer (9, 10). It is now well-established that sedentary behaviours are associated with poor health (11-13) in both adults and youth (14), and it is becoming increasingly recognized as distinct from PA. Although promising in terms of shedding light on chronic disease
prevention, the link between PA and sedentary behaviour in youth is not well-understood.
1.3 Purpose
The purpose of this thesis is to describe the natural course of PA and screen time (as a proxy measure of sedentary behaviour) during adolescence. This will be accomplished using Group-Based Trajectory Modeling (GBTM) of data drawn from an ongoing 20-year
longitudinal study of adolescents. This thesis includes seven chapters. Chapter 2 presents a comprehensive literature review on existing knowledge on PA and screen time. Chapter 3 describes the specific objectives of this research and related hypotheses. Chapter 4 describes the adolescent sample from which the data were drawn (i.e., the NDIT (Nicotine Dependence in Teens) study). Results are presented in manuscript format in Chapter 5. Chapter 6 presents an in-depth discussion of the results and Chapter 7 concludes the thesis.
3
Chapter 2: Literature Review
This chapter presents an overview of the literature pertaining to the research project and its objectives. First, it will detail the current state of the knowledge on PA, beginning with its definition, components, and current guidelines in youth. Then, the epidemiology of
physical inactivity in children will be described, including a depiction of risk factors for physical inactivity and its impact on health. Third, it will detail current knowledge on
sedentary behaviours such as screen time. The association between PA and screen time will be examined and finally, the methodology for group-based trajectory modeling (GBTM) and its relevance to this research study will be described.
2.1 Physical Activity
2.1.1 Definition
According to the World Health Organization, PA is defined as any bodily movement produced by skeletal muscles that requires energy expenditure, which can be measured in kilojoules or, more commonly, in kilocalories (15). Although often used interchangeably in the literature, the term “exercise” is defined as a subset of PA that is planned, structured, and repetitive, and that aims to improve or maintain one or more components of “physical fitness” (16). “Physical fitness” is also not synonymous with PA - it is a set of attributes that people have or achieve (16). Thus, PA is any type of movement and every person engages in PA during their daily life. However, the amount of PA engaged in is subject to personal choice. It is influenced by numerous environmental and social factors and thus can vary substantially across individuals and over time. (16).
4
2.1.2 Components of Physical Activity
PA is a complex behaviour that can be categorized and measured in different ways. Four dimensions have been identified as relevant in describing PA including:
i) Type: Mode of PA participation, which can take many forms (strength, aerobic, flexibility, etc.) (7).
ii) Duration: Length of time the activity is performed, generally expressed in minutes (7). iii) Frequency: Number of times during a certain time period the activity is performed (7). iv) Intensity: Rate at which the activity is performed, or the effort required to perform the
activity (7). PA intensity categories are based on metabolic equivalents (METs), which are multiples of resting metabolic rate (17). A low intensity PA is one of less than 3 METs, a moderate intensity PA is of 3 to 6 METs, and a vigorous intensity PA is one above 6 METs (18).
These dimensions are all important in formulating recommendations and guidelines for PA at a population level. For example, participation in different types of PA targeting
endurance, flexibility and strength is important in achieving optimal health (19). Observational studies also demonstrate a dose-response relationship between PA levels and health -
differences in health risks are observed between groups of individuals varying from least to most fit (19).
2.1.3 Current Physical Activity Guidelines for Youth
Burgeoning understanding of the impact of PA on health has fuelled development of guidelines and recommendations by different entities across the world. In 2002 at the 57th
World Health Assembly of the WHO, growing concerns about non-communicable disease and shifts in the prevalence of chronic disease were translated into formal statements. The
Organization urged state members to develop, implement, and evaluate actions that promote individual and community health through healthy diet and PA (8). Countries and legal entities followed shortly thereafter with guidelines and recommendations on PA and active living;
5
initially, most focused on adults since children and adolescents were viewed as healthier and naturally more active than adults (20).
In 2005, a systematic review of the literature sponsored by the U.S. Centers for
Disease Control and Prevention and undertaken by a multidisciplinary expert panel, concluded that school-age youth should engage in 60 minutes or more of moderate to vigorous PA
(MVPA) daily that is developmentally appropriate and enjoyable (21). A second systematic review in 2008 by the U.S. Department of Health and Human Services made the same recommendation based on substantial data indicating that important health benefits can be attained when children and youth participate in 60 or more minutes of MVPA daily (22).
In 2016, the Canadian Society for Exercise Physiology released the Canadian 24-hour movement guidelines, which is the first evidence-based set of guidelines to address movement during an entire day (23). Age-specific recommendations are presented for the early years (age 0-4 years), children and youth (5-17), young and middle-aged adults (18-64), and for older adults (65 or older). Once again, children and adolescents between ages 5 and 17 are
encouraged to accumulate at least 60 minutes of MVPA daily, involving a variety of aerobic activities. The guidelines also suggest that vigorous PA as well as muscle and bone
strengthening activities should each be engaged in at least 3 days weekly (23).
2.1.4 Physical Inactivity in Children
Physical inactivity is the 4th leading cause of death accounting for more than 3 million
preventable deaths worldwide (24). The Global School-Based Student Health Survey obtained estimates from 105 countries and showed that 80% of 13-15-year-olds do not accumulate 60 minutes of MVPA daily and that girls are less active than boys (25).
Since 2007, the Canadian Health Measures Survey has collected data using objective PA measures in Canadian youth. During its first cycle of data collection from 2007-09, only 7% of children and adolescents met the recommended 60 minutes of MVPA daily on at least 6 of 7 days weekly, although 33% achieved a weekly average of 60 minutes daily (26). A newer
6
study in which the 2nd and 3rd waves of data collection were combined to examine levels of PA
in youth from 2009-13, showed that 36% of children and youth met the daily 60-minute MVPA recommendations from the Canadian 24-Hour Movement Guidelines for Children and Youth (9). Almost half (47.6%) of children age 5-11 met the recommendations, compared to only 24.4% of youth age 12-17. Almost double the percentage of boys met the
recommendations compared to girls (46.8% vs. 24.6%) (9). The new guidelines allow for normal day-to-day variation in PA levels by using average daily MVPA, and not setting a threshold of 60 minutes of MVPA on at least 6 days of the week (23).
In Québec in 2013-14, 44% of youth age 12-17 years attained the recommended leisure PA recommendations (51% of boys vs. 35% of girls). Since 1994, only girls made gains in PA time daily (10). PA levels in Québec are comparable to those in Ontario and the Prairies, but greater than those in the Atlantic provinces (10).
Low levels of PA throughout life increase the risk of numerous diseases including diabetes mellitus, hypertension, coronary artery disease, stroke, osteoporosis, and certain cancers (27). Attaining and maintaining recommended PA levels in youth improves physical and mental health (10) in the short- and long-term (19, 28). The evidence is strong for the many beneficial effects of PA during childhood and adolescence, including effects on
musculoskeletal and cardiovascular health, adiposity in overweight youth and blood pressure regulation (21).
2.1.5 Measurement of Physical Activity
High-quality exposure assessments are essential to identify associations, to quantify the magnitude of observed associations and to describe dose-response relationships, when appropriate (29). Studies of PA need valid, feasible, and reliable measures (30). The most practical and appropriate measure of PA and PA patterns is direct observation (31). Validation studies comparing direct observation scores with heart rate or oxygen consumption show correlations that range from r = 0.61 to 0.91 and these techniques attain satisfactory levels of inter-observer agreement (31). However, the heavy response burden, the high cost and the
7
potential reactivity of study participants make this a less feasible method in population-based studies (30).
Objective techniques to measure PA include heart rate monitors, pedometers, and accelerometers (31). With these objective measures, PA should ideally be measured for a period of time representative of habitual activity level, with minimal discomfort to the participant, and using a low-cost system allowing it to be implemented in large-scale studies (32). Heart rate monitors rely on the relationship between heart rate and oxygen consumption (VO2). However, this relationship is not robust at low PA levels (31). Also, a variety of
psychological and environmental factors can influence heart rate and affect the results. Pedometers are electronic devices used to estimate mileage or number of steps walked over a period of time (31). They permit estimating distances walked, energy expended in movement, and activity intensity (33). Pedometers are estimated to be 97% accurate in counting steps, but are less accurate in estimating distances and even less so for energy expenditure (33).
Accelerometers assess bodily motion resulting from movement and PA (33). Worn on the waist, they are designed to measure ambulatory activity. They continually (i.e., each second or each minute) record accelerations and transform them into a signal referred to as “counts” (31). Accelerometers can measure accelerations in a single (i.e., vertical) plane or in three planes of movement (i.e., vertical, horizontal, and lateral) (33). The advantage of
accelerometers is that they continuously record movement and lack of movement, providing a detailed output of daily activity intensity (33). The monitors are small and unobtrusive, making them comfortable to wear. They are also re-useable (31). However, one of the main limitations is that they cannot identify the type of PA performed or provide any descriptive information about the activity (32). Wear time per day in children is usually less than 24h, because compliance with wearing the accelerometer is affected by the size, shape, attachment method, site of attachment as well as instructions for use (34).
Subjective techniques for estimating PA rely on responses either directly from the child or indirectly from a proxy respondent such as a parent or teacher. They rely on an individual’s ability to recall their activities over a set period of time and/or they record in
real-8
time, activities throughout the day (33). These self-report instruments are inexpensive, easy to administer, and provide information about PA type, duration, and context (33). Self-report, including diaries, standardized written questionnaires and structured interviews, is typically the method of choice with older children because of its low cost (17). PA logbooks or diaries are used by the participant to keep a record of all activities as they are occurring and to record details on the type and duration of activities during a defined period of time (33). However, these subjective measurements are prone to recall error, deliberate misrepresentation and other biases that have been shown to occur with children (31). Very young children may not be able to complete diaries themselves, but adolescents have better cognitive abilities. Questionnaires administered by trained interviewers may improve the accuracy of data provided by children, but the physical presence of an interviewer could influence the responses (31). Proxy-reports of children’s PA provided by a parent or teacher avoid errors related to children’s cognitive limitations, but validation studies suggest that parents do not always provide accurate assessments of the PA levels of their children (31).
As discussed above, a variety of measurement methods exist to assess PA levels and no one method is perfect. Evidence of validity and reliability exists for several instruments, but each method has pros and cons and all need to be continually improved to create accurate assessments of PA.
2.2 Sedentary Behaviour
2.2.1 Definition and Distinction from Physical Inactivity
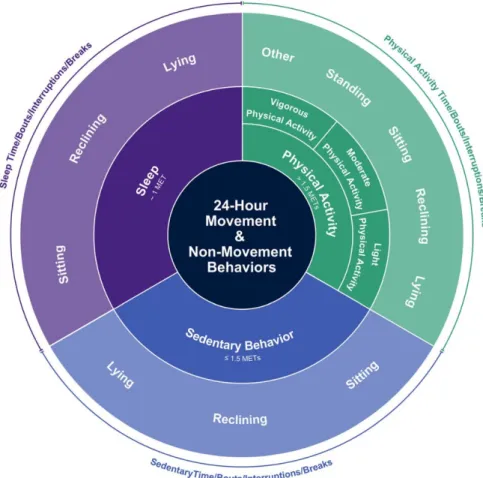
While PA has been investigated over the last 60 years, interest in sedentary time and sedentary behaviours has developed in the last ten years only (35). In 2017, the Sedentary Behavior Research Network (SBRN) reached consensus on an appropriate definition of sedentary behaviour as any waking behavior characterized by an energy expenditure < 1.5 METs while in a sitting, reclining or lying posture (35). This definition incorporates both energy expenditure and posture. Some researchers suggest that unique considerations are needed in assessing energy expenditure in youth, especially in younger children (36).
9
However, one study with whole-room calorimetry measures of 40 young children (mean age: 5.3 years) demonstrated that common sedentary activities in children are consistent with this recent consensus definition (37). In 2012, the SBRN suggested in a letter to the editor that, in order to avoid confusion and inappropriate use of the terms, “physical inactivity” be used specifically to describe individuals who do not undertake sufficient amounts of MVPA and do not meet current recommendations. This comment started the movement towards considering PA and sedentary behaviours as distinct entities. These new definitions are incorporated into a new conceptual model of movement-based terminology arranged around a 24-hour period (23) (Figure 1). The association between sedentary behaviors and PA is described in Section 2.3.
10
2.2.2 Components of Sedentary Behaviour
Behaviors classified as sedentary include computer use, watching television, playing video games, driving, reading, socializing, work, and public transport (33). A recent study on 1513 children age 10 years showed that boys spent 57% and girls spent 44% of their reported sedentary time in screen-based sedentary behaviours (38). A second study with older children (ages 13-14 years) showed that the most common sedentary activities for boys were (in order of weekly time): TV-viewing; homework; playing computer/video games; motorised
transport; and behavioural hobbies (e.g., playing a musical instrument) (39). The most
common sedentary activities for girls were (in order of weekly time): TV-viewing; homework; motorised transport; sitting and talking; and shopping/hanging out in town (39). Sedentary pursuits occur in a sporadic and widely varied manner throughout the day, making it difficult to measure and characterize (40). Researchers generally rely on global or proxy measures (i.e., car time, sitting time, indoor time, screen time) to capture sedentary behaviours (40). School-based sedentary behaviours and activities such as homework or transport have little flexibility in terms of potential modification (38). From a health promotion perspective, a focus on screen-based leisure-time sedentary behaviours may be appropriate because it is more amenable to intervention (38).
2.2.3 Current Screen time Guidelines for Youth
In 2010, the contribution of sedentary behaviours to disease risk was recognized as a research gap by the WHO in their global recommendations on PA for health (7). Until then, public health agencies worldwide focused solely on PA recommendations and interventions even though evidence suggesting sedentary behaviours may have profound independent effects on health was accumulating (41). In 2011, Canada released the first evidence-based sedentary behaviour guidelines for children and youth in the world, based on an extensive literature review (41), and many other countries followed shortly thereafter. In 2016, the Canadian 24-hour Movement Guidelines for Children and Youth updated its recommendations and suggested engaging in no more than 2-hours of recreational screen time daily and limiting sitting for extended periods (23).
11
2.2.4 Sedentary Behaviour in Children
At the time of implementation of the Canadian 24-hour Movement Guidelines for Children and Youth in 2016, it was estimated that only 49.3% of Canadian children age 5 to 17 met the screen time recommendations of 2-hours maximum daily (9). Boys accumulate more screen time daily than girls (9). The Canadian Health Measures Survey estimates that youth spend 8.5 hours sedentary every day (42). In Québec, adolescents age 12-17 spend 9 hours daily in sedentary activities including watching television and using electronic devices (10).
In both cross-sectional and longitudinal studies, sedentary behaviours (as distinct from physical inactivity) influence body weight in children. A study using data from the NDIT (Nicotine Dependence in Teens) study (i.e., the same dataset used in this current thesis) showed that even low levels of screen time increase the risk of a higher percent body fat if screen time increases during adolescence. However, the risk decreases if screen time decreases over time, suggesting a potential for positive effects of intervention during adolescence (43). In a systematic review of all studies examining relationship between sedentary behaviours and health outcomes in children and youth (5-17 years of age), watching TV for more than 2-hours daily was associated with unfavorable body composition, decreased fitness, lower scores for self-esteem and pro-social behaviour, and decreased academic achievement (44). Another review incorporating both cross-sectional and longitudinal studies reported that too much sedentary time is associated with obesity in youth, insulin sensitivity, clustered metabolic risk, and lower cardio-respiratory fitness in youth, but not with impaired lipid profiles or increased blood pressure (11).
2.2.5 Measurement of Sedentary Behaviour
Methods of assessing sedentary behaviours are similar to those for PA and can be categorized into subjective and objective measures (29). Subjective methods of measuring screen time document these activities in self-reports (29). Questionnaires are the most
12
in telephone interviews, or data can be collected in diaries. Self-report questionnaires
measuring screen time have focused primarily on TV-viewing, but rarely report the validity or reliability of the measures (45). Diaries can be used to obtain more detailed assessment of sedentary behaviours and to capture its multi-faceted nature (29). These subjective methods have the same advantages and limitations as those described above for PA.
More recent studies now include multiple screen-based activities (i.e., computer use, time spent playing video games) which reflect the ever-changing nature of digital media and technology (46). One study examining the convergent construct validity of two self-report measures of sitting time against accelerometer-measured screen time suggested that a single-item measure (i.e., TV time alone) underestimates total sitting time compared to a domain-specific questionnaire (47), and that the estimation of total sitting time is improved by
summing times across different domains (47). There are also reports suggesting that adults and children recall screen activities better on weekdays than weekends, which may relate to greater variability in activity patterns on weekend days (29). Gunnell et al. examined whether screen time assessments that change over time (i.e., researchers modify indicators to include new screen-based devices in more recent data collections) to reflect technological advancements, accurately measure screen time (46). The team demonstrated that across data collections spanning 4 years, 76% of screen time indicators had similar meaning, were answered on similar metrics (i.e., participants responded similarly to the response scales across cycles), and had similar sources of error (46). They concluded that screen time can be measured across time despite changes in the indicators.
As described above, accelerometers are widely used to objectively measure PA and are more and more frequently used to measure sedentary behaviours. Sedentary behaviours can be studied through the accumulation of low movement counts at pre-determined cut points by the accelerometer (29). One study examining the minimum number of days of accelerometer monitoring needed to estimate PA and sedentary behaviours in children, reported that three days of monitoring yielded 73% reliability in the estimates (48). Studies often include at least one weekend day in accelerometer monitoring (48).
13
2.3 Association Between Sedentary Behaviour and Physical
Activity
2.3.1 Current State of the Literature
Prior to creation of a formal definition by the SBRN and recent sedentary behaviour research, it was common to classify an individual as ‘sedentary’ when he/she had low PA levels. It was assumed (with little evidence) that PA and sedentary behaviour had an inverse and causal relationship. In 2000, Owen et al. were among the first to suggest that sedentary behaviours such as screen time can coexist, but also compete with PA. They described the importance of exploring sedentary behaviour as a unique attribute (49).
In 2002, Marshall et al. examined this relationship by investigating clustering of activities among children age 11 to 15 (50). They observed that the correlation between
sedentary behaviours and PA was small and positive (r = 0.22). Disputing the assumptions that they are inversely related and confirming Owen’s claims, two of the three clusters included youth who were sufficiently physically active, but who were also dependent on technology-based entertainment such as TV-viewing and computer use, especially in boys. In addition, youth reporting low levels of PA also reported low sedentary behaviour levels. These and other studies (51, 52) do not support the tenets of the ‘displacement hypothesis’, which claims that TV time is directly related to time spent in other activities including PA (i.e., the more time spent watching TV, the less time a person will devote to other activities such as PA).
Several other studies only partially confirm the claims of the ‘displacement hypothesis’. A meta-analysis of 163 articles (over 80% of which were cross-sectional)
examined the association between sedentary behaviour and PA in children and adolescents and reported a small but significant negative association between the two variables. Although the direction of the association is consistent with the ‘displacement hypothesis’, its small
magnitude does not support the premise that activities are substituted (53). This result is also contrary to those of Marshall et al. (50), who reported a positive correlation between sedentary behaviours and PA. A recent review of published studies on sedentary behaviours among
14
adolescents and its influence on body composition did not find any evidence suggesting that sedentary behaviour displaces PA (54).
Because sedentary behaviours and PA coexist in adolescents (i.e., both high, both low, any other combination of levels) but are only weakly correlated, the question arises as to whether these behaviours have independent effects on health. Studies show inconsistent results. A systematic review including all study types (observational studies, randomized controlled trials and other intervention studies) examining how different levels of PA, sedentary time, and sleep were related to health indicators in children and youth age 5 to 17 suggested that the optimal combination in regard to adiposity and cardiometabolic health was high PA/high sleep/low sedentary behaviour (55). The most injurious combination was low PA/low sleep/high sedentary behaviour. High PA/low sedentary behaviour was associated with better health compared to low PA/high sedentary behaviour (55). The authors suggested the presence of synergy between PA and sedentary behavior.
Numerous studies demonstrate independent effects of PA and sedentary behaviours on risk factors, with the effects of PA (and especially MVPA) generally stronger than those of sedentary behaviour. A cross-sectional study in a large sample of adolescents (n = 200,615 participants) across 39 countries did not report consistent associations between screen-based activities and PA across gender or geographical location (56). A cross-sectional study of 1862 British children age 9-10 found inverse associations between time spent in PA and measures of adiposity, independent of objectively measured sedentary time and other covariates (52). However, the association between sedentary time and adiposity was attenuated after
adjustment for MVPA and other covariates. This suggests that MVPA may be more closely associated with adiposity and other cardio-metabolic risk factors than sedentary time. Chaput et al., in a prospective cohort of 536 children with at least one obese biological parent, reported that high levels of MVPA were associated with significantly lower values of several cardiometabolic risk factors (i.e., waist circumference, fasting triglycerides, diastolic BP, higher values of HDL cholesterol), independent of sedentary time. However, objectively measured sedentary time was only significantly associated with diastolic blood pressure, and the association was no longer significant after adjustment for MVPA (57). Analyses from the
15
European Youth Heart Study cohort of 1,092 children showed that TV-viewing was not
correlated with PA (r = 0.013, p = 0.58), even after adjustment for covariates. TV-viewing was not associated with adiposity after adjustment for PA, but association between PA and fasting insulin, glucose, triglyceride, systolic blood pressure and diastolic blood pressure remained statistically significant after adjustment for TV-viewing and adiposity (58).
2.3.2 Gaps in Knowledge
MVPA and sedentary behaviours are now widely accepted as separate entities with distinct effects on health. The independent effects of MVPA and screen time are actively under study, and published articles to date report mixed findings of their effects on multiple health outcomes such obesity and high blood pressure. The correlation between MVPA and screen time is not clear. Some articles report weak positive correlations, others show a correlation in the opposite direction, and some find no correlation. Research on sedentary behaviours, and more specifically, on screen time, is still in its infancy. In adolescent studies its effects on health appear to be less potent than those of MVPA. However further research is needed to assess this in-depth. Finally, screen time and PA are behaviours that change during adolescence, but most articles assessing the association between MVPA and screen time are cross-sectional limiting causal inference, identification of predictors of change, and describing long-term evolution of the behaviours. More longitudinal studies are needed. In a systematic review of 230 articles assessing the association between sedentary behavior and PA in
children and adolescents, only 21 were longitudinal in design (53). Thus, prospective research on SB in adolescents remains limited (59).
2.4 Group-Based Trajectory Modeling (GBTM)
GBTM is a statistical procedure applied to longitudinal data to identify subgroups within a population with distinctive developmental trajectories. The method is usually used to describe the progression of a phenomenon, whether behavioral, biological or physical, over age or time (60). It is an application of the finite mixture modeling, where the statistical model specifies that the population comprises a mix of a finite number of groups (61). Several
16
statistical methods exist to model evolution of behaviors. However, they differ in the technical assumptions about the distribution of trajectories in the population. GBTM assumes that there may be clusters of distinct developmental trajectories in the population, whereas other
methods such as latent class analysis assumes a continuous distribution of population
parameters and thus that the population distribution of trajectories varies continuously across individuals (61). These assumptions will influence the product of the analysis in important ways.
GBTM is a powerful statistical method for summarizing and portraying complex patterns in longitudinal datasets (61), which can be applied to behaviours such as PA and ST. This method has been used to identify PA trajectories in adults as well as in special population subgroups (62-65). Janz et al. used the method to identify sex-specific PA trajectories in an adolescent population and then tested them for their effect on bone strength (66). Kwon et al. used data from the National Growth and Health Cohort study to identify PA and TV-viewing trajectories among girls during adolescence (67). They identified four PA trajectories. Most girls in the common “PA decreasing pattern” concurrently developed an increasing pattern of TV-viewing over the 9-year follow-up. However, 87.7% of girls in the “maintaining high” PA trajectory developed a decreasing pattern of TV-viewing, findings which do not support that TV-viewing and PA are independent behaviors. Finally, a study emanating from the
Cardiovascular Risk in Young Finns Study identified five PA trajectories in 3596 adolescents followed up for 31 years, although no sedentary behavior trajectories were reported (68).
There are fewer studies on screen time than PA trajectories, and even fewer in adolescents. One study from a prospective birth cohort study in Australia with a 15-year follow up, identified three distinct TV-viewing trajectories using latent class analysis (69). TV-viewing from childhood into early adulthood was a relatively stable behavior in most participants, although one-third were members of an increasing TV-viewing time trajectory that tracked into early adulthood (69). Prolonged periods of TV-viewing over the 15-year study were associated with a higher body fat percentage in women and the association was not attenuated by PA levels.
17
2.5 Summary
PA research has evolved considerably in the last several decades and researchers have generally adopted a new vision of movement. Sedentary behaviour is no longer viewed as one end of the PA spectrum and is now recognized as different from physical inactivity. An adolescent can be very active but still accumulate large amounts of screen time daily, supporting the premise that PA and sedentary behavior are separate and distinct entities that could have unique effects on health. PA and sedentary behaviour have a weak correlation in adolescent populations and their independent effects on health outcomes are not fully understood. Because PA and sedentary behaviour are highly variable behaviours during adolescence, increasing in some contexts and decreasing in others, examining their
co-evolution during adolescence offers potential to expand understanding of these two behaviors. Trajectory modeling techniques take advantage of the longitudinal nature of some databases and can depict the co-evolution of PA and sedentary behavior over time.
18
Chapter 3: Objectives and Hypotheses
The aim of this MSc thesis was to describe the co-evolution of PA and screen time during adolescence. There are two specific objectives:
1. To describe the concurrent natural course of PA and screen time during adolescence, by developing sex-specific group-based trajectories for each behaviour.
The literature review reveals important differences between sexes in PA and screen time. Our hypotheses were that boys and girls have distinct PA and screen time trajectories, and that boys have higher levels of PA and screen time than girls.
2. To describe the association between PA trajectory membership and screen time trajectory membership.
We hypothesized that membership in PA and screen time trajectories will not covary. More specifically, cross-tabulations and conditional probabilities obtained from joint trajectory modeling will show that the variables do not associate one with the other over time.
19
Chapter 4: Methods
This thesis comprises a secondary analysis of data originating from the NDIT cohort. This chapter describes the study in terms of design, sampling and variables. It then presents the analytical sample and data analysis plan.
4.1 Data source: NDIT Study
4.1.1 Study Design and Sampling
The NDIT study is an ongoing longitudinal investigation of 1294 adolescents conducted in or near Montreal, Québec (70). Its main purpose is to describe the natural course of cigarette smoking and nicotine dependence in adolescents and to investigate the range of individual-level and contextual risk factors for cigarette smoking (70). NDIT data collection also included parent and school administrator self-report questionnaires, collection of blood and/or saliva samples from participants and their parents for DNA genotyping, and direct observations of school neighbourhoods (i.e., environmental scans) (70). Data collection in NDIT allows for other topics of interest in relation to adolescent health to be investigated including among others, obesity, blood pressure, PA, team sports, sedentary behavior, diet, genetics, alcohol and drug use, sleep and mental health (70).
Participant recruitment for NDIT began in 1999 using a school-based sampling strategy. Thirteen high schools were selected purposively in the greater Montreal area to include a mix of French- and English-language schools; urban, suburban and rural schools; and schools located in high, moderate and low socioeconomic status neighbourhoods. (70). School boards and school principals provided consent with assurance that the school would participate over five years (so that the students could be followed from grade 7 to 11) (70). Of the 13 high schools, two were excluded due to low parental consent and one was excluded because school administrators could not assure continued participation. The final number of schools retained was 10. All grade 7 (Secondary 1) students from the 10 high schools were invited to participate (n = 2325) and 1294 (56%) agreed to participate.
20
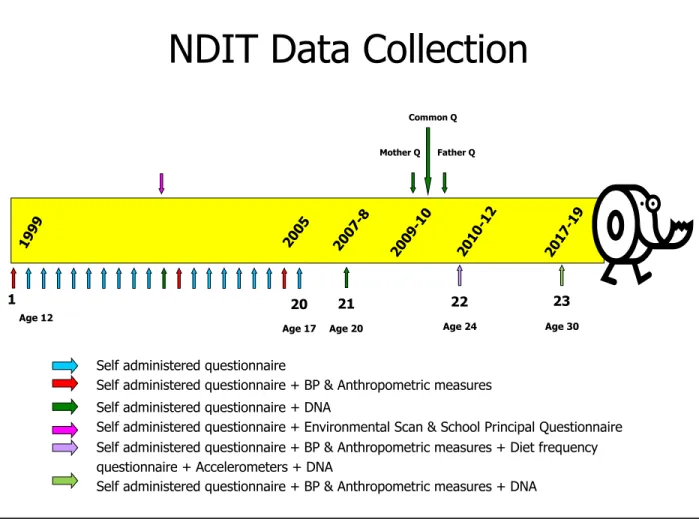
Self-report questionnaires were completed by participants during class time in autumn 1999 in nine schools, and in autumn 2000 in one school (Table 1). Follow-up questionnaires were completed during class time every 3 months during the 10-month school year for 5 years thereafter (i.e., for the entire duration of high school for students recruited at the beginning of grade 7). The follow-up during high school thus comprised 20 cycles (Figure 2), all of which are used in the current thesis. Participants continued their involvement in NDIT after graduation from high school, with completion of self-report questionnaires in 2007-08 when they were age 20 years on average (cycle 21), and in 2011-12 when they were age 24 years on average (cycle 22). The 23rd data collection cycle is currently underway (participants are now age 30 years on
average). Cycle 21-23 data are not used in this thesis.
Figure 2. NDIT data collection cycles, 1999 to 2019 (70)
NDIT Data Collection
1 20 1999 2005 2007 -8 2009 -10 2010 -12 21 22 Mother Q
Self administered questionnaire
Self administered questionnaire + BP & Anthropometric measures Self administered questionnaire + DNA
Self administered questionnaire + Environmental Scan & School Principal Questionnaire Self administered questionnaire + BP & Anthropometric measures + Diet frequency questionnaire + Accelerometers + DNA
Self administered questionnaire + BP & Anthropometric measures + DNA Father Q
Common Q
Age 12
Age 17 Age 20 Age 24
2017 -19
23
21
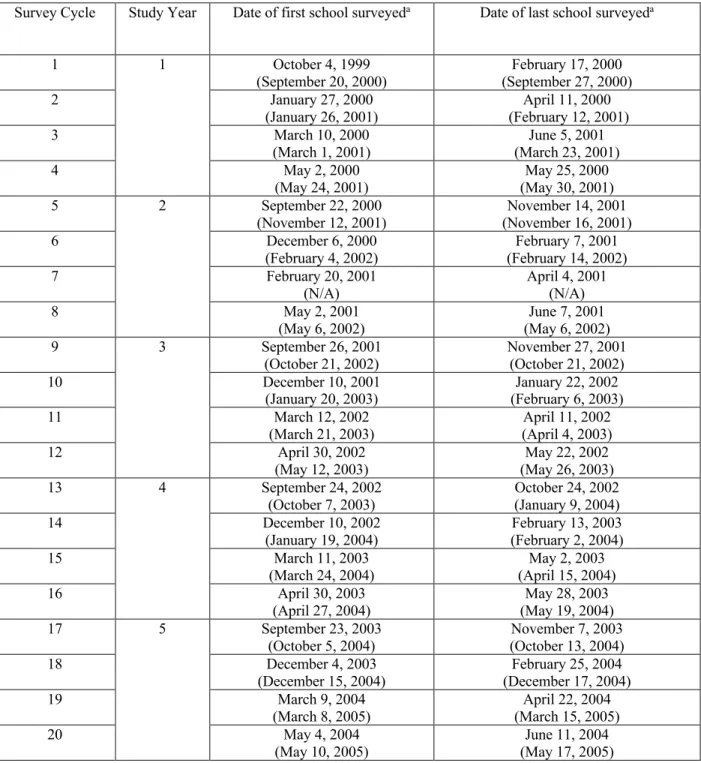
Table 1. Dates when the first and last school were surveyed at each survey cycle and the within-survey time range.
Survey Cycle Study Year Date of first school surveyeda Date of last school surveyeda
1 1 October 4, 1999 (September 20, 2000)
February 17, 2000 (September 27, 2000) 2 January 27, 2000
(January 26, 2001) (February 12, 2001) April 11, 2000
3 March 10, 2000
(March 1, 2001) (March 23, 2001) June 5, 2001
4 May 2, 2000
(May 24, 2001)
May 25, 2000 (May 30, 2001) 5 2 September 22, 2000
(November 12, 2001) (November 16, 2001) November 14, 2001 6 December 6, 2000
(February 4, 2002) (February 14, 2002) February 7, 2001 7 February 20, 2001
(N/A) April 4, 2001 (N/A)
8 May 2, 2001
(May 6, 2002)
June 7, 2001 (May 6, 2002) 9 3 September 26, 2001
(October 21, 2002) November 27, 2001 (October 21, 2002) 10 December 10, 2001
(January 20, 2003) (February 6, 2003) January 22, 2002 11 March 12, 2002
(March 21, 2003) (April 4, 2003) April 11, 2002 12 April 30, 2002
(May 12, 2003) (May 26, 2003) May 22, 2002 13 4 September 24, 2002
(October 7, 2003)
October 24, 2002 (January 9, 2004) 14 December 10, 2002
(January 19, 2004) (February 2, 2004) February 13, 2003 15 March 11, 2003
(March 24, 2004) (April 15, 2004) May 2, 2003 16 April 30, 2003
(April 27, 2004)
May 28, 2003 (May 19, 2004) 17 5 September 23, 2003
(October 5, 2004) (October 13, 2004) November 7, 2003 18 December 4, 2003
(December 15, 2004) (December 17, 2004) February 25, 2004
19 March 9, 2004
(March 8, 2005) (March 15, 2005) April 22, 2004
20 May 4, 2004
(May 10, 2005)
June 11, 2004 (May 17, 2005)
aNine schools were recruited and began follow-up in the 1999-2000 school year. The first set of dates are for these 9
22
4.1.2 Study Variables
For this thesis, two variables from the NDIT Study were used: PA (number of days weekly that participants were physically active), and screen time (number of hours of screen time weekly). Except for sex, no other variables were used in the trajectory modeling.
4.1.2.1 Number of Days Active Weekly
In each of the 20 survey cycles, data on PA were collected with a question adapted from the 7-day Physical Activity Recall Checklist (17). Participants were asked: Now think about the physical activities that you did last week from Monday to Sunday outside your regular school gym class. For each activity that you did for 5 minutes or more at one time, mark an “X” to show the day(s) on which you did that activity. Participants were then presented with a list of 29 physical activities commonly engaged in by adolescents in Montreal and were instructed to mark an X for each day of the previous week on which they engaged in that activity (Table 2).
Table 2. 7-day Physical Activity Recall Checklist, NDIT 1999-2005
Mon .. Tues .. Wed . Thur .
Fri. Sat. Sun. Bicycling to school, bicycling to do errands, going for a bicycle
ride Swimming/diving Basketball Baseball/softball Football Soccer Volleyball
Racket Sports (badminton, tennis) Ice hockey/ball hockey
Jump rope
Downhill skiing, snowboarding Cross-country skiing
Ice skating
Rollerblading, skateboarding
Gymnastics (bars, beams, tumbling, trampoline)
Exercise / physical conditioning (push-ups, sit-ups, jumping jacks, weight-lifting, exercise machines)
Ball-playing (dodge ball, kickball, wall-ball, catch) Track and field
23
Games (chase, tag, hopscotch) Jazz/classical ballet
Dancing (aerobic, folk, at a party)
Outdoor play (climbing trees, hide and seek) Karate/ Judo/ Tai Chi/ Kung Fu
Boxing, wrestling
Outdoor chores (mowing, raking, gardening)a
Indoor chores (mopping, vacuuming, sweeping)a
Mixed walking/running/jogging Walkinga
Running/jogging Other(s)
aActivities not retained in the trajectory analyses.
The 29 physical activities represented a mix of activities of low, moderate or vigorous intensity. ‘Walking’ was not retained for the trajectory analyses because almost all participants reported walking every day. ‘Indoor chores’ and ‘outdoor chores’ were also excluded because they are considered to be nonleisure, nondiscretionary activities (71). Most PA recommendations for youth focus on leisure-time PA (which is amenable to change) and exclude physical activity during physical education classes at school and other nondiscretionary activities (10). The remaining 26 activities were all of moderate (i.e., 3-6 METs (18)) or vigorous (i.e., >6 METs (18)) intensity. The 5-minute threshold used in the 7-day recall is supported by findings that PA engaged in for at least 5 minutes protects against obesity in youth (73, 74). Number of days active weekly was computed as the sum of the number of days weekly when participants reported engaging in at least one of the 26 activities. For example, a value of “0” indicates that the participant did not engage in any of the 26 activities on any day of the week. A value of “2” indicates that the participant reported at least one PA on 2 of the past 7 days. This PA indicator does not incorporate duration, intensity or mode of PA.
During the first cycle of the NDIT study, the PA recall was administered twice in two weeks among 76 students in one school. The correlation between reported PA levels was r = 0.73 (72). The 3-day test-retest reliability reported in the original 7-day Physical Activity Recall Checklist was r = 0.74 and correlated with accelerometer data at r = 0.34 (17). Intraclass correlation coefficients (ICC) for ‘Number of days active weekly’ were calculated to determine
24
the extent to which students within the same school resemble each other. Elevated ICCs would indicate that PA levels for participants from the same school are correlated. ICCs were below 0.2 in all survey cycles, which suggests low correlations between PA values across students within the same school. Thus we can use these data without correcting for the cluster sampling structure of the study.
4.1.2.2 Weekly Screen time
At each of the 20 cycles, participants were asked: How many hours of television
(including video movies) do you usually watch in a single day? If the answer is zero, write “0” in the box. If the answer is less than ½ hour, write “LT ½”, and How many hours do you usually play video or computer games, or use Internet in a single day? If the answer is zero, write “0” in the box. If the answer is less than ½ hour, write “LT ½”. Participants were provided with boxes to record the number of hours they engaged in these activities on weekends and on weekdays. To harmonize with other similar studies on screen time (46), responses were capped at a maximum value of 5 hours per day (i.e., recoded as “≥ 5 hours per day”). Weekly screen time was
computed as the weighted sum of the number of hours of both television and computer time for weekdays and weekend days: (5 * weekday TV time) + (2 * weekend TV time) + (5 * weekday computer time) + (2 * weekend computer time). ICC were calculated again for this variable and correlations at all survey cycles were very low (r < 0.01).
4.2 Analytical Sample and Attrition
Participants were retained for analysis if they had provided PA and screen time data on ≥ 3 occasions across the 20 data collection cycles; participants with < 3 observations do not contribute meaningful information for trajectory modeling (75). A total of 50 participants contributed data in < 3 cycles, and therefore 1244 of the 1294 (96%) were retained for analyses. Table 3 presents the number of observations available at each cycle for these 1244 participants.
Two-thirds (65%) of the 1294 participants remained in the study until the 20th cycle (end
of high school), although not all participants completed all 20 cycles. Reasons for not continuing in NDIT included moved to a non-participating school, no time and no longer interested (70).
25
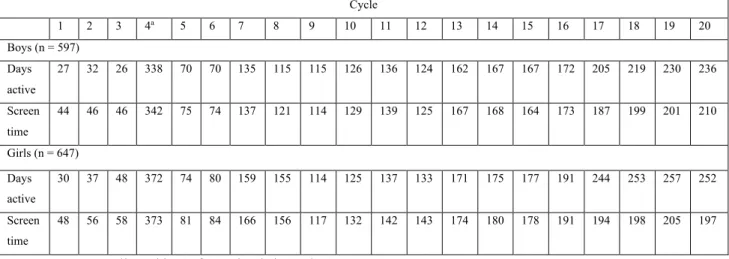
Table 3. Number of observations missing in each cycle among eligible participants1 Cycle 1 2 3 4a 5 6 7 8 9 10 11 12 13 14 15 16 17 18 19 20 Boys (n = 597) Days active 27 32 26 338 70 70 135 115 115 126 136 124 162 167 167 172 205 219 230 236 Screen time 44 46 46 342 75 74 137 121 114 129 139 125 167 168 164 173 187 199 201 210 Girls (n = 647) Days active 30 37 48 372 74 80 159 155 114 125 137 133 171 175 177 191 244 253 257 252 Screen time 48 56 58 373 81 84 166 156 117 132 142 143 174 180 178 191 194 198 205 197
aData were not collected in 6 of 10 schools in cycle 4.
Table 4 presents baseline data comparing participants included and excluded from the analytical sample. Excluded participants were older on average at baseline than those included. Weekly screen time was higher among participants retained, and this result was close to
statistical significance (p=0.07).
1 Not all participants participated in all 20 cycles. Some participants joined NDIT after the first few data collection
26
Table 4. Baseline (cycle 1) characteristics of included and excluded participants, NDIT 1999-2000
Included participants
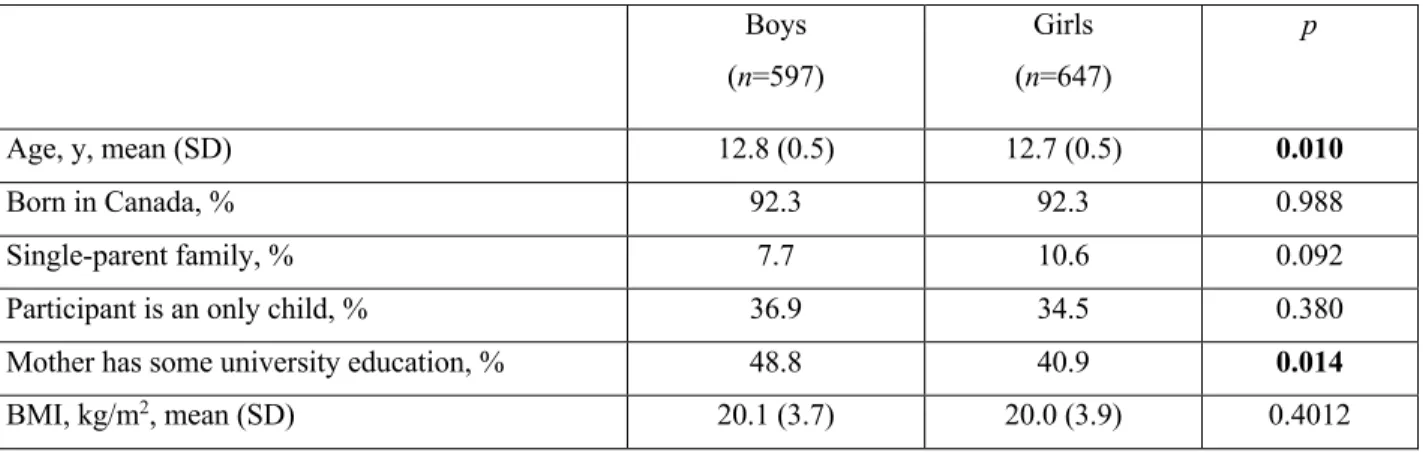
(n=1244) Excluded participants (n=50) p-value Age, y, mean (SD) 12.7 (.51) 13.4 (1.11) < 0.001 Missing 0 1 Male, % 48 53 0.486 Missing 0 0 Single-parent familya, % 9 13 0.483 Missing 62 10 Born in Canada, % 92 86 0.249 Missing 0 1
Mother has some university-level
educationa, % 55 70 0.354
Missing 276 40
Number of days active weekly, mean (SD) 4.9 (.07) 5 (.40) 0.838
Missing 57 10
Weekly screen time (hr), mean (SD) 26.5 (.43) 21.6 (2.4) 0.069
Missing 92 11
aParental reports of data from the parent questionnaires.
Missing values were high for mother’s level of education, because only some parents (46% of mothers and 37% of fathers of all NDIT adolescent participants) completed the parent questionnaires in 2009-10.
4.3 Data Analysis
4.3.1 GBTM
Group-based trajectories for PA and screen time were modeled in boys and girls separately. The time metric to estimate all trajectories was cycle (1 to 20). However, to ease interpretation, median age at each cycle was used as the x-axis in trajectory plots.
GBTM requires the analysis to choose among four distributions for the variable to be modelled: censored normal, Poisson and zero-inflated Poisson, and Bernoulli (61). In the case of the ‘number of days active weekly’ variable, we are in the presence of count data; examination of the data distribution with histograms, however, informs us that the data do not present with a Poisson distribution (see Appendix C for histograms of the PA variable at cycles 1, 10 and 20),
27
and this type of model would not be appropriate. It can be best described as a discrete variable with a large number of values at its maximum (7 days weekly). In the case of the ‘Weekly Screen time’ variable, the distribution is continuous with a wide range (exceeding 70-hours weekly) (see Appendix D for histograms of the screen time variable at cycles 1, 10 and 20). Thus, for both variables, the censored normal distribution has been determined as the most appropriate form for estimating trajectory parameters, especially given that the model using the censored normal distribution is robust to departure from the normal distribution (Bobby Jones, July 4, 2019). The GBTM is the product of maximum likelihood estimation, which is a
modification of the normal distribution but in which the data values are forced to take values in between the interval specified with minimum and maximum values, that lie outside the range of observed data values (76).
The number of trajectories (or groups) is not decided a priori but is empirically derived by estimating models with an increasing number of trajectories (starting with 2) and selecting the model with the best fit. In regards with the objectives of the study, we considered models
containing between 2 and 5 trajectory groups. The number of trajectories that best fit data is identified based on the Bayes factor, estimated from the Bayesian Information Criterion (BIC) as ~2x(DBIC) (61, 76). The model which minimizes the Bayes factor is determined to be the
optimal model. Second, the selected model is simplified through modifications in the order of the polynomials for each trajectory group (which determine its flexibility). Terms that did not attain significance level at .05 were omitted so that the trajectory was estimated with lower-order polynomials, while assuring that these modifications do not majorly affect the shape of the curves. The estimation provides posterior probabilities for each individual and participants are assigned to the group for which their posterior probability is the highest. An average posterior probability per trajectory group over 0.70 implies a satisfactory fit of the model (61).
28
Trajectories were modeled in SAS 9.4 (SAS Institute Inc., Cary, North Carolina, USA) using the Proc Traj package2 (76). Descriptive statistics and other related analyses were
undertaken in SAS 9.4 and STATA 12.1 ® (College Station, Texas, USA).
4.3.2 Joint Trajectories
After modeling of PA and screen time trajectories separately, we modeled joint trajectories for both variables simultaneously (61).
The joint trajectory model can be used to analyze the connections between the developmental trajectories of two outcomes evolving simultaneously (61). It relates the two measurements but without combining them into a single metric (such as a single summary statistic), making a more effective use of the longitudinal character of the data. This model was first presented as providing a new statistical tool for analyzing two themes in developmental psychopathology, criminology, and psychiatry; however potential applications of the model extend into diverse domains.
The joint trajectory is modeled once individual trajectories for both PA and ST are determined. Using the same number of trajectory groups and orders as determined during the creation of the distinct trajectories of PA and ST, the joint trajectory model is estimated with the same statistical package and software. The joint model will provide three outputs: 1) group membership to trajectories for both measurements, which are previously obtained from the trajectory modeling of the two variables separately; 2) the probability of membership in each pair of trajectory groups (e.g., the proportion of individuals that are members of low PA and high ST trajectory groups); and 3) two sets of conditional probabilities for trajectory group membership across both variables (e.g., the probability of being in the low PA trajectory group given that the individual is part of the high ST trajectory group, and vice-versa). These conditional probabilities
2The GBTM procedure was performed in SAS 9.4 and STATA 12.1, both supporting the Proc Traj package.
Inconsistent outputs and results were seen between the two softwares. After consultation with Bobby Jones (Research Scientist, Department of Psychiatry, University of Pittsburgh School of Medicine, and developer of the Proc Traj package), a decision was made to pursue all trajectory modeling with the SAS 9.4 software.
29
are the key advantage of the joint model and provide the capacity to link two distinct but theoretically related measurements (77).
4.4 Ethical Considerations
For all adolescent participants, one parent or legal guardian signed a consent form (Appendix A). Participation is entirely voluntary, and participants could choose to stop being part of the study at any time without providing a reason and without consequences. Post-high school, participants were given monetary compensation for their involvement in the study.
This project is an add-on to an existing study which has received ethics approval from the Montreal Department of Public Health Ethics Review Committee, the McGill University Faculty of Medicine Institutional Review Board, the Ethics Research Committee of the Centre de
recherche du Centre hospitalier de l’Université de Montréal and the University of Toronto (See Appendix B).
30
Chapter 5: Results
5.1 Manuscript Presentation and Contribution
This chapter includes a manuscript entitled Joint trajectories of physical activity and screen time during adolescence. The journal targeted for publication is the International Journal of Behavioral Nutrition and Physical Activity. As first author, the candidate played a central role in all aspects of manuscript preparation. She refined the objectives, conducted all the analyses and wrote the manuscript. Marie-Pierre Sylvestre and Jennifer O’Loughlin supervised the analyses and reviewed and edited the manuscript.
31
5.2 Manuscript
Title: Joint trajectories of physical activity and screen time during adolescence
Authors: Teodora Riglea1,2, Marie-Pierre Sylvestre1,2, Isabelle Doré1, Jennifer O’Loughlin1,2
Authors affiliations: 1Centre de recherche du centre hospitalier de l`Université de Montréal
(CRCHUM), Montréal, QC, Canada; 2Department of Social and Preventive Medicine, Université
de Montréal, Montréal, QC, Canada
Correspondance: Jennifer O’Loughlin, Centre de recherche du centre hospitalier de l`Université de Montréal (CRCHUM), Montréal, QC, Canada ; Department of Social and Preventive
Medicine, Université de Montréal, Montréal, QC, Canada ([email protected])
Number of tables: 3
Number of figures: 3
32
Abstract
Introduction: Physical activity relates positively to adolescent health. However only 7% of youth age <17 years meet the recommended 60 minutes of moderate-to-vigorous physical activity (MVPA) daily. Additionally, most adolescents exceed the recommended maximum 2 hours screen time daily. Several studies suggest that MVPA and screen time are weakly correlated and may develop independently of each other. We examined the co-evolution and association between MVPA and screen time during adolescence.
Methods: Data were drawn from a longitudinal investigation of 1294 adolescents age 12-13 recruited in 1999-2000 from all grade 7 classes in 10 Montreal-area high schools. Participants completed self-report questionnaires every 3 months during the 10-month school year, from grade 7 to 11. Sex-specific group-based joint trajectories were used to describe co-evolution of MVPA and screen time over 5 years during adolescence. Associations were examined in cross-tabulations.
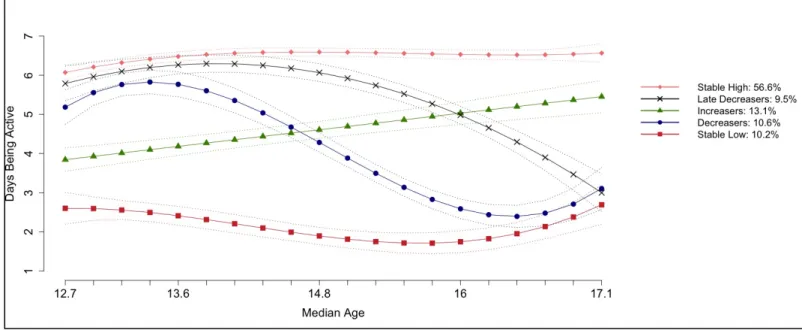
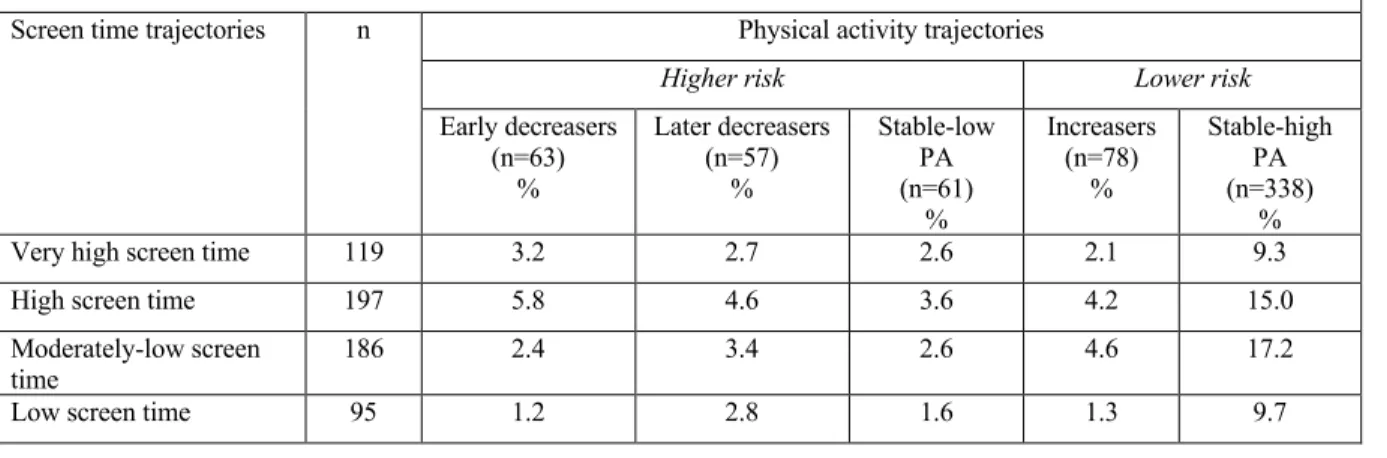
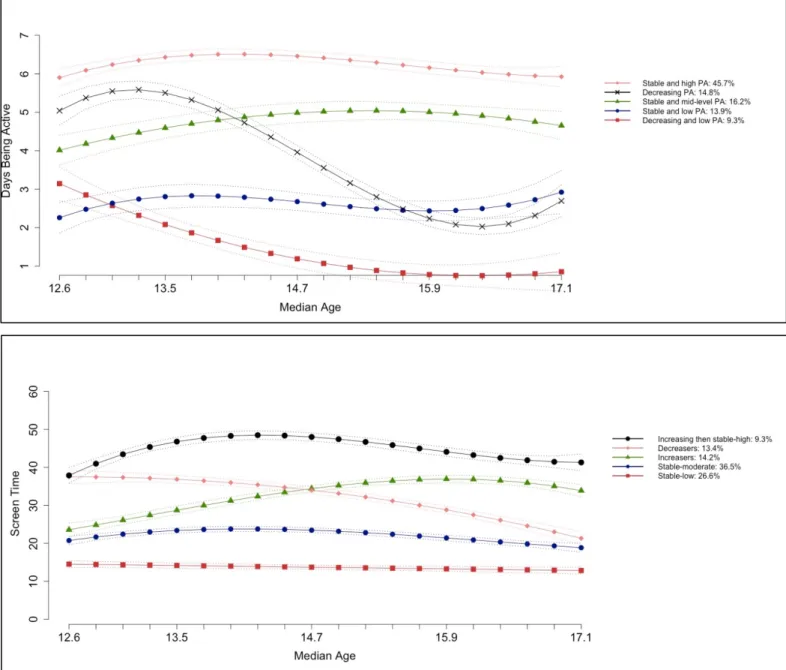
Results: We identified 5 MVPA trajectories in both sexes, 4 screen time trajectories in boys and 5 screen time trajectories in girls. 57% of boys and 46% of girls reported MVPA 6-7 days per week during the 5-year study. All screen time trajectories exceeded 2 hours screen time daily. 17.2% of boys and 14.5% of girls had low screen time and stable-high MVPA trajectories. Conditional probabilities suggest associations between screen time and MVPA trajectory group memberships.
Conclusions: Developmental patterns of MVPA and screen time are heterogenous in
adolescents. Public health practitioners need to take co-evolution and the association between MVPA and screen time into account in planning programs and policy.
Key Words: Physical activity, screen time, sedentary behaviour, adolescence, longitudinal study, group-based trajectory modeling.