This is an author-deposited version published in:
http://oatao.univ-toulouse.fr/
Eprints ID: 11015
To link to this article: DOI: 10.1088/0963-0252/23/1/012003
URL:
http://dx.doi.org/10.1088/0963-0252/23/1/012003
To cite this version:
Robert, Éric and Sarron, Vanessa and Darny, Thibault
and Riès, Delphine and Dozias, Sébastien and Fontane, Jérôme and Joly,
Laurent and Pouvesle, Jean-Michel Rare gas flow structuration in plasma
jet experiments. (2014) Plasma Sources Science and Technology, vol. 23
(n° 1). ISSN 0963-0252
O
pen
A
rchive
T
oulouse
A
rchive
O
uverte (
OATAO
)
OATAO is an open access repository that collects the work of Toulouse researchers and
makes it freely available over the web where possible.
Any correspondence concerning this service should be sent to the repository
administrator:
[email protected]
FAST TRACK COMMUNICATION
Rare gas flow structuration in plasma jet
experiments
E Robert
1, V Sarron
1, T Darny
1, D Ri `es
1, S Dozias
1, J Fontane
2, L Joly
2and J-M Pouvesle
11GREMI, UMR 7344, CNRS/Universit´e d’Orl´eans, BP 6744, 45067 Orl´eans Cedex 2, France 2Universit´e de Toulouse, ISAE, D´epartement d’A´erodynamique, Energ´etique et Propulsion (DAEP),
France
Abstract
Modifications of rare gas flow by plasma generated with a plasma gun (PG) are evidenced through simultaneous time-resolved ICCD imaging and schlieren visualization. The
geometrical features of the capillary inside which plasma propagates before in-air expansion, the pulse repetition rate and the presence of a metallic target are playing a key role on the rare gas flow at the outlet of the capillary when the plasma is switched on. In addition to the previously reported upstream offset of the laminar to turbulent transition, we document the reverse action leading to the generation of long plumes at moderate gas flow rates together with the channeling of helium flow under various discharge conditions. For higher gas flow rates, in the l min−1range, time-resolved diagnostics performed during the first tens of ms after
the PG is turned on, evidence that the plasma plume does not start expanding in a laminar neutral gas flow. Instead, plasma ignition leads to a gradual laminar-like flow build-up inside which the plasma plume is generated. The impact of such phenomena for gas delivery on targets mimicking biological samples is emphasized, as well as their consequences on the production and diagnostics of reactive species.
Keywords: plasma jet, non thermal plasma, schlieren, ICCD imaging, gas flow control (Some figures may appear in colour only in the online journal)
1. Introduction
Since the pioneering work of Jiang et al [1], there have been few studies [2,3] showing evidence that, in addition to the first analysis based on neutral gas hydrodynamic consideration [4], the gas flow at the outlet of non-thermal plasma jets may be strongly influenced by plasma generation, exhibiting common features with phenomena encountered in plasma actuators [5,6]. Driven by the tremendous potentialities of plasma jets for biomedical applications, these studies focused on the physical mechanisms involved in such plasma-induced rare gas flow modifications, their impact in the control of plasma plume delivery [7] and the generation of reactive species. Plasma plume characterization is also crucial for the performance and analysis of many optical diagnostics likely to assess the
reactive species densities [8–10]. Following the analysis of plasma propagation inside dielectric capillaries of a few tens of cm [11,12], this work deals with the characterization of plasma plumes generated by a plasma gun (PG) in various configurations. They include two different gases flushed at various flow rates, with or without impingement on a metallic target, but also two pulse repetition rates and two capillary lengths. The paper is organized as follows: section2presents the experimental setup used for both gas flow and plasma plume measurements, section3summarizes the results obtained on neon plumes and helium gas flow characterization and section4
gives the analysis of these results and their impact for plasma plume generation and applications within the general frame of plasma medicine.
2. Experimental setup
Plasma is generated using the PG developed at GREMI laboratory and previously described and characterized in detail [11,12]. Briefly, the PG consists of a DBD reactor made of a borosilicate capillary, 4 mm inner diameter and 1 mm thick, equipped with an inner hollowed electrode, 1 mm in diameter, through which either neon or helium gas is flushed. Together with this inner high voltage powered electrode, the PG is also equipped with an outer grounded ring-shaped electrode centered with the inner electrode tip. Following plasma ignition in this DBD reactor, downstream plasma propagation (5 or 15 cm in this work) occurs inside the capillary before in-air expansion where the so-called plasma plume is produced. Either nanosecond or microsecond rise time voltage pulses with peak voltage amplitude of, respectively, 20 kV and 14 kV were used in this study, both voltage pulses having microsecond duration decays allowing for long distance plasma propagation. The PG was operated either in continuous mode at a repetition rate of 200 Hz or 2 kHz, or in a burst mode with on/off, periods of 300 ms and 700 ms, respectively. High purity neon (N48) and helium (Alphagaz 1) gas flow rates, ranging from 0.1 to 5 l min−1, were controlled through mass
flowmeters. The PG capillary was positioned vertically and in some experiments a brass target 40 mm in diameter was set either 45 mm or 100 mm away from the capillary outlet. ICCD camera equipped with a 50 mm lens was used to image the plasma plume. Combined ICCD imaging and schlieren visualization experiments was carried out on the experimental test bench dedicated to helium plasma jet study at the ISAE laboratory (Toulouse).
3. Results
3.1. ICCD characterization of neon plasma plume
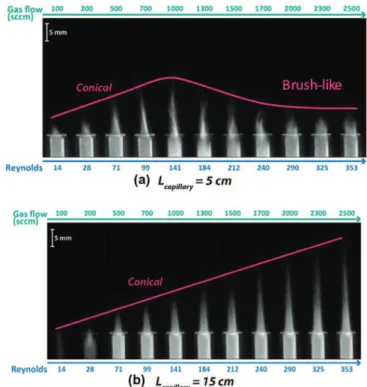
Figure1presents 10 µs exposure ICCD images of neon plumes generated with the ns rise time driver, operated at 200 Hz, versus the neon gas flow rate for the two capillary lengths of 5 and 15 cm.
With the 5 cm long capillary, the plasma plume gradually lengthens as the neon flow rate increases from 0.1 to 0.7 l min−1, keeping a conical shape. For gas flow rates
ranging from 1 to 1.5 l min−1, the plume shortens and exhibits
a transition to a much less stable regime evidenced for higher flow rates, where the brush-like shaped plume becomes shorter and shorter. The existence of these three patterns was previously reported for helium jets by many other groups and was associated with the transition from the laminar to the turbulent gas flow regimes [4]. For the same PG operating parameters, except with the capillary length changed to 15 cm, figure 1(b) reveals a drastically different evolution of the neon plume over the same range of gas flow rates. For this 15 cm long capillary, no transition occurs between the three regimes mentioned previously, the plume conserving a conical shape and its length increasing linearly up to about 2.5 cm. By contrast the longest plume is only about 1.5 cm long for the shorter capillary. For any gas flow rate, except for the 0.1 l min−1, where the plume hardly exits from the
Figure 1.10 µs exposure ICCD images of neon plumes generated at 200 Hz with the ns rise time PG driver for (a) 5 cm or (b) 15 cm long capillary versus the neon flow rate. Gas flow rate scale is given in sccm and with the corresponding Reynolds number, allowing for the comparison with the literature.
capillary outlet, the plumes appear much more homogeneous when produced with the 15 cm long capillary than with the shorter one.
Figure2 presents the evolution of plasma plume length, inferred from ICCD images, versus the neon flow rate for the two capillary lengths, the PG being powered with the µs rise time driver operated either at 200 Hz or 2 kHz.
At a 200 Hz pulse repetition rate, the evolution of plasma plume length, in figure2, measured with the PG powered with µs duration voltage pulses agrees with the data obtained at the same pulse repetition rate presented in figure1for the ns rise time driver. For the 15 cm long capillary, linear expansion of the plume length is measured all over the gas flow rate range, while, in the case of the 5 cm long capillary, a shortening of the plume length is measured for gas flow rate higher than 700 sccm. This indicates that the voltage pulse rise time has no significant influence on the plume length, which is more sensitive to the voltage pulse duration for a given gas flow condition [12]. Conversely, a strong effect of the pulse repetition rate is noted in the case of the short, 5 cm long capillary. While for 200 Hz, the plume length first increases before shortening for gas flow rate higher than 700 sccm, an almost linear increase in the plume length is measured all over the gas flow rate range for the 2 kHz condition. This is a first indication that the gas flow regime transition may not always be sufficient to explain the observed evolution of the plume length with the gas flow rate. Similar behaviors, data not shown, were observed for a helium-fed PG regarding the influence of the gas flow rate, the pulse repetition rate and the capillary length, the transitions between the different plume regimes occurring
Figure 2.Evolution of the neon plume length versus the gas flow rate for the 5 cm (triangles) and 15 cm (squares) long capillary for a 200 Hz (full symbols) and 2 kHz (open symbols) repetition rate. The PG is operated with the µs rise time driver.
Figure 3.Schlieren images when helium is flushed at 1 l min−1
through a 15 cm long vertical capillary. The dark disk at the bottom of the images is the metallic target 40 mm in diameter. (a) the PG is not powered. In (b) and (c) the PG is powered at 2 kHz, 14 kV with (b) floating potential target and (c) grounded target.
only for higher helium flow rates. In order to obtain a deeper insight on the correlation between gas flow regimes and plasma plume length, schlieren visualization, documented in the next subsection, was performed at the ISAE laboratory test bench.
3.2. Schlieren visualization of helium gas flows
All the schlieren experiments are performed with the helium fed and µs rise time PG driver. Schlieren diagnostics is qualitative, the black and white zones observed in the gas flow correspond to variations of refractive index gradient due to density gradients between air rich and helium rich regions.
Figure3presents typical schlieren images collected in a first setup where the PG is set vertically. The gas stream is flowing downwards with a helium flow rate of 1 l min−1. A
metallic target is placed downstream at a distance of 45 mm from the 15 cm long capillary outlet. This target is either at floating or ground potential.
Figure 4.Schlieren images of helium flow measured at the outlet of a (a) 5 cm and (b) 15 cm long capillary flushed at 2 and 5 l min−1.
The upper images are collected when the PG is not powered while the lower images exhibit the effect of plasma ignition at 2 kHz, 14 kV.
A significant modification of the helium flow is evidenced when plasma is ignited, resulting in a channeling of the flow towards the target. This channeling is more pronounced when the target is grounded. This setup is representative of the conditions encountered in biomedical applications where the cells or tissues under plasma treatment may be either at floating or grounded potential, and the gas flow coming from top to bottom. In addition to the observed plasma-induced channeling, low-density helium gas eventually flows upward a few mm away from the capillary outlet, when buoyancy effects become stronger than plasma effects. Nevertheless, the reported experiments are carried out with the capillary set vertically but with the helium flow flushing upward to simplify the visualization of the helium distribution in ambient air.
Figure4presents schlieren images of helium flows at the outlet of a 5 cm long, figure4(a), and 15 cm long, figure4(b), PG capillary flushed with 2 and 5 l min−1 helium flow rates.
The images reveal the influence of both the PG ignition and of the capillary length on the helium flow pattern. When the PG is not powered, the transition from the laminar to the turbulent regime happens closer to the capillary outlet with increasing helium flow rate. For a given flow rate, the transition occurs further downstream when the capillary length is increased, revealing the influence of the helium flowing successively through the inner, 1 mm in diameter, PG electrode and the 4 mm inner diameter capillary before in-air expansion. When the PG is powered, two behaviors are observed according to the flow rate. For the low flow rate, i.e. 2 l min−1, the transition
to the turbulent regime is shifted closer to the capillary outlet while a reverse effect is observed for the higher 5 l min−1flow
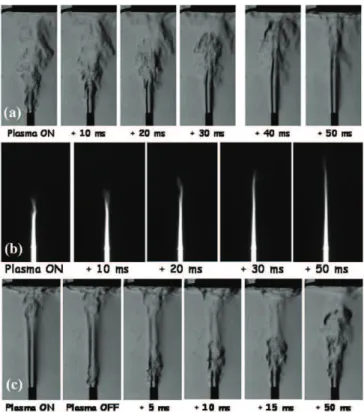
Figure 5.(a) 5 ms exposure schlieren images of helium flow during the first 50 ms after PG ignition at 2 kHz, 14 kV. (b) 5 ms exposure ICCD images of the plasma plume during the 50 ms after PG ignition. (c) 5 ms exposure schlieren images of helium flow during the first 50 ms after the PG is switched off.
3.3. Time-resolved schlieren visualization and ICCD imaging of helium jets
Simultaneous plasma plume imaging and helium flow visualization in ambient air are now performed in the burst mode (30% duty cycle). The PG is operated at 2 kHz, 14 kV, the helium flow rate is 5 l min−1. The grounded target is set
10 cm away from the 15 long PG capillary outlet. Figures5(a) and (c), respectively, present the evolution of the helium flow distribution in ambient air over the first 50 ms after the PG is switched on and switched off. The build-up and destruction of a 10 cm long helium channel are evidenced when the PG is either powered or switched off. It is worth noting that the non-plasma-activated helium flow is turbulent as observed in the first image of figure5(a) when plasma has just been switched on or in the last image of figure5(c) at 50 ms delay. Figure5(b) presents 5 ms exposure ICCD images of the plume during the first 50 ms after the PG is switched on. A gradual lengthening of the helium plume is observed with successive plasma generation, i.e. after successive pulsed atmospheric-pressure plasma streams (PAPS) [12] launching with the PG. This gradual extension of the plume is associated with the build-up of the plasma-induced helium channel, as seen from schlieren visualization in figure5(a).
4. Discussion and concluding remarks
ICCD imaging reveals that the hydrodynamic properties of neutral rare gas flow are not sufficient to explain the features
of neon plasma plumes generated with the PG. While in a first approach, the plasma plume evolution with the gas flow rate may be correlated with the laminar to turbulent transition, figure1(a), the modification of the plasma plume length with pulse repetition rate (figure2) indicates that plasma generation has also a strong influence on the neutral gas flow properties. The strong influence of the capillary length, (figures1and2), has not been yet fully explained but two main assumptions are under evaluation. First, laminar flow establishment inside the capillary and consequently at its outlet may require a sufficient capillary length downstream the tip of the inner hollowed HV electrode of 1 mm diameter. The sudden transition from 1 to 4 mm in diameter gas flow expansion must be related to local hydrodynamic phenomena such as generation of naturally unstable shear layers or boundary layer separation. Second, the plasma propagation inside the capillary may also induce gas flow modification before in-air expansion. In any case, it appears that plasma generation and propagation using long capillaries open up new possibility to generate long plasma plumes while feeding the plasma source with moderate gas flow rates.
The visualizations (figure3) of downward helium flows in a setup where the PG capillary outlet is facing a metallic target located 45 mm away from the capillary tip confirm the key role of plasma activation on the gas flow features. When the PG is not powered, the helium flow expands downwards over about only 7 mm before bending and diluting in the upper direction due to the buoyancy forces. When the PG discharges are ignited, the flow is channeled and the effect of buoyancy is significantly delayed downstream. When using a floating potential target, the helium flows on a longer distance downstream, up to the middle of the gap between the outlet and the target, i.e. 22 mm. This channeling is even stronger when the target is grounded, resulting in the impingement of helium on the target. To the best of our knowledge, this is the first time that such a phenomenon has been reported. The comparison between the floating and grounded target conditions suggests that plasma action on the helium flow is probably driven through the drift of ionic species generated in the helium PAPS [12]. The drift of these ions may either be induced by the fast traveling intense electric field generated at the head of the PAPS during its propagation through ionization wave processes [13] or by the transient field imposed between the PAPS head and the target. Another remark can also be addressed when comparing the floating and grounded target measurements. The distinct influence on helium flow achieved between these two setups excludes any significant role of the gas temperature increase, which may be induced by discharge ignition. Such a hypothetical temperature increase would be independent of the target potential status. The modifications of the helium flow may have large impacts in some biomedical applications. In most of either in vivo or in vitro experiments carried out with plasma jets, authors compare results obtained with and without plasma activation to estimate the possible effect of the gas flow alone. This protocol may under certain circumstances appear questionable, considering the strong difference of gas impact on the target when the plasma is activated or not. Great care must also be taken when presuming reactive species production
in a real biomedical application, i.e. necessarily involving a target, from measurements of reactive species carried out with a different or without any target.
The study of helium jets generated at higher flow rates, in the liters per min range, reveals two phenomena, reported for the first time to the best of our knowledge. These two phenomena are documented (figures4and5) for an upward-fed PG but are also measured with a downward-upward-fed PG.
First, the previously reported [1–3] plasma-triggered shift to a smaller distance from the capillary outlet of the laminar to turbulent transition is confirmed here for flow rates of 2 l min−1.
But for higher flow rates, e.g. 5 l min−1, a reverse action of
plasma, with a delay of the laminar to turbulent transition, is evidenced through schlieren visualizations. This effect is particularly pronounced for the 15 cm long PG capillary, leading to the generation of a 10 cm long laminar flow when the plasma is activated while the transition to turbulence occurs only 3 cm away from the capillary outlet when no discharges are applied. As discussed for the characterization of the neon plume, it appears that plasma propagation inside long helium-fed capillaries strengthens the impact of plasma on the flow during in-air expansion at the outlet of the capillary. This indicates the potential role of plasma on gas flow conditions inside the capillary. Detection of turbulent and laminar flow regimes inferred from Pitot tube experiments [14], not shown in this work, have confirmed the impact of plasma on the laminar to turbulent transition of the flow, both for the helium-and neon-fed PG. While schlieren visualization of neon flow in ambient air is difficult due to the small density difference between the two gases, Pitot tube measurement reveals the two effects of plasma on laminar to turbulent transition, observed for smaller neon flow rates in comparison with those documented for helium. It indicates that plasma action may also be crucial for gas heavier than neon, and may play a key role in some of the widely developed argon-based plasma jets [10,15].
Second, schlieren visualizations performed with the 15 cm long capillary flushed at 5 l min−1, during the first 50 ms
after plasma ignition, reveal the progressive build-up of the helium channel, leading finally to the helium impingement on a grounded target located 10 cm away from the capillary outlet. Before plasma activation, the helium flow exhibits a turbulent behavior close to the capillary outlet. This prevents the plasma plume expansion over large downstream distances during the application of the first voltage pulses. The gradual growth of the plasma plume length, observed with ICCD imaging, is clearly correlated with the pulse-to-pulse build-up of the helium channel, associated with plasma species action. The steady state 10 cm long plasma plumes measured under these experimental conditions for delays longer than 50 ms are the consequence of the relaminarization of the helium turbulent gas flow under the action of plasma. This is confirmed by schlieren visualizations performed right after the PG is switched off. Over a few tens of ms, the gas flow gradually turns back to its original state with a transition to turbulence close to the capillary outlet. These time-resolved visualizations, corroborated by ICCD imaging,
indicate first that plasma plume ICCD imaging alone may hinder the role of plasma on the rare gas flow channeling. These observations cast doubt on calculations of the air fraction, usually performed considering a laminar regime. Second, burst operation of plasma jets may also lead to significant change of the plume impingement over targets in comparison with the repetitive steady state plasma source operation. For the experimental conditions reported in this work (figure5), the PG burst operation with on period shorter than 50 ms and/or off periods longer than 50 ms, will result in a plasma plume unable to impinge on a target located 10 cm away from the outlet, while continuous operation at 2 kHz will result in plume impingement except during the first tens of ms.
Acknowledgments
This work is supported by ANR 2010 BLAN 093001 ‘PAMPA’. VS is supported by Conseil G´en´eral du Loiret, TD by Minist`ere de la Recherche and DR by CNRS and R´egion Centre. Discussions with S Reuter and S Iseni in the frame of collaborative project between INP Greifswald and GREMI are gratefully acknowledged.
References
[1] Jiang N, Yang J L, He F and Cao Z 2011 J. Appl. Phys. 109 093305
[2] Oh S J, Olabanji O T, Hale C, Mariani R, Kontis K and Bradley J W 2011 J. Phys. D: Appl. Phys.44 155206 [3] Foletto M, Douat C, Fontane J, Joly L, Pitchford L and
Puech V 2013 Influence of a plasma jet on the hydrodynamics of a helium JET 31st Int. Conf. on Phenomena in Ionized Gases (Granada, Spain, 14–19 July 2013)
[4] Karakas E, Koklu M and Laroussi M 2010 J. Phys. D: Appl. Phys.43 155202
[5] Moreau E 2007 J. Phys. D: Appl. Phys.40 605–36
[6] Joussot R, Leroy A, Weber R, Rabat H, Loyer S and Hong D 2013 J. Phys. D: Appl. Phys.46 125204
[7] Ghasemi M, Olszewski P, Bradley J W and Walsh J L 2013 J. Phys. D: Appl. Phys.46 052001
[8] van Gessel A F H, Alards K M J and Bruggeman P J 2013 J. Phys. D: Appl. Phys.46 265202
[9] Sousa J S, Bauville G and Puech V 2013 Plasma Sources Sci. Technol.22 035012
[10] Reuter S, Winter J, Iseni S, Peters S, Schmidt-Bleker A, D¨unnbier M, Sch¨afer J, Foest R and Weltmann K-D 2012 Plasma Sources Sci. Technol.21 034015
[11] Robert E, Barbosa E, Dozias S, Vandamme M, Cachoncinlle C, Viladrosa R and Pouvesle J M 2009 Plasma Process. Polym. 6795–802
[12] Robert E, Sarron V, Ri`es D, Dozias S, Vandamme M and Pouvesle J M 2012 Plasma Sources Sci. Technol. 21 034017
[13] Xiong Z and Kushner M J 2012 Plasma Sources Sci. Technol. 21 034001
[14] Sarron V, Robert E, Fontane J, Darny T, Ri`es D, Dozias S, Joly L and Pouvesle J M 2013 Plasma plume length characterization 21st Int. Symp. on Plasma Chemistry (Cairns, Australia, 4–9 August 2013)
[15] Iseni S, Schmidt-Bleker A, Winter J, Weltmann K-D and Reuter S 2014 J. Phys. D: Appl. Phys. submitted