Ba distribution in surface Southern Ocean sediments and export production
estimates
Nathalie Fagel,1 Frank Dehairs,2 Luc André,3 Gilles Bareille,4,5 and Christophe Monnin6 1Clay Mineralogy Department, Université de Liège, Liège, Belgium.
2Analytical Chemistry Department, Vrije Universiteit Brussel, Brussels, Belgium.
3Mineralogy and Geochemistry Department, Royal Museum for Central Africa, Tervuren, Belgium. 4Geology and Oceanography Department, University of Bordeaux, Bordeaux, France.
5
Laboratoire de Chimie Analytique Bio-organique et Environnement (LCABIE), UMR-CNRS 5034, Université de Pau et des Pays de l'Adour, Pau, France.
6Laboratory of Geochemistry, University Paul Sabatier, Toulouse, France.
Abstract: [1] We present excess Ba (Baxs) data (i.e., total Ba corrected for lithogenic Ba) for surface sediments from a north-south transect between the Polar Front Zone and the northern Weddell Gyre in the Atlantic sector and between the Polar Front Zone and the Antarctic continent in the Indian sector. Focus is on two different processes that affect excess Ba accumulation in the sediments: sediment redistribution and excess Ba dissolution. The effect of these processes needs to be corrected for in order to convert accumulation rate into vertical rain rate, the flux component that can be linked to export production. In the Southern Ocean a major process affecting Ba accumulation rate is sediment focusing, which is corrected for using excess 230Th. This correction, however, may not always be straightforward because of boundary scavenging effects. A further major process affecting excess Ba accumulation is barite dissolution during exposure at the sediment-water column interface. Export production estimates derived from excess Th and barite dissolution corrected Baxs accumulation rates (i.e., excess Ba vertical rain rates) are of the same magnitude but generally larger than export production estimates based on water column proxies (234Th-deficit in the upper water column; particulate excess Ba enrichment in the mesopelagic water column). We believe export production values based on excess Ba vertical rain rate might be overestimated due to inaccurate assessment of the Baxs preservation rate. Barite dissolution has, in general, been taken into account by relating it to exposure time before burial depending on the rate of sediment accumulation. However, the observed decrease of excess Ba content with increasing water column depth (or increasing hydrostatic pressure) illustrates the dependence of barite preservation on degree of saturation in the deep water column in accordance with available thermodynamic data. Therefore correction for barite dissolution would not be appropriate by considering only exposure time of the barite to some uniformly undersaturated deep water but requires also that regional differences in degree of undersatuation be taken into account.
Index Terms: 1050 Geochemistry: Marine geochemistry (4835, 4850); 4835 Oceanography: Biological and Chemical: Inorganic marine chemistry;
Keywords: excess Ba, sediment, Southern Ocean, export production
1. Introduction
[2] Numerous studies have emphasized the importance of the Southern Ocean in regulating atmospheric carbon dioxide content [Knox and McElroy, 1984; Sarmiento and Toggweiler, 1984; Siegenthaler and Wenk, 1984;
Broecker and Peng, 1989; Keir, 1990; Martin et al., 1990; Shemesh et al, 1993; Moore et al, 2000; Stephens and Keeling, 2000]. Spatiotemporal variability of oceanic primary production and related export of organic carbon to
the deep sea and the sediment were invoked as major mechanisms explaining variations of the atmospheric carbon dioxide level between glacial and interglacial Pleistocene stages [e.g., Sarmiento and Toggweiler, 1984;
Martin et al., 1990; Keir, 1990]. Controversial hypotheses were advanced, in favor [e.g., Martin, 1990; Kumar et al, 1993] or against an increased productivity during glacial periods in the Southern Ocean [e.g., François et al,
1992, 1997; Bareille et al., 1998; Frank et al., 2000]. This controversy is linked partly to the different geochemical behavior of the proxies used to reconstruct past export production. Sedimentary barite is, or is supposed to be, one of the most promising proxies. A correlation between biological productivity in surface waters and Ba, or barite content, was evidenced in recent and past marine sediments [Goldberg and Arrhenius, 1958; Church, 1979; Schmitz, 1987; Shimmield, 1992; Von Breymann et al., 1992; Gingele and Dahmke, 1994;
Frank et al., 1996; Paytan et al., 1996; Nürnberg et al., 1997]. Studies of the water column related the
abundance of suspended particulate Ba (especially composed of barite micro-crystals) to plankton activity and more precisely to the breakdown of plankton detritus [Dehairs et al., 1980, 1997; Bishop, 1988]. This link was
evidenced in the Southern Ocean by the symmetric evolution of particulate Ba and dissolved oxygen profiles and pCO2 with water depth [Dehairs et al., 1991; Stroobants et al., 1991]. These different observations suggest that barite is a suitable proxy for export production [Dymond et al., 1992; Paytan et al., 1996; Shimmield et al., 1994;
François et al., 1995; Nürnberg et al., 1997].
[3] A widely applied method for assessing export production requires the measurement of total sedimentary barium content. The excess Ba (Baxs) content, which is assumed to consist mainly of biogenic barite, is estimated by correcting for Ba of detrital origin. Baxs is only an estimate of the effective sedimentary barite content. Selective leachings on Pacific sediment trap samples emphasize that up to 50% of the Baxs might not be barite but rather Ba adsorbed or bound on organic matter and carbonates [Dymond et al., 1992]. According to
Schroeder et al. [1997] this nonbarite Baxs results from dissolved Ba being scavenged by settling particles in the
water column. At the sediment-water interface, such particles would be affected by early diagenesis with subsequent transfer of Ba to Fe oxide components of the sediments. In certain situations the use of the barite phase rather than total Baxs should be the preferred proxy tool [Schroeder et al., 1997]. Using a sequential leaching procedure [Paytan et al., 1993], Paytan et al. [1996] extracted the barite fraction from a few grams of Pacific sediment and estimated the barite accumulation rate. This rate was subsequently converted to primary production. However, the efficiency of leaching experiments on barite separation is difficult to control [Cardinal
et al., 1999; D. Cardinal, personal communication, 2000], and in many cases the amount of sample is insufficient
for a sequential leaching.
[4] Different algorithms have been proposed to quantify export production from Baxs. These algorithms reflect primarily the link between export production and particulate organic carbon (POC) flux in the deep sea (e.g.,
Sarnthein et al. [1988]; see also Bishop [1989] for a review). POC flux was subsequently substituted for Baxs
flux on the basis of the vertical evolution of POC/Baxs ratio in particulate matter sinking through the water column [Dymond et al., 1992; François et al., 1995; Frank, 1996; Nürnberg et al., 1997], a procedure linking Baxs flux in the water column or Baxs flux arriving at the sediments (vertical rain rate (VRR)) to export production. The situation is, however, complicated in that the POC/Baxs evolution through the water column has been proposed to depend on sampling depth and on dissolved Ba content in intermediate and deep waters [Dymond et al., 1992] or on sampling depth only [François et al., 1995].
[5] In the present study, we report the latitudinal distribution of Baxs in sediments underlying different hydrodynamic entities of the Atlantic and Indian sectors in the Southern Ocean, characterized by different present-day productivity levels. The discussion will focus on the corrections that have to be applied to reconstruct export productivity from sediment Baxs.
2. Site Description
[6] The positions of the circumpolar frontal systems are determined by the different flow regimes of the Antarctic Circumpolar Current [Orsi et al., 1995]. The main current jets within the eastward flowing Antarctic Circumpolar Current are associated with the Subantarctic Front and the Polar Front. For the Atlantic sector a third frontal system, farther south, coincides with the Antarctic Circumpolar Current-Weddell Gyre Boundary [Peterson and Stramma, 1991 ; Smetacek et al., 1997]. For the Atlantic sector the sampled areas covered the Polar Front Zone (PFZ) and the Antarctic Zone. The former zone extends between the Subantarctic Front and the Polar Front and is characterized by large mesoscale variability due to meandering of the fronts and to eddy formation [Veth et al., 1997]. The Antarctic Zone represents the region between the southern edge of the Polar Front and the northern limit of the Weddell Gyre. For the Indian sector the sampled areas covered the Subantarctic Zone (SAZ; i.e., the region between the Subtropical Front and the Subantarctic Front), the PFZ, and the Antarctic Zone, with the latter representing the region between Polar Front and Antarctic slope. The Antarctic Zone can, in general, be subdivided into a permanent ice-free zone (permanently open ocean zone, or POOZ) and a seasonal ice zone (SIZ).
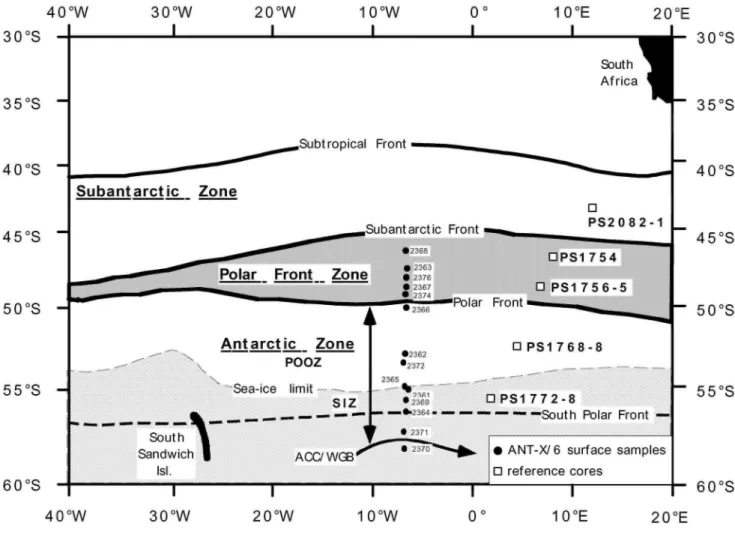
[7] In the Atlantic sector, 14 box core samples (Figure 1a and Table 1) were recovered during R/V Polarstern cruise ANT X/6 (October-November 1992) between 46° and 58°S along 6°W [Bathmann et al., 1997]. This transect crossed the Polar Front Zone, the Antarctic Zone, and the Antarctic Circumpolar Current-Weddell Gyre Boundary, south of 58°S [Veth et al., 1997]. A fourth frontal system, the Southern Polar Front, was identified close to 56°45'S and coincided with the axis of the America-Antarctic Ridge [Veth et al., 1997]. During the ANT X/6 cruise the maximal winter extent of the sea ice cover reached 55°S. The biomass and primary productivity remained low and constant (<0.2 µg Chl a and 80-260 mg C m-2 d-1, respectively) during October-November in the ice-free Antarctic Zone. In contrast, the region influenced by the meandering of the Polar Front had a high primary productivity (up to 2900 mg C m-2 d-1 ) [Bathmann et al., 1997] with a large contribution of diatoms
[Quéguiner et al., 1997]. Smear slide observations showed that the main sediment components were diatoms, foraminifera, detrital grains, clay aggregates, and accessory volcanic glasses. The sediments were dominated by diatomaceous muds, except for three foraminifera-dominated samples (PS2374, PS2372, and PS2364).
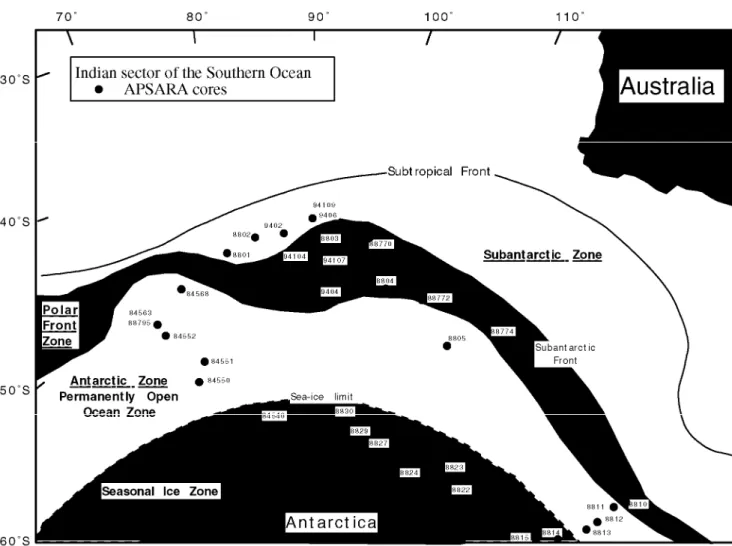
[8] For the Indian sector (Figure lb) we analyzed 35 box core and Kullenberg core samples from the area between the Subantarctic Front and the Antarctic slope (between 44.7° and 65°S, Table 2), collected during the French APSARA cruises (R/V Marion Dufresne [Bareille, 1991; Bareille et al., 1991]). The plankton communities in surface waters are dominated by calcium carbonate-secreting plankton in the Subtropical and Subantarctic Zones, while diatoms dominate the community south of the Polar Front [Bareille et al., 1998]. The lithology of the sediments reflects this distribution, with foraminiferal oozes in the northern part of the transect and diatomaceous oozes south of the Polar Front.
3. Methods
[9] Al was analyzed by inductively coupled plasma-atomic emission spectrometry (ICP-AES; ARL 35000C) on an alkaline fusion (lithium metaborate, Baker, Reagent Grade) of 100 mg of dry homogenized sediment. An artificial standard solution (Titrisol-Merck) was used for calibration. Accuracy, determined using international standard reference rocks, was 10% [Navez, 1985].
[10] For other elements (Ti, Ca, Sr, Zr, Ba, Nd, and Th) the sediment was digested in a Teflon bomb using concentrated acids (4 g HF and 1g HNO3). Teflon bombs were left under pressure at 180°C for three nights. After adding 1.5 g HClO4, the solution was evaporated close to dryness. The residue was dissolved with 3 g HNO3 and evaporated close to dryness again. This step was repeated two to three times until the solution appeared clear under 10 times magnifying glass (i.e., complete dissolution). The elemental concentrations were measured with an inductively coupled plasma-mass spectrometer (ICP-MS, VG PlasmaQuad PQ2 Plus). Accuracy determined on artificial solutions and international standard reference rocks was better than 5%. The quantitative detection limit for solutions, set at 10 times the standard deviation on the blanks analyzed during the same run, was, on average, between 10 and 100 parts per trillion (ppt) for the trace elements. Taking into account the dilution factor, the detection limit, in terms of equivalent concentration in the sediment sample, ranged between 25 and 250 ppb (ng g-1 ).
[11] Baxs is defined as being the total Ba in the sediment minus the Ba associated with the detrital component. This detrital fraction was estimated from measured total Al content and a reference upper crustal Ba/Al ratio of 0.0067 (average value calculated from Taylor and McLennan [1985]), assuming that all Al was associated with the detrital fraction and that the reference Ba/Al ratio is representative for the detrital fraction in these sediments. This simplistic approach partitions Ba into a biogenic and a detrital phase, but other Ba components might be relevant [Dymond et al., 1992; Schroeder et al, 1997]. The use of Al as the crustal reference element for oceanic sedimentary material was questioned by Murray and Leinen [1996], who showed that a significant component of Al can be scavenged from seawater under regimes of high biogenic particle flux. Dymond et al. [1997] furthermore suggested diatoms were the conveyors of this excess Al signal. Because of this, Ti has been put forward as a more appropriate reference element [Murray and Leinen, 1996]. Recently, Yarincik et al. [2000] pointed out that the excess Al component has to be taken into account only in sediments with <5% terrigenous matter. Consequently, the use of Al for detrital correction remains justified in surface Southern Ocean sediments. However, in situations where the detrital component becomes predominant the choice of the crustal reference ratio has an important impact on the calculated Baxs fraction. A further concern is that reported values of Ba/Al in the lithogenic reference vary significantly, depending on the chosen reference (e.g., Ba/Alref = 0.004 (wt/wt) [Gingele and Dahmke, 1994], Ba/Alref = 0.0075 [Nürnberg et al., 1997; Dymond et al., 1992], and Ba/Alref = 0.0092 [McManus et al., 1998]). As a result, the correction for detrital Ba becomes highly unreliable in situations with high contents of lithogenic matter [Dymond et al., 1992; McManus et al., 1998]. The former authors estimate that correction of the detrital fraction is meaningful only for situations with <50% detrital Ba, but the error on this estimation rises to 50% in cases where detrital Ba approaches half of total Ba.
[12] The excess Th ( Thxs) content was measured in surface sediments from the Indian sector to quantify the post-depositional sediment redistribution. Samples were prepared by a standard method [Anderson and Fleer, 1982]. Approximately 250 mg of dried sediment was spiked with 229Th. Sediments were digested using a triacid attack including HNO3, HClO4, and HF (reagent grade). The solution was evaporated close to dryness twice, and the final residue was redissolved with concentrated HNO3 then with 2 N HC1. A 100 µL aliquot was then removed for analysis of U/ Th. Th was coprecipitated with Fe. After washings, the precipitate was dissolved in 9 N HC1 and passed through an ion exchange column (Biorad AG1-X8, 100-200 mesh, preconditioned with 9
ion exchange column preconditioned with 8 N HNO3 and then dried to a drop. The Th fraction was diluted with Milli-Q grade water just before analysis by isotope dilution on a Finnigan Mat sector field inductively coupled plasma-mass spectrometer (Element IICP-MS) at Woods Hole Oceanographic Institution. A complete ICP-MS analysis cycle included 20 s of sampling, 30 s of analysis, and 3 min of rinsing with a 10% HNO3 solution to minimize memory effects. Acid blanks were analyzed prior to each sample, and counts were subtracted from sample counts whenever exceeding 1 % of the latter. The drift in the mass discrimination effect was controlled by repeated analysis of a standard solution of known isotopic composition. A tailing correction of the Th on mass 230 was performed when necessary.
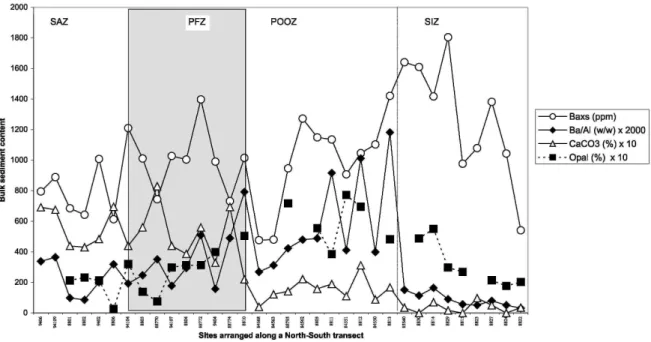
Figure 1a: Map showing the location of the sampled sites (solid circles) and the reference cores (open squares)
studied by Frank et al. [1996] in the Atlantic sector of the Southern Ocean. The present-day positions of the oceanographic fronts are based on Peterson and Stramma [1991] and Veth et al. [1997]. The dashed area indicates the northernmost extent of sea ice cover [Veth et al, 1997]. The dark shaded area indicates the position of the Polar Front Zone.
4. Results
4.1. Atlantic Sector of the Southern Ocean
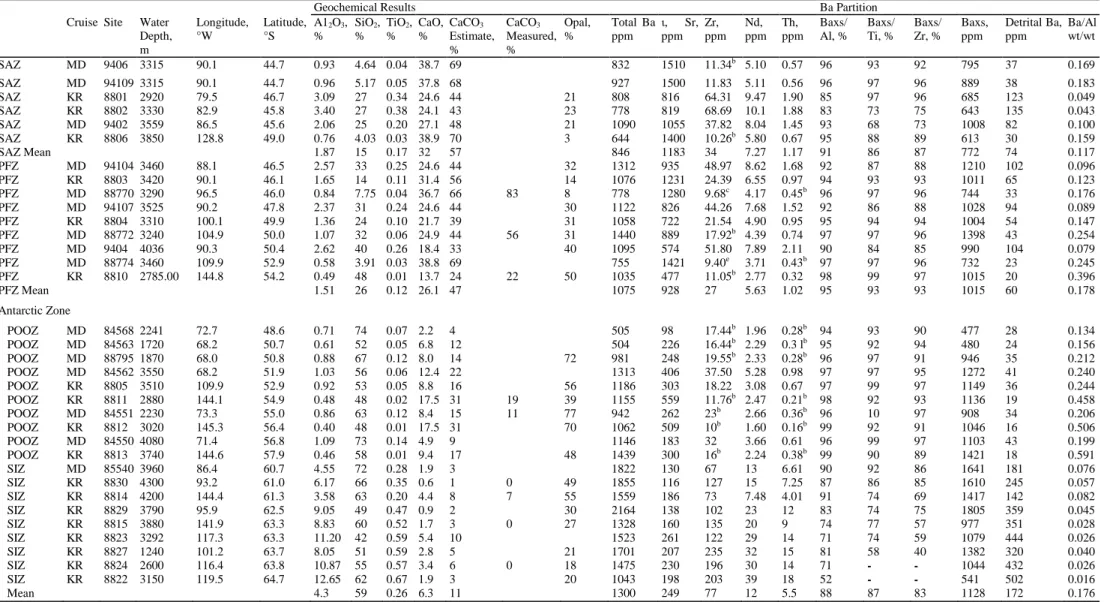
[13] The total barium content in the surface sediments along 6°W ranges between ~240 and ~1600 ppm (Table 1). The highest values occur in the Antarctic Zone, and the lowest ones coincide with the location of the Polar Front and the Southern Polar Front (Figure 2a). Baxs varies widely, from representing >98% of total Ba in the Antarctic Zone to only 10% close to the sea ice edge. Baxs represents, on average, >80% of total Ba in the Polar Front Zone (88%) and the Antarctic Zone (82%). In the Weddell Gyre Zone, Baxs represents only 50% of the total Ba. The use of Ti or Zr as normative elements does not significantly change the estimates of Baxs, except in two samples where the detrital Ba reaches 50% or more (Table 1; see section 3). The detrital Ba content varies by a factor of 10 across the transect (from 20 to 240 ppm), with its lowest contribution in the POOZ. Zr and Nd display a similar latitudinal profile (Figure 2a).
Figure 1b: Map showing the location of the sediment sampling sites in the Indian sector of the Southern Ocean. The present-day position of the oceanographic fronts are from Bareille [1991] and Bareille et al. [1991]. The dashed area limits the oceanic zone covers by ice. The dark shaded area highlights the position of the Polar Front Zone.
[14] Baxs is sensitive to changes in sediment composition. No overall correlation is observed between Baxs and CaCO3 (Table 1), but three negative excursions (PS2374, PS2372, and PS2364) of Baxs coincide with carbonate contents >50% (Figure 2b) and suggest a local dilution of Baxs by carbonate phases. To avoid compositional dilution effects, Baxs should be converted into Baxs accumulation rate. The mass accumulation rates were not measured along this transect, but they are known to show large spatial variability in the southern Antarctic Zone (from 5 to 50 cm kyr-1 [Charles et al., 1991; Anderson et al., 1998]). Since contents of Ba and Al would be equally affected by dilution with a third component, variation of the Ba/Al ratio would reflect variation of Baxs that is unaffected by compositional dilution. Therefore it is more appropriate to report the latitudinal distribution of Baxs/Al (wt/wt) ratio (Figure 2b), rather than that of Baxs. The lowest Ba/Al ratio observed at the South Polar Front (0.006, 56°S) is close to the reference post-Archan Australian Shales (PAAS) value [Taylor and
McLennan, 1985], indicating that nearly all the Ba is lithogenic at this location. The Ba/Al ratio increases by up
to a factor of 80 and reaches its highest value (0.47) in the POOZ. The pattern of the Ba/Al profile emphasizes the contrast between the POOZ and the adjacent zones. The POOZ clearly displays Ba/Al ratios up to 10 times higher than those observed for the PFZ and the SIZ.
4.2. Indian Sector of the Southern Ocean
[15] Sampling sites are distributed between the Subantarctic Zone and the Antarctic slope area (Figure 1b). Results are reported by hydrodynamic province and according to latitude within each province (Table 2). The total Ba content varies between ~500 and ~2200 ppm with the highest values measured in the seasonal ice zone (Figure 3a). Note that the lowest Ba values in the POOZ correspond to cores MD84568 and MD84563 from sites with a shallower water column, close to Kerguelen Island. As observed for the Atlantic sector, most of the Ba is
Baxs (52-99%; Table 2). The detrital Ba content is low from the Subantarctic Zone to SIZ. It then increases significantly through the SIZ to reach 140-500 ppm in the vicinity of the Antarctic slope. Zr, Nd, and Th also display a significant increase south of 60°S. The lowest fractions of Baxs (down to 40%) are observed south of 60°S in the SIZ and coincide with the highest contents of detrital Ba (142-502 ppm; Table 2). Highest carbonate contents occur north of the Polar Front. Carbonate contents decrease southward to values as low as 1% in the SIZ (Figure 3b). The Baxs pattern cannot result from dilution with carbonates since Baxs and carbonates are not correlated (r2 = 0.20; Table 2). For the Indian sector sediments the Baxs accumulation rates could be estimated for each sample using the mass accumulation rate deduced from the local linear sedimentation rate and the measured dry bulk density [Bareille, 1991 ;Bareille et al., 1991, 1998]. However, accumulation rates may be affected by sediment reworking (focusing and winnowing). These impacts will be discussed in section 5.2. [16] The Ba/Al ratios range from 0.016 to 0.591, with highest values recorded in the POOZ, also characterized by the highest opal content (Figure 3b and Table 2). The pattern of the Ba/Al ratio does not follow the latitudinal trend of the Baxs, emphasizing a compositional dilution effect on the Baxs in the Indian sector of the Southern Ocean.
Table 1: Major and Trace Element Data for Bulk Sediments From Surface Samples of the Atlantic Sector of the
Southern Oceana
aThe estimated carbonate content (CaCO
3 Estimate) was based on an estimated stoichiometric amount of CO2 assuming that all the measured
CaO is due to carbonate. The barite fraction was defined by the excess Ba fraction. This biogenic Ba fraction is estimated from the bulk sediment composition using Al as a detrital reference with a Ba/Al ratio of 0.0067 [Taylor and McLennan, 1985]. The values obtained by applying other normalization elements (Ti and Zr) are also calculated. For comparison with crustal reference the Ba/Al (wt/wt) ratio of each sediment sample is reported. PFZ, Polar Front Zone; POOZ, permanently open ocean zone; SIZ, seasonal ice zone; WGZ, Weddel Gyre Zone.
Geochemical Results Ba Partition Site Water Depth, m Latitude, °S A12O3, % TiO2, % CaO, % CaCO3 Estimate, % Total Ba, ppm Sr, ppm Zr, ppm Nd, ppm Th, ppm Baxs/Al, % Baxs/Ti, % Baxs/Zr, % Baxs, ppm Detrital Ba, ppm Ba/Al, wt/wt PFZ PS2368 3756 46.5 3.0 0.16 32.0 57 935 894 37 7.5 2.1 89 89 88 832 103 0.060 PFZ PS2363 4040 48.0 4.7 0.26 12.9 23 1026 311 88 8.9 2.7 84 83 73 860 166 0.041 PFZ PS2376 4091 48.3 2.7 0.15 19.1 34 1365 562 37 7.1 2.0 93 93 92 1272 93 0.097 PFZ PS2367 3715 49.0 2.6 0.12 18.8 34 1158 572 47 6.0 1.7 92 93 87 1068 90 0.085 PFZ PS2374 2347 49.6 3.3 0.21 33.8 60 573 309 34 5.2 1.4 80 75 81 458 115 0.033 PFZ Mean 3.2 0.2 23.3 42 1011 530 49 6.9 2.0 88 87 84 898 113 0.063 Antarctic Zone POOZ PS2366 2060 50.6 0.54 0.03 8.7 16 963 690 10 2.1 0.34 98 98 97 944 19 0.337 POOZ PS2362 2688 53.0 0.56 0.03 14.9 27 1388 480 14 2.5 0.55 99 98 97 1368 20 0.468 POOZ PS2372 2341 53.6 2.2 0.14 28.7 51 1079 264 18 3.2 0.65 93 91 95 1004 75 0.095 POOZ PS2365 3117 55.0 0.89 0.06 4.6 8 1441 428 19 2.0 0.56 98 97 96 1410 31 0.306 SIZ PS2361 3194 55.0 1.1 0.06 5.4 10 1588 190 20 2.3 0.61 98 97 96 1550 38 0.275 SIZ PS2369 4059 55.5 9.4 0.51 7.7 14 956 150 76 6.7 1.9 66 65 75 628 328 0.019 SIZ PS2364 4156 56.0 8.1 0.46 29.5 53 243 297 32 5.7 1.2 12 - 59 28 215 0.006 SIZ PS2371 3660 57.0 3.1 0.18 2.7 5 1193 113 33 3.1 1.1 91 90 92 1083 110 0.072 Mean 3.2 0.19 12.8 23 1106 326 28 3.4 0.9 82 91 88 1002 104 0.197 WGZ PS2370 5039 58.3 11.6 0.75 8.2 15 827 152 65 9.0 3.2 51 40 76 421 406 0.013
Table 2: Major and Trace Element Data for Bulk Sediments From Surface Samples of the Indian Sector of the Southern Oceana
Geochemical Results Ba Partition
Cruise Site Water Depth, m Longitude, °W Latitude, °S A12O3, % SiO2, % TiO2, % CaO, % CaCO3 Estimate, % CaCO3 Measured, % Opal, % Total Ba ppm ι, Sr, ppm Zr, ppm Nd, ppm Th, ppm Baxs/ Al, % Baxs/ Ti, % Baxs/ Zr, % Baxs, ppm Detrital Ba, ppm Ba/Al wt/wt SAZ MD 9406 3315 90.1 44.7 0.93 4.64 0.04 38.7 69 832 1510 11.34b 5.10 0.57 96 93 92 795 37 0.169 SAZ MD 94109 3315 90.1 44.7 0.96 5.17 0.05 37.8 68 927 1500 11.83 5.11 0.56 96 97 96 889 38 0.183 SAZ KR 8801 2920 79.5 46.7 3.09 27 0.34 24.6 44 21 808 816 64.31 9.47 1.90 85 97 96 685 123 0.049 SAZ KR 8802 3330 82.9 45.8 3.40 27 0.38 24.1 43 23 778 819 68.69 10.1 1.88 83 73 75 643 135 0.043 SAZ MD 9402 3559 86.5 45.6 2.06 25 0.20 27.1 48 21 1090 1055 37.82 8.04 1.45 93 68 73 1008 82 0.100 SAZ KR 8806 3850 128.8 49.0 0.76 4.03 0.03 38.9 70 3 644 1400 10.26b 5.80 0.67 95 88 89 613 30 0.159 SAZ Mean 1.87 15 0.17 32 57 846 1183 34 7.27 1.17 91 86 87 772 74 0.117 PFZ MD 94104 3460 88.1 46.5 2.57 33 0.25 24.6 44 32 1312 935 48.97 8.62 1.68 92 87 88 1210 102 0.096 PFZ KR 8803 3420 90.1 46.1 1.65 14 0.11 31.4 56 14 1076 1231 24.39 6.55 0.97 94 93 93 1011 65 0.123 PFZ MD 88770 3290 96.5 46.0 0.84 7.75 0.04 36.7 66 83 8 778 1280 9.68c 4.17 0.45b 96 97 96 744 33 0.176 PFZ MD 94107 3525 90.2 47.8 2.37 31 0.24 24.6 44 30 1122 826 44.26 7.68 1.52 92 86 88 1028 94 0.089 PFZ KR 8804 3310 100.1 49.9 1.36 24 0.10 21.7 39 31 1058 722 21.54 4.90 0.95 95 94 94 1004 54 0.147 PFZ MD 88772 3240 104.9 50.0 1.07 32 0.06 24.9 44 56 31 1440 889 17.92b 4.39 0.74 97 97 96 1398 43 0.254 PFZ MD 9404 4036 90.3 50.4 2.62 40 0.26 18.4 33 40 1095 574 51.80 7.89 2.11 90 84 85 990 104 0.079 PFZ MD 88774 3460 109.9 52.9 0.58 3.91 0.03 38.8 69 755 1421 9.40e 3.71 0.43b 97 97 96 732 23 0.245 PFZ KR 8810 2785.00 144.8 54.2 0.49 48 0.01 13.7 24 22 50 1035 477 11.05b 2.77 0.32 98 99 97 1015 20 0.396 PFZ Mean 1.51 26 0.12 26.1 47 1075 928 27 5.63 1.02 95 93 93 1015 60 0.178 Antarctic Zone POOZ MD 84568 2241 72.7 48.6 0.71 74 0.07 2.2 4 505 98 17.44b 1.96 0.28b 94 93 90 477 28 0.134 POOZ MD 84563 1720 68.2 50.7 0.61 52 0.05 6.8 12 504 226 16.44b 2.29 0.3 lb 95 92 94 480 24 0.156 POOZ MD 88795 1870 68.0 50.8 0.88 67 0.12 8.0 14 72 981 248 19.55b 2.33 0.28b 96 97 91 946 35 0.212 POOZ MD 84562 3550 68.2 51.9 1.03 56 0.06 12.4 22 1313 406 37.50 5.28 0.98 97 97 95 1272 41 0.240 POOZ KR 8805 3510 109.9 52.9 0.92 53 0.05 8.8 16 56 1186 303 18.22 3.08 0.67 97 99 97 1149 36 0.244 POOZ KR 8811 2880 144.1 54.9 0.48 48 0.02 17.5 31 19 39 1155 559 11.76b 2.47 0.21b 98 92 93 1136 19 0.458 POOZ MD 84551 2230 73.3 55.0 0.86 63 0.12 8.4 15 11 77 942 262 23b 2.66 0.36b 96 10 97 908 34 0.206 POOZ KR 8812 3020 145.3 56.4 0.40 48 0.01 17.5 31 70 1062 509 10b 1.60 0.16b 99 92 91 1046 16 0.506 POOZ MD 84550 4080 71.4 56.8 1.09 73 0.14 4.9 9 1146 183 32 3.66 0.61 96 99 97 1103 43 0.199 POOZ KR 8813 3740 144.6 57.9 0.46 58 0.01 9.4 17 48 1439 300 16b 2.24 0.38b 99 90 89 1421 18 0.591 SIZ MD 85540 3960 86.4 60.7 4.55 72 0.28 1.9 3 1822 130 67 13 6.61 90 92 86 1641 181 0.076 SIZ KR 8830 4300 93.2 61.0 6.17 66 0.35 0.6 1 0 49 1855 116 127 15 7.25 87 86 85 1610 245 0.057 SIZ KR 8814 4200 144.4 61.3 3.58 63 0.20 4.4 8 7 55 1559 186 73 7.48 4.01 91 74 69 1417 142 0.082 SIZ KR 8829 3790 95.9 62.5 9.05 49 0.47 0.9 2 30 2164 138 102 23 12 83 74 75 1805 359 0.045 SIZ KR 8815 3880 141.9 63.3 8.83 60 0.52 1.7 3 0 27 1328 160 135 20 9 74 77 57 977 351 0.028 SIZ KR 8823 3292 117.3 63.3 11.20 42 0.59 5.4 10 1523 261 122 29 14 71 74 59 1079 444 0.026 SIZ KR 8827 1240 101.2 63.7 8.05 51 0.59 2.8 5 21 1701 207 235 32 15 81 58 40 1382 320 0.040 SIZ KR 8824 2600 116.4 63.8 10.87 55 0.57 3.4 6 0 18 1475 230 196 30 14 71 - - 1044 432 0.026 SIZ KR 8822 3150 119.5 64.7 12.65 62 0.67 1.9 3 20 1043 198 203 39 18 52 - - 541 502 0.016 Mean 4.3 59 0.26 6.3 11 1300 249 77 12 5.5 88 87 83 1128 172 0.176 a
The estimated carbonate content (CaCO3 Estimate) was based on an estimated stoichiometric amount of CO2 assuming that all the measured CaO is due to carbonate. Such assumption leads in general to an overestimation
of the real carbonate content. The estimation is controlled by direct measurements of the carbonate content (CaCO3 Measured) based on ignition loss on a few samples (data from Bareille [1991] and Bareille et al. [1991]).
Figure 2a: Ba (total, excess, or detrital fraction), Zr, and Nd content in surface sediments along a north-south
transect at 6°W in the Atlantic sector of the Southern Ocean (ANT X/6 expedition). The shaded area indicates the position of the Polar Front Zone. Data are from Table 1.
Figure 2b: Excess Ba, carbonate content, and Ba/Al (wt/wt) ratio in surface sediments from the north-south
transect at 6°W across the Atlantic sector of the Southern Ocean (ANT X/6 expedition). The comparison of Baxs pattern and Ba/Al ratio help to identify any dilution of Baxs due to a change of sedimentary composition. Note that there is no systematic dilution of Baxs content by carbonates, except in three carbonate-rich samples (PS2374, PS2372, and PS2364).
Figure 3a: Ba (total, excess, or detrital fraction), Zr, and Nd content in surface sediments collected across the
Indian sector of the Southern Ocean. The shaded area corresponds to the Polar Front Zone.
Figure 3b: Excess barium, carbonate content, opal content, and Ba/Al (wt/wt) ratio in surface sediments from
the Indian sector of the Southern Ocean. The shaded area corresponds to the Polar Front Zone. Note the absence of an obvious relationship between carbonate or opal content and Baxs. However, the high mean carbonate content in the northern part of the transect coincides with the lowest mean Baxs content. The Ba/Al ratio pattern is different from the Baxs pattern, emphasizing some compositional dilution of Baxs.
Figure 4a: Excess Ba content reported as a function of the water column depth for the Atlantic sector of the
Southern Ocean. Data are from Table 2. For the samples deeper than 2500 m water depth the Baxs content decreases with increasing water depth. This may reflect a higher dissolution of barite crystals in progressively undersaturated waters.
5. Discussion
[17] Unlike margin environments where redox conditions and/ or advection of detrital materials may limit the use of sedimentary Baxs as a proxy of export production [e.g., Brumsack, 1989; Von Breymann et al., 1992;
Dymond et al., 1992; McManus et al., 1994], Baxs appears to be a promising tracer of export production in open
ocean systems [e.g., Nürnberg et al., 1997; Gingele and Dahmke, 1994]. It was suggested by François et al. [1995] that the higher dissolved Ba contents in intermediate and deep waters probably do not affect the water column Baxs flux, as originally suggested by Dymond et al. [1992]. We will consider therefore only the François et al. and Nürnberg et al. approaches. Export production P may be estimated as a function of the water column Baxs flux (FBaxs in g cm-2 yr-1) and water depth Z (in m) ((1), from Nürnberg et al. [1997]) or only as a function of the Baxs flux with no dependence on depth ((2), from François et al. [1995]):
where E is export.
[18] Both equations are conceptually related [see François et al., 1995; Nürnberg, 1995] and give similar results. Equation (2) is a simplification of (1) and implies annual average Baxs fluxes remain constant with depth. This approach assumes that there is no advective supply of Baxs. Widespread occurrence of reducing conditions in margin environments would dissolve barite [François et al., 1995; Von Breymann et al., 1992], and as a consequence, possible horizontal advective fluxes would be devoid of barite. This assumption, however, has recently been invalidated. In a study on Ba fluxes in a NE Atlantic Margin environment, Fagel et al. [1999] observed enhanced Baxs fluxes outside the bloom period which were related with lateral advection transport carrying Baxs and lithogenic particles to the sampling site. This observation, although of local importance, underlines the necessity to compute export production from a reasonably large time series to prevent (or at least
reduce) sporadic effects.
[19] In the present work, export production was estimated using (1) originally deduced from open ocean sediment trap data. For sediments, however, the actual accumulation rate may be different from the vertical flux. Two processes have to be corrected for in order to estimate the true vertical Baxs flux. First, the preserved Baxs accumulation rate might differ from the Baxs rain rate because of partial dissolution of barite at the seawater-sediment interface prior to burial. Second, the Baxs accumulation rate may be affected by seawater-sediment reworking as a result of bottom currents.
5.1. Dissolution of Barite at the Water Column-Sediment Interface
5.1.1. Estimation of the water column Baxs preservation rate.
[20] Application of (1) to the sedimentary environment requires that the preservation rate during exposure of the Baxs phase at the water column-sediment interface before burial is known. Dymond et al. [1992] proposed the following algorithm relating the Baxs preservation rate as a function of the sediment mass accumulation rate (AR) (in µg cm-2 yr-1 ):
where DP is degree of preservation and where MAR is mass accumulation rate. The Dymond et al. algorithm has been applied in many paleoproductivity reconstructions based on sedimentary Baxs [Gingele et al., 1999]. Its predictive capacity has been invalidated in only in a few studies, showing that preservation efficiencies could be related to diagenetic remobilization of Ba [Paytan et al., 1996; McManus et al., 1999]. For instance, recent studies [McManus et al., 1999] suggest diagenetic dissolution of barite crystals even in suboxic conditions, such as would be favored in areas of high mass accumulation. The application of (3) implies that bottom waters are undersaturated with respect to barite. In section 5.1.2, we show that a correction for dissolution through application of (4) is probably justified for most of the oceanic basins, except in shallow bottom waters south of the Polar Front.
5.1.2. Influence of the barite saturation index of bottom waters.
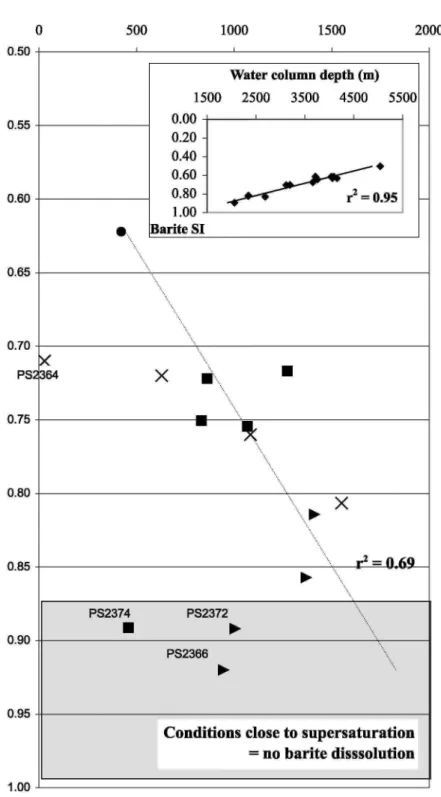
[21] For the Atlantic sector of the Southern Ocean we observed that sedimentary Baxs content decreased with increasing water depth for sites deeper than 2500 m (Figure 4a). The negative linear correlation coefficient is 0.69, if sample PS2364 is excluded. We suspect incorrect calculation of Baxs content for this sample because of a high content of the detrital phase (see section 3). While the variability in the Baxs transect (Figure 2b) is probably in part due to latitudinal variability in surface productivity and water column Baxs flux, it is probable that variable barite dissolution is also a contributing factor. In the Antarctic Zone of the Southern Ocean the barite saturation index (SI) isopleth of 0.90 (i.e., the threshold between saturation and undersaturation) stays, in general, close to the 2000 m isobath [Monnin et al, 1999]. In the vicinity of the Polar Front the regular pattern of the SI isolines is affected by abrupt seabed bathymetry changes. North of the Polar Front the whole water column is undersaturated with a barite saturation index <0.7. For the ANT X/6 transect it was noticed that the barite saturation index is negatively correlated (r2 = 0.95; Figure 4b) with hydrostatic pressure (or water column height) whatever the hydrodynamic zone (C. Monnin, unpublished results, 2000). This regression was used to calculate the barite saturation index for all surface sediment sampling sites (Table 3). For SI < 0.89, Baxs in surface sediments decreases with decreasing barite saturation index (r2 = 0.69; Figure 4b), reflecting the effect of hydrostatic pressure. This suggests that dissolution of settled barite would be greater for a deeper seafloor. In the Indian sector, barite SI values are not available for the same location from where surface samples were taken, but they are for a north-south transect at 30°E (CIVA-1 section (C. Monnin, unpublished results)). These data show that the upper 1500-2000 m of the water column is saturated with respect to barite with SI values ranging between 0.9 and 1.1, as observed for the 6°W transect. Thermodynamic calculations thus suggest that south of the Polar Front, barite should not dissolve at the sediment-water interface for a water column shallower than 2500 m.
5.1.3. Preservation rate.
[22] In the Atlantic sector, two sites in the POOZ underlie a relatively shallow water column (<2500 m) and are characterized by a high barite SI (≥~0.90; Table 3). At these sites, settled barite could thus be totally preserved, provided conditions of oxicity and saturation within the sediment favor barite integrity. In the Indian sector, two samples from shallower areas in the POOZ may also be unaffected by barite dissolution (Table 4).
[23] For all the other (deeper) sites the preservation rates are estimated using (4). In the Indian sector the preservation rates vary between 35 and 61%, using measured mass accumulation rates (Table 4). The SIZ is characterized by the lowest preservation rates. Frank [1996] reported similar preservation rates, ranging from ~40 to 60% for a NNE-SSW 4°-12°E transect in the Atlantic sector (PFZ, 41-45% for MAR = 1-1.56 mg cm-2 yr-1; POOZ, 56-60% for MAR = 5-8 mg cm-2 yr-1; SIZ, 37-39% for MAR = 0.65-0.73 mg cm-2 yr-1). We will assume that the preservation rates obtained for the nearby NNE-SSW transect studied by Frank et al. apply for the ANT X/6 transect studied here.
[24] We compare the Baxs flux of a sediment trap deployed in the vicinity of the Polar Front in the Atlantic sector (PF3; 50.7°S, 5.5°E; traps at 600 and 3200 m [Nürnberg, 1995]) with the Baxs flux of the closest surface sediment (PS1756-5, water depth of 3787 m [Frank, 1996]) (Figures la and lb). The trapping efficiencies based on annual 30Th fluxes were estimated at 67 and 47% for the 600 and the 3200 m traps, respectively [Walter, 1998]. The sedimentary Baxs flux (2.1 mg cm-2 kyr-1 ) represents 64% of the Baxs flux in the 3200 m trap (3.3 mg cm-2 kyr-1) and 92% of the flux in the 600 m trap (2.3 mg cm-2 kyr-1).
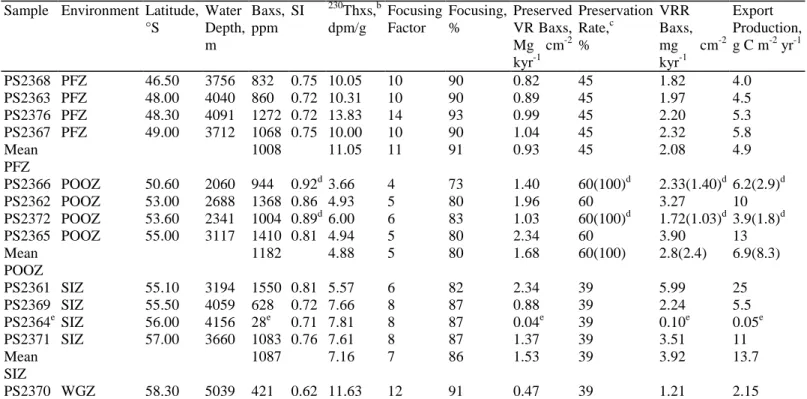
Table 3: Export Production Estimates for the Surface Sediments in the Atlantic Sector of the Southern Ocean
Using ANT X/6 Dataa
Sample Environment Latitude, °S Water Depth, m Baxs, ppm SI 230Thxs,b dpm/g Focusing Factor Focusing, % Preserved VR Baxs, Mg cm-2 kyr-1 Preservation Rate,c % VRR Baxs, mg cm-2 kyr-1 Export Production, g C m-2 yr-1 PS2368 PFZ 46.50 3756 832 0.75 10.05 10 90 0.82 45 1.82 4.0 PS2363 PFZ 48.00 4040 860 0.72 10.31 10 90 0.89 45 1.97 4.5 PS2376 PFZ 48.30 4091 1272 0.72 13.83 14 93 0.99 45 2.20 5.3 PS2367 PFZ 49.00 3712 1068 0.75 10.00 10 90 1.04 45 2.32 5.8 Mean PFZ 1008 11.05 11 91 0.93 45 2.08 4.9 PS2366 POOZ 50.60 2060 944 0.92d 3.66 4 73 1.40 60(100)d 2.33(1.40)d 6.2(2.9)d PS2362 POOZ 53.00 2688 1368 0.86 4.93 5 80 1.96 60 3.27 10 PS2372 POOZ 53.60 2341 1004 0.89d 6.00 6 83 1.03 60(100)d 1.72(1.03)d 3.9(1.8)d PS2365 POOZ 55.00 3117 1410 0.81 4.94 5 80 2.34 60 3.90 13 Mean POOZ 1182 4.88 5 80 1.68 60(100) 2.8(2.4) 6.9(8.3) PS2361 SIZ 55.10 3194 1550 0.81 5.57 6 82 2.34 39 5.99 25 PS2369 SIZ 55.50 4059 628 0.72 7.66 8 87 0.88 39 2.24 5.5 PS2364e SIZ 56.00 4156 28e 0.71 7.81 8 87 0.04e 39 0.10e 0.05e PS2371 SIZ 57.00 3660 1083 0.76 7.61 8 87 1.37 39 3.51 11 Mean SIZ 1087 7.16 7 86 1.53 39 3.92 13.7 PS2370 WGZ 58.30 5039 421 0.62 11.63 12 91 0.47 39 1.21 2.15
a Sample PS2364 has not been taken into account to calculate the mean export production value. The barite saturation index has been
calculated for each sample depth according to the regression line between SI and water depth shown in Figure 4b.
bData are from Walter et al. [1997]. c
Estimation is from Frank et al. [1996]. d
For two samples in the POOZ, two estimates of export production are reported: the first value took into account the Dymond et al. [1992] algorithm for calculation of the preservation rate, and the second value (in parentheses) assumed a 100% preservation rate. See text for explanation.
Figure 4b: Excess Ba content reported as a function of the local barite saturation index (SI). Barite saturation index was calculated from the regression line with water column depth shown in the insert. The thermodynamic calculation of the barite saturation index is based on ANT X/6 data (C. Monnin, unpublished results). Barite should not dissolve in waters having a barite SI ≥ ~0.90 (shaded area). See text for explanation.
5.2. Influence of Sediment Focusing
[25] It has been suggested that the highest mass accumulation rates result from lateral advection of sediment induced by strong abyssal currents, a common situation in the Southern Ocean [François et al., 1993; Kumar, 1994; Frank et al., 1996]. In the vicinity of the ANT X/6 transect, Frank et al. [1996] observed large discrepancies between MAR and VRR estimated from Th and 231Pa fluxes. They interpreted this discrepancy as evidence of sediment focusing. The effect of postdepositional sediment redistribution on Baxs accumulation can be corrected for by normalizing Baxs fluxes to excess Th activity in sediments as follows [François et al., 1993]:
where PBaxsRR is preserved Baxs rain rate, ρ is production of 230Th in the water column, equal to 2.63 disintegration per minute (dpm) cm-2 kyr-1 for a 1000 m water column, Z is water column height (in km), [Baxs] is measured Baxs content in the surface sediment (in ppm), and [230Thxs] is measured activity in the surface sediment (in dpm g-1). This method is based on the assumption of a constant flux of Th to the sediment in balance with the rate of Th production in the overlying water column. It does not take into account possible Th removal due to lateral transport (i.e., boundary scavenging). François et al. [1997] estimated the accuracy of the reconstructed fluxes at 40% owing to this boundary scavenging effect.
5.2.1. Atlantic sector.
[26] Excess 230Th activity has been measured for the ANT X/6 surface samples [Walter et al., 1997] (Table 3). The highest excess 230Th activity values are reported for the PFZ (mean of 11.05 dpm g-1) and the Weddell Gyre Zone (11.63 dpm g-1). The POOZ is characterized by the lowest excess Th activities (mean of 4.88 dpm g-1), but these are highly variable. Such excess 230Th activities indicate that 73-93% of the mass accumulation rate is accounted for by sediment focusing (4 < focusing factor <14). Frank [1996] reported a similar impact of sediment reworking along their nearby NNE-SSW 4°-12°E transect (Figure la; focusing effect on MAR ranges from 76 to 96% in the SAZ).
[27] For the ANT X/6 transect the preserved rain rate of Baxs obtained from (5) varies by a factor of 5, from a minimum of 0.5 mg cm-2 kyr-1 in the Weddell Gyre Zone up to 2.3 mg cm-2 kyr-1 in the Antarctic Zone (Table 3). The POOZ is characterized by the highest mean value of preserved vertical Baxs flux (1.7 mg cm-2 kyr-1 ), a value slightly higher than the mean SIZ value (1.5 mg cm-2 kyr-1) but nearly twice as large (1.8) as the PFZ value (0.9 mg cm-2 kyr-1). For the nearby NNE-SSW transect studied by Frank [1996], estimates of preserved Baxs fluxes are systematically higher than our estimates (1.5 mg cm-2 kyr-1 for PFZ, 2.50 mg cm-2 kyr-1 for POOZ, and 0.7 mg cm-2 kyr-1 for SIZ), but the Baxs flux ratio between POOZ and PFZ is similar (1.7 mg cm-2 kyr-1). Because of their proximity we expect the accuracy of the Th corrections to be similar for the two transects.
Table 4: Export Production Estimates for the Surface Sediments in the Indian Sector of the Southern Ocean
Using APSARA DATAa
Sample Environment Water Depth, m Baxs, ppm Dry Bulk Density, g cm-3 LSR, cm kyr-1 MAR, mg cm-2 yr-1 230 Thxs,
dpm g-1 Focusing Factor Focusing, % Preserved VRR
Baxs, mg cm-2 kyr-1 Preservation Rate, % VRR Baxs, mg cm-2 kyr-1 Export Production, g C m-2 yr-1 MD 9406 SAZ 3315 799 0.95 4.2 4.0 7.28 3.3 71 0.96 54 1.77 3.9 MD 94109 SAZ 3315 893 0.95 4.2 4.0 7.28 3.3 71 1.07 54 1.98 4.7 KR 8801 SAZ 2925 698 0.58 4.5 2.6 5.19 1.8 45 1.03 50 2.07 5.0 KR 8802 SAZ 3480 657 0.51 10 5.1 9.17 5.1 81 0.66 56 1.17 2.1 MD 9402 SAZ 3572 1017 0.66 13.3 8.8 9.93 9.3 90 0.96 61 1.57 3.3 Mean SAZ 7.2 4.9 7.77 4.6 72 0.94 55 1.7 3.8 MD 94104 PFZ 3460 1221 0.62 11.7 7.2 NMb 10.0 90b 0.88 59 1.49 3.0 KR 8803 PFZ 3400 1018 0.72 5.2 3.7 NMb 3.3 70b 1.14 53 2.13 5.2 MD 88770 PFZ 3290 748 0.68 6.8 4.6 NMb 3.3 70b 1.04 55 1.88 4.3 MD 94107 PFZ 3525 1038 0.69 8.3 5.7 9.85 6.1 84 0.98 57 1.71 3.7 KR 8804 PFZ 3350 1010 0.46 6.9 3.2 3.17 1.2 17 2.80 52 5.40 21 MD 88772 PFZ 3240 1402 0.46 5.8 2.7 7.99 2.5 62 1.50 50 2.97 8.6 MD 9404 PFZ 4036 1002 0.51 4.6 2.3 11.9 2.6 63 0.89 49 1.82 4.0 MD 88774 PFZ 3330 735 0.26 25 6.4 6.86 5.0 81 0.94 58 1.61 3.4 Mean PFZ 10.1 4.1 7.95 3.5 61 1.42 54 2.4 6.7 MD 88795 POOZ 1950c 950 0.32 5.8 1.9 24.9 9.2 90 0.20 47(100)c 0.41(0.20)c 0.47(0.15)c KR 8805 POOZ 3510 1153 2.6d NMb 10 90b 0.30 50 0.60 0.77 MD 84551 POOZ 2230c 911 0.29 11.5 3.3 NMb 2.5 60b 1.22 52(100)c 2.33(1.22)c 6.2(2.3)c Mean POOZ 13.1 3.9 13.2 6.0 76 0.81 47(100) 1.1(0.67) 2.5(1.1) KR 8815 SIZ 3880 1014 0.53 2.2 1.2 6.82 0.8 -19 1.52 43 3.55 11 KR 8822 SIZ 3140 594 0.53 3.2 1.7 1.65 0.3 -182 2.97 46 6.42 27 Mean SIZ 6.2 2.3 7.24 2.4 -42 1.77 45 5.0 19
aDry bulk density and linear sedimentation rates are from Bareille [1991] and Bareille et al. [1991]. NM, not measured. b
Data provided by L. Dezileau [see Dezileau et al., 2000]. c For two samples in the POOZ, two estimates of export production are reported: the first value took into account the Dymond et al. [1992] algorithm for calculation of the preservation rate, and the second value (in parentheses) assumed a 100% preservation rate.
dThe mass accumulation rate was not determined for sample KR8805. We use for calculation the value of 2.6 mg cm-2 yr-1, i.e., the mean
MAR value of the two samples recovered in the POOZ area.
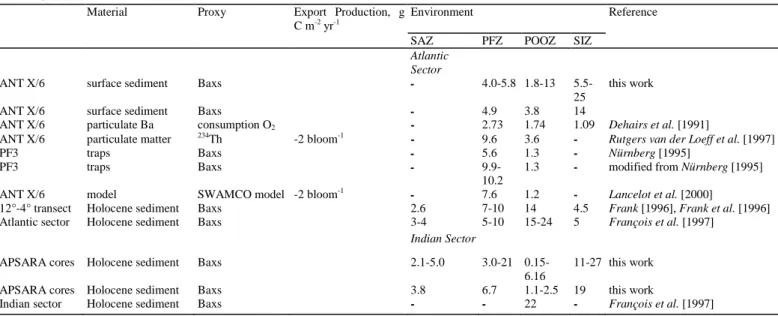
Table 5: Comparison of Export Production Estimates for the Atlantic and the Indian Sectors of the Southern
Ocean
Material Proxy Export Production, g C m-2 yr-1
Environment Reference
SAZ PFZ POOZ SIZ
Atlantic Sector
ANT X/6 surface sediment Baxs - 4.0-5.8 1.8-13 5.5-25
this work ANT X/6 surface sediment Baxs - 4.9 3.8 14
ANT X/6 particulate Ba consumption O2 - 2.73 1.74 1.09 Dehairs et al. [1991]
ANT X/6 particulate matter 234Th -2 bloom-1 - 9.6 3.6 - Rutgers van der Loeff et al. [1997]
PF3 traps Baxs - 5.6 1.3 - Nürnberg [1995]
PF3 traps Baxs -
9.9-10.2
1.3 - modified from Nürnberg [1995] ANT X/6 model SWAMCO model -2 bloom-1
- 7.6 1.2 - Lancelot et al. [2000]
12°-4° transect Holocene sediment Baxs 2.6 7-10 14 4.5 Frank [1996], Frank et al. [1996]
Atlantic sector Holocene sediment Baxs 3-4 5-10 15-24 5 François et al. [1997] Indian Sector
APSARA cores Holocene sediment Baxs 2.1-5.0 3.0-21 0.15-6.16
11-27 this work APSARA cores Holocene sediment Baxs 3.8 6.7 1.1-2.5 19 this work
Indian sector Holocene sediment Baxs - - 22 - François et al. [1997]
5.2.2. Indian sector.
[28] The spatial heterogeneity of the mass accumulation rates (from 0.5 to 8.8 mg cm-2 yr-1 ; Table 4) reflects sediment reworking processes. For the APSARA sediments we estimated the magnitude of the sediment redistribution via 230Thxs correction (Table 4). The reported Thxs activity does not take into account any age correction. The 230Thxs activity displays a larger range of variation (1.65-24.9 dpm g-1) than observed for the Atlantic sector, reflecting partly the wide geographical distribution of the samples. Lateral advection accounts for 17-90% of the measured MAR (1.2 < focusing factor < 10). For the POOZ our estimate of sediment focusing
impact on MAR (60-90%) is in agreement with values (70-90%) reported by François et al. [1997] for the same general area. It appears that the highest measured accumulation rates in cores MD9402 and MD94104 (7.2-8.8 mg cm-2 yr-1) are primarily due to sediment focusing. By contrast, in the SIZ, the low mass accumulation rates (<1.7 mg cm-2 yr-1) and a focusing factor <1 reflect sediment winnowing.
[29] After correction for sediment redistribution, the preserved rain rates of Baxs (Table 4) vary by a factor of 2-6 within the same oceanic zone (SAZ, 0.7-1.1 mg cm-2 kyr-1 ; PFZ, 0.9-2.8 mg cm-2 kyr-1; POOZ, 0.2-1.2 mg cm -2 kyr-1; SIZ, 1.5-3.0 mg cm-2 kyr-1). Note that with the exception of the POOZ, the mean preserved rain rate of Baxs (mean PFZ is 1.4 mg cm-2 kyr-1 but is 1.1 mg cm-2 kyr-1 if one sample is excluded; mean SIZ is 1.8 mg cm-2 kyr-1 ) is in the range but is 10% higher for the Atlantic sector (PFZ, 0.9 mg cm-2 kyr-1 ; SIZ, 1.6 mg cm-2 kyr-1; Table 3). The mean preserved rain rate of Baxs in the Subantarctic Zone is at least 10% lower than the mean measured in the PFZ. By contrast, the POOZ is characterized by the lowest preserved Baxs rain rates in this sector, with a mean value (0.8 mg cm-2 kyr-1) 2 times lower than the mean reported for the Atlantic sector (1.7 mg cm-2 kyr-1).
5.3. Export Production Estimate
[30] Preserved vertical rain rates were transformed into vertical rain rates, following the rationale explained in section 5.1. For the four shallow POOZ samples (see Table 3, footnote d, and Table 4, footnote b) we report both the estimates taking into account the preservation rates estimated using (4) or assuming a 100% barite preservation.
5.3.1. Atlantic sector.
[31] The estimates of export production vary between 1.8 and 25 g C cm-2 kyr-1 along the ANT X/6 transect (Table 3), and smallest variations are observed in the PFZ Zone (4-5.8 g C cm-2 kyr-1 ). The accuracy of the export production estimates is affected by the accuracy of the Th correction, which may not be particularly straightforward for the POOZ because of the following two reasons: (1) The POOZ is under the influence of the outflow of dissolved Th enriched Weddell Sea water [Walter, 1998]. The dissolved 230Th enrichment results from a low scavenging rate in the Weddell Sea due to low particle fluxes [Rutgers van der Loeff and Berger, 1983; Walter et al, 1997]. Consequently, in the POOZ the vertical flux of Th is higher than the production rate, potentially leading to an underestimation of export production by up to a factor of 2 (M. M. Rutgers van der Loeff, personal communication, 2000). (2) Correction of MAR according to the constant Th flux model requires that redistributed particles are advected from an area characterized by a similar Th rain rate, i.e., from an area with similar water column height [François et al, 1993; R. François, personal communication, 2000]. If the redistributed sediment was initially deposited in a shallower area before being transported to its final site of deposition, its lower excess Th content will dilute the local excess. The error on the vertical flux ranges between 10 and 40% (R. François, personal communication, 2000) and would ultimately result in an underestimation of export production. Such a sediment supply from a shallow area has been reported for the region in vicinity of Maud Rise [Abelmann and Gersonde, 1991; Van Bennekom et al., 1988]. Thus a rough seafloor topography (e.g., the presence of Antarctica-America Ridge) favors advective supply of 230Th from adjacent shallower sites.
[32] We now compare our export production estimates deduced from sediment Baxs content with estimates based on other approaches, using data from the same ANT X/6 cruise or different cruises in the same region. From Table 5 it appears that all the water column proxies record highest export productions for the Polar Front. 1. From trapped Ba fluxes at the PF (station PF3; traps at 600 and 3200 m) and in the POOZ (station WS3; trap at 360 m), Nürnberg [1995] calculated export productions (at 100 m) of 5.6 g C m-2 yr-1 (PFZ) and 1.3 g C m-2 yr-1 (POOZ). After correcting these values for trapping efficiencies on the basis of annual 230Th fluxes [Walter, 1998], the export production estimate for the PF site increases to 9.9-10.2 g C m-2 yr-1.
2. Rutgers van der Loeff et al. [1997] observed a significant enhancement of the deficit in the PFZ surface waters at 6°W (ANT X/6) during the bloom development, from which they deduced an export production of 3.6-9.6 g C m-2. For the POOZ they observed a lower 234Th-based export production of 1.8-3.6 g C m-2.
3. Model results of the seasonal bloom development during the ANT X/6 cruise [Lancelot et al., 2000] indicate export production for the PFZ ranges from 1 to 7.6 g C m-2 yr-1 and is 1.2 g C m-2 yr-1 for the POOZ.
4. For the same Atlantic transect (ANT X/6), export production was also calculated from mesopelagic organic carbon oxidation rates based on dissolved oxygen consumption rates or on the amount of mesopelagic particulate
Baxs buildup since the onset of the growth season [Dehairs et al., 1997]. The latter estimate should be smaller than the export production since it represents only a fraction (albeit large) of the downward carbon flux from the mixed surface layers. It appears for the PFZ that 2.7 g C m-2 kyr-1 would be respired in the subsurface water layer between 200 and 400 m. This value reduces to 1.7 g C m-2 yr-1 for the POOZ and to 1.1 g C m-2 yr-1 for the SIZ.
[33] Although estimates based on the different proxies and approaches are quite variable, the results, in general, indicate that export production is at least 1.5 times higher in the PFZ compared to the POOZ (Table 5). It is important to note that export production values reported by Frank et al. [1996] and François et al. [1997], as obtained from dissolution-corrected, 230Th-normalized sedimentary Baxs fluxes, are much higher for the POOZ (15-24 g C m-2 yr-1) and are at least twice as high for the PFZ (5-10 g C m-2 yr-1 ; Table 5). There is evidence that maximal export production occurs in the high opal flux belt of the Atlantic sector located south of the Polar Front [e.g., Quéguiner et al., 1997], although it remains unclear as to what extent this massive opal deposition results from local high productivity, rather than from enhanced sediment focusing [Rutgers van der Loeff et al., 1997]. For the POOZ our minimal estimates of export production are close to values based on water column proxies. This observation emphasizes that south of the Polar Front, barite preservation may be underestimated when using the Dymond et al. algorithm (equation (4)).
5.3.2. Indian sector.
[34] In the Indian sector the mean export production estimate for the PFZ (4.6 g C m-2 yr-1 ; one value >20 g C m-2 yr-1 excluded; Table 4) is quite similar to the mean estimate for the Atlantic sector (4.9 g C m-2 yr-1). For the POOZ the mean export production value is lower than the PFZ value and usually lower than the estimates for the Atlantic sector. François et al. [1997] reported an export production of 22 g C m-2 yr-1 for the Antarctic Zone of the Indian sector (Table 5). This estimate was based on dissolution-corrected, 230Th-normalized Baxs flux of one surface sediment sample (MD84552) in the POOZ close to Kerguelen Island. Again, two processes may possibly contribute to an overestimation of export production: (1) The barite preservation rate may be higher than indicated by (4), and (2) the advective supply of excess 230Th from sites with a shallower water column could dilute the 230Th excess at the sampling site and lead to an overestimation of the Baxs flux. In the SIZ the two surface sediments also give a high export production of 11 and 27 g C m-2 yr-1. The latter samples were collected in the eastern part of the study area, and we have no other data for direct comparison. Furthermore, the sampled location is characterized by intense winnowing (focusing factor <1 ; Table 4). The preservation rates, as deduced from (4), are thus minimum values, and the export production estimates are maximum values.
6. Conclusions
[35] The use of sediment Baxs content as a proxy for export production requires the conversion of the Baxs accumulation rates into vertical rain rates. This conversion in turn requires (1) an estimation of the degree of barite preservation from dissolution and (2) a correction for sedimentary reworking, mainly focusing.
1. Up to now, only the relationship between the degree of preservation of barite and the mass accumulation rate proposed by Dymond et al. [1992] has been available to correct for barite dissolution at the sediment-seawater interface. This correction takes into account the exposure time of sediment to undersaturated bottom waters. However, the observed relationship between sediment Baxs content and barite saturation index of bottom waters in the Atlantic sector suggests control also by the state of undersaturation in bottom waters.
Confronting our results with investigations on the saturation state of the water column with respect to barite has shown that correction for dissolution is widely justified, except maybe for shallow sediments (water depth <2500 m) located south of the Polar Front.
2. The excess 230Th normalization of the Ba accumulation rate appears essential to correct for massive sediment focusing taking place in the Southern Ocean, but the correction has to be applied with caution because of the possible impact of boundary scavenging and focusing of shallower sediments less enriched in excess 230Th.
[36] Export production estimates from sediment Baxs give similar values for the Polar Front Zone in the Atlantic and Indian sectors (4.9 and 4.6 g C m-2 yr-1, respectively). In the permanently open ocean zone our estimates are closer to those deduced from water column proxies than previous estimates. This observation suggests that barite is in fact better preserved in the sediments of the permanently open ocean zone than suggested by the Dymond et al. algorithm.
[37] Acknowledgments:
O. Holby, B. Dieckmann, and G. Kuhn are sincerely thanked for providing surface sediment and core samples from the Atlantic sector of the Southern Ocean. Thanks are owed to C. Nürnberg and L. Dezileau for exchange of data. Michiel Rutgers van der Loeff, Roger François, and Catherine Jeandel have helped with the discussions. R. W. Murray and two anonymous reviewers are thanked for their constructive reviews. The major and trace element analyses have been performed in the Mineralogical and Geochemical Department of the Royal Museum for Central Africa, with technical assistance of J. Navez, L. Monnin, and P. Chaliassos. Determination of the Th content was done at Woods Hole Oceanographic Institution (WHOI, Marine Geochemistry Department) on invitation by Roger François, with the technical assistance of S. Brown-Léger and A. Fleer and the financial assistance of a Belgian FNRS grant. In particular, we thank Lary Ball and WHOI ICP Facility for use of their Finnigan Mat Element I sector field inductively coupled plasma mass spectrometer in making these measurements. The English text has been improved by M. Keskinen, Alaska University, Fairbanks. This work was conducted under grants A4/DD/B11 and B13 within the Programme "Scientific Research on the Antarctic-Phase IV" supported by the Belgian State (The Prime Minister's Services-Scientific, Technical and Cultural Affairs).
References
Anderson, R. F., and A. Fleer, Determination of natural actinides and plutonium in marine particulate materiel, Anal. Chem., 54, 1142-1147, 1982.
Anderson, R. R, N. Kumar, R. A. Mortlock, P. N. Froelich, P. Kublik, B. D. Dittrich-Hannen, and M. Suter, Late Quaternary changes in productivity in the Southern Ocean, J. Mar. Syst, 77,497-514, 1998.
Abelmann, A., and R. Gersonde, Biosiliceous particle flux in the Southern Ocean, Mar. Chem., 35, 503-536, 1991.
Bareille, G., Flux sédimentaires: Paléoproductivité et Paléocirculation de l'Océan Austral au cours des 150.000 dernières années, doctoral dissertation, 259 pp., Univ. de Bordeaux I, Ta-lence, France, 1991.
Bareille, G., M. Labrachie, L. Labeyrie, J. J. Pichon, and J. L. Turon, Biogenic silica accumulation rate during the Holocene in the southeastern Indian Ocean, Mar. Chem., 35, 537-551, 1991.
Bareille, G., M. Labrachie, P. Bertrand, L. Labeyrie, G. Lavaux, and M. Dignan, Glacial-interglacial changes in the accumulation rates of major biogenic components in southern Indian Ocean sediments, J. Mar. Syst., 17, 527-539, 1998.
Bathmann, U. V, R. Scharek, C. Klaas, C. D. Dubischar, and V. Smetacek, Spring development of phytoplankton biomass and composition in major water masses of the Atlantic sector of the Southern Ocean, Deep Sea Res., Part II, 44, 51-67, 1997.
Bishop, J. K. B., The barite-opal-organic carbon association in oceanic particulate matter, Nature, 332, 341-343, 1988.
Bishop, J. K. B., Regional extremes in particulate matter composition and flux: Effects on the chemistry of the ocean interior, in Productivity
of the Ocean: Present and Past, edited by W. H. Berger, V. S. Smetacek, and G. Wefer, pp. 117-137, John Wiley, New York, 1989.
Broecker, W S., and T. H. Peng, The cause of glacial to interglacial atmospheric CO2 change: A polar alkalinity hypothesis, Global Biogeo-chem. Cycles, 3, 215-239, 1989.
Brumsack, H. J., Geochemistry of recent TOC-rich sediments from the Gulf of California and the Black Sea, Geol Rundsch., 78, 851-882, 1989.
Cardinal, D., N. Fagel, L. André, and F. Dehairs, Ba repartition in surface sediment and trap material: A sequential leaching approach, J.
Conf. Abstr. EUG X, 4, 425, 1999.
Charles, C. D., P. N. Froelich, M. A. Zibello, R. A. Mortlock, and J. J. Morely, Biogenic opal in Southern Ocean sediments, over the last 450,000 years: Implications for surface water chemistry and circulation, Paleoceano-graphy, 6, 697-728, 1991.
Church, T. M., Marine barite, in Marine Minerals, edited by R. G. Burns, Rev. Mineral, 6, 175-209, 1979.
Dehairs, F., R. Chesselet, and J. Jedwab, Discrete suspended particules of barite and the barium cycle in the open ocean, Earth Planet. Sci.
Lett., 49, 529-550, 1980.
Dehairs, F., N. Stroobants, and L. Goeyens, Suspended barite as a tracer of biological activity in the Southern Ocean, Mar. Chem., 35, 399-410, 1991.
Dehairs, F., D. Shopova, S. Ober, C. Veth, and L. Goeyens, Particulate barium stocks and oxygen consumption in the Southern Ocean me-sopelagic water column during spring and early summer: Relationship with export production, Deep Sea Res., Part II, 44, 497-516, 1997.