A survey of wheat take-all in Belgium
9
0
0
Texte intégral
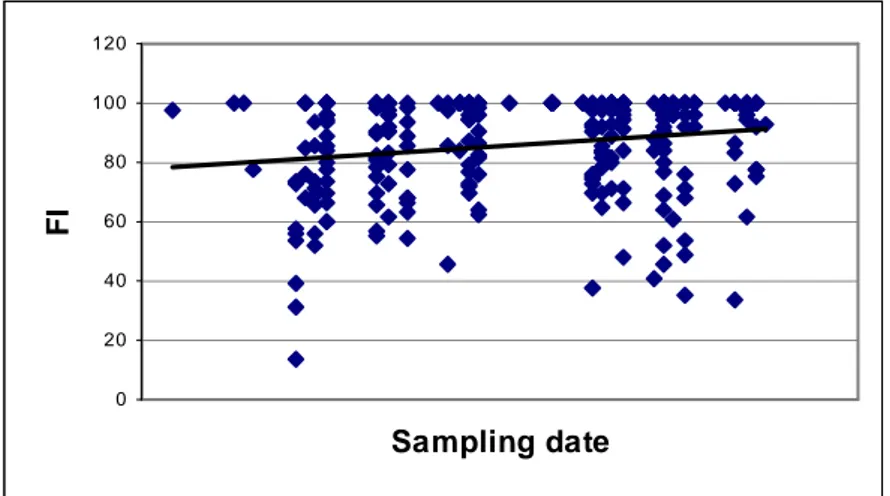
(2) For each plot, 50 plants were sampled systematically between anthesis and harvest. Only roots and stem basis were keeped and stocked in cold room. The root samples were washed thoroughly to remove any ramaining soil and the percentage of root area affected with take-all root rot was assesed visually. The proportion of root system with symptoms was scored with a seventeen –class severity scale (0,2,5,10,15,20,25,30,35,40,45,50,60,70,80,90 and 100 % of the root system infected = P). With these observations, two index were calculated: • The frequency of infestation (FI) according to the formula: FI = number of plants infested/total number of plants scored • A weighted take-all index (TAI) according to the formula: TAI= Σ Pi x Ni/N where Pi= percentage of i class Ni= number of plants in i class N= total number of plants scored RESULTS AND DISCUSSION Effect of the sampling date Sample were made during a long period from beginning of June until the end of July, from GS51 until 85. The level of infection increases along this period (Fg 1 and 2). The differend trend curves in figures are calculated with ExcelTm: it is a linear regression. 120 100. FI. 80 60 40 20 0. Sampling date. Figure 1: FI evolution during the sampling period..
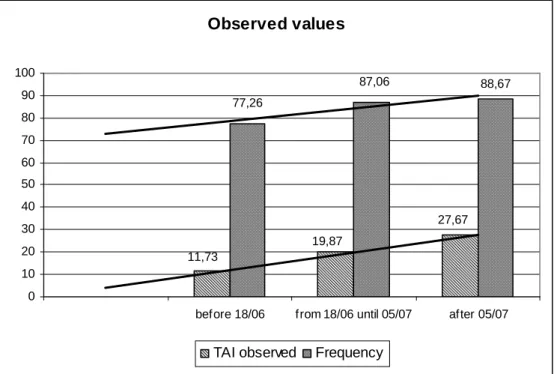
(3) 100 90. TAI observed. 80 70 60 50 40 30 20 10 0. Sampling date. Figure 2: TAI evolution during the sampling period. In four plots, the survey was made at 4 moments to study the cinetic of disease development. As the evolutions are quite different in each four situations, it was not possible to establish a mean evolution curve. Nevertheless, to limit the incidence of sampling date, the whole of the observations are divided into three groups, corresponding to 3 sampling periods, separated by two breaks due to the time needed to score plants. Observed values 100. 87,06. 90. 88,67. 77,26. 80 70 60 50 40 27,67. 30 20. 19,87 11,73. 10 0 before 18/06. from 18/06 until 05/07. TAI observed. after 05/07. Frequency. Figure 3: Evolution of TAI and FI according the three periods of sampling The breakdown of the samples into these three periods can show the increase during the season of the TAI level. To reduce the incidence of the sampling date on TAI, data was modified as if all the plots were sampled at the last period. All the values of TAI from the first group (observation before 18/6) were added of 16 and those of the second group (observations between 18/6 and.
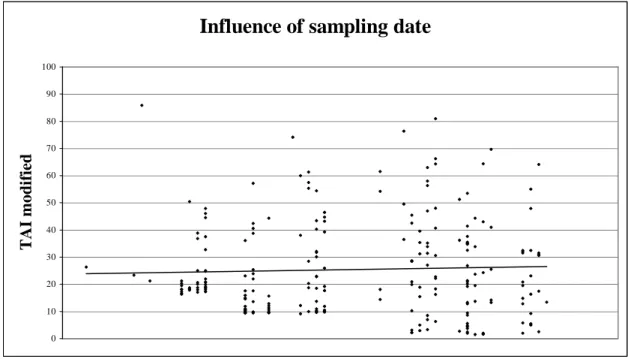
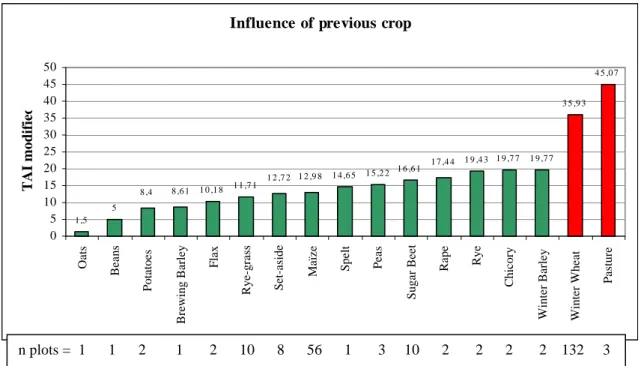
(4) 5/7 were added of 8. These corrections seem to reduce the influence of the sampling date on TAI, as shown in figure 4, where the regression line will be nearly horizontal.. Influence of sampling date 100 90 80. TAI modified. 70 60 50 40 30 20 10 0. Figure 4: General view of TAI after data transformation For result discussion, analysis was only made on TAI; the values of TAI will be the modified values as the methodology described before. The FI levels observed were always high and did not allow to safely identify the growing conditions where take-all risks are very important. Previous crop effect In the figure 5, it appears clearly that as previous crop wheat and pasture are favorable to a higher level of infection by take-all. With other crops, TAI is lower and any difference can be made between them. Often presented as a previous crop increasing the infection risk (Becker and al, 1998), winter barley give in this survey a moderate level of TAI, but with only two plots..
(5) 4 5 ,0 7 3 5 ,9 3. 8 ,4. 8 ,6 1. 1 0 ,1 8. 1 1 ,7 1. 1 2 ,7 2 1 2 ,9 8. 1 4 ,6 5. 1 5 ,2 2. 1 6 ,6 1. 1 7 ,4 4. 1 9 ,4 3 1 9 ,7 7. 1 9 ,7 7. 5. Rye-grass. Set-aside. Maïze. Spelt. Peas. Sugar Beet. Rape. Rye. Chicory. Winter Barley. Winter Wheat. Pasture. 2. Flax. 1. Brewing Barley. n plots = 1. Potatoes. 1 ,5. Beans. 50 45 40 35 30 25 20 15 10 5 0. Oats. TAI modified. Influence of previous crop. 1. 2. 10. 8. 56. 1. 3. 10. 2. 2. 2. 2. 132. 3. Figure 5: Mean TAI by types of previous crops. Ante-previous crop effect After have shown the importance of wheat as a previous crop on the disease level, it is interesting to look after the eventual incidence of the ante-previous crop. In a first step , we have regrouped the plots with wheat as a previous crop according to their ante-previous crop (figure 6). Only two crops , pasture and peas have a TAI higher than other ante –previous crops. Wheat and maize do not seem more favorable than many other crops..
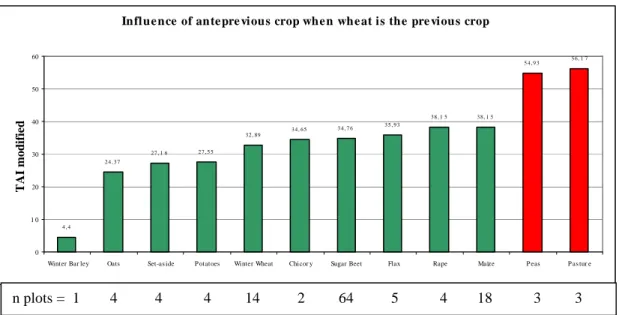
(6) Influence of antepre vious crop when wheat is the pre vious crop 60 54,93. 5 6, 1 7. TAI modified. 50. 40 3 4, 6 5. 34,76. 38 , 1 5. 3 8, 1 5. Maïze. 35,93. 32 , 89 27 , 1 6. 30. 27,55. 24,37. 20. 10 4,4. 0 Winter Bar ley. n plots = 1. Oats. 4. Set-as ide. 4. P otatoes. Winter Wheat. Chicor y. Sugar Beet. Flax. Rape. 4. 14. 2. 64. 5. 4. 18. P eas. 3. P as tur e. 3. Figure 6: Effect on TAI of the ante-previous crop in plots with wheat as previous crop. In a second step, we can look after the eventual incidence of wheat as an ante-previous crop in the plots where the previous crop is not a wheat. In the figure 7 where the previous crop is a maize, effect of type of ante-previous crop does not appear; wheat as an anteprevious crop gives any increase in the infection level. Thus, the take-all risk is still maximum the second year in a succession of wheat crop..
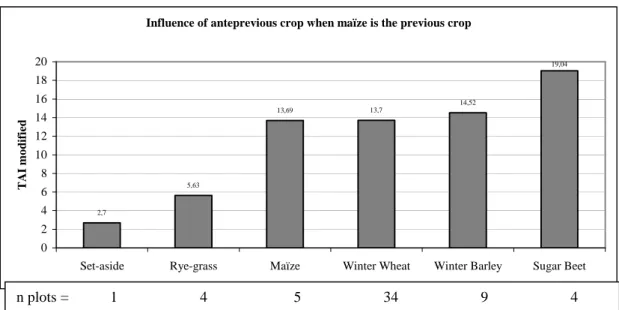
(7) Influence of anteprevious crop when maïze is the previous crop 20. 19,04. 18. TAI modified. 16. 14,52 13,69. 13,7. Maïze. Winter Wheat. 14 12 10 8 5,63. 6 4. 2,7. 2 0 Set-aside. n plots =. Rye-grass. 1. 4. 5. Winter Barley. 34. Sugar Beet. 9. 4. Figure 7: Effect on TAI according to the anteprevious crop in plots with maize as previous crop. A third step was seing the incidence of the crop placed between two wheat crops: W/ ?/W (figure 8). Wheat is in this case the only crop with a higher TAI. Maize, barley, ray-grass, set aside are not more favorable than crops such sugar beet, chicory or peas and rapeseed. All these results show that the role of the ante previous crop is secondary and that only one year of break crop is enough to limit the risk of take –all disease in a succession of wheat crops.. 1 9,77. 1 9,77. Rye. Chicory. Winter Barley. 2. 2. 32,89. 1 9,43 1 7,09. 1 6,79 1 3,61. 1 8,1 9. 1 3,7. 1 3,1 4. 2. Sugar Beet. Rye-grass 2. 7. 2. 2. 2. 2. 14 Winter Wheat. 34. 2. 1. 7. Peas 2. 5. Maïze. 1. 34. Set-aside 5. 1. Rape. Potatoes 1. 1. Beans. Flax. 1. N plots = 1. 1. 1 ,94. 1. 5,47. 5 1 ,5. 1. 35 30 25 20 15 10 5 0. Oats. TAI modified. Influe nce of previous crop when wheat is anteprevious crop. 14. Figure 8: Effect on TAI according to the previous crop with wheat as anteprevious crop..
(8) Wheat monoculture effect When the plots are regrouped according to their number of subsequent wheat crops, high TAI appear with two or three subsequent wheats; we can also observe a decline in the infection level with a longer monoculture (table 1). Wheat sequences. n. TAI modified W/W 108 36 W/W/W 10 43 W/W/W/W 4 29 W/W/W/W/W 1 23 W/W/W/W/W/W 1 15 Table 1: Means of TAI for different sequences of wheat This trend, based on a small number of observations, is similar to the results reported by many authors such as Lemaire and Coppenet (1968), Colbach and Huet (1995) Pasture influence If pasture was present in the plots less than fifteen years ago, the disease level is higher, but not so much as pasture is previous crop. Others influences The survey has showed some other trends: • When the drainage of plots is bad, the TAI is rising up • Gramineous weeds, mainly couch-grass and windgrass, in the crop increase TAI • Early date of sowing is also favorable to the disease development Some factors do not have effects: any differences appears between varieties and agricultural areas. CONCLUSION This survey, made during only one growing season, has shown that take-all is present in Belgium but the risk is mainly in crops where wheat or pasture are previous crop. The anteprevious crop do not have influence, except if it is pasture. A break of only one year between two wheat crops is suffisant to have again a disease level similar as this of a first year of wheat. Early date of sowing, bad drainage and gramineous weeds in the crop are secondary factors increasing slightly the disease level..
(9) REFERENCES Beale R.E., Phillion D.P., Headrick J.M., O'Reilly P. & Cox J. (1998). Mon65500: A unique fungicide for the control of take all in wheat. In: The 1998 Brighton Conference – Pests and Diseases. BCPC, 343-350. Becker J., Lavier B. & Leaper D.J. (1998). Take all (Gaumannomyces graminis var.Tritici) infestation survey for Germany, France and the U.K., 1996-1997. In: The 1998 Brighton Conference – Pests and Diseases. BCPC, 77-82. Colbach N. & Huet P. (1995). Modelling the frequency and severity of root and foot diseases in winter wheat monoculture. Eur. J. Agron. 4 (2), 217-227. Lemaire J-M. & Coppenet M. (1968). Influence de la succession céréalière sur les fluctuations de la gravité du piétin-échaudage. Ann. Epiphyt, 19(4), 589-599. Löchel A.M., Wenz M., Russel P.E., Buschaus H., Evans P.H., Cross S., Puhl T. & Bardsley E. (1998). Root protection using fluquinconazole: a new approach to controlling cereal takeall. In: The 1998 Brighton Conference – Pests and Diseases. BCPC, 89-86..
(10)
Figure
+4

Documents relatifs
The presence of blackgrass in a set-aside field, with significant soil infectivity and high soil conduciveness, might increase the risks of take-all development in a wheat
This article using hyperspectral remote sensing, through the different levels of the incidence of wheat take-all canopy spectral reflectance data collection analysis and
They live in a lovely cottage in Stratford-upon-Avon, England. The house is not very big but my grandmother keeps it clean and tidy. It has only got one floor and the attic. In
However, for galaxies with very little or no bulge (specifically late types or irregular galaxies), the luminosity profiles were not decomposed, the disc component is then directly
In similar fashion to the UVW2 data, the UVW1 and UVM2 light curves are also observed to track the X-ray variations on long time-scales, displaying the characteristic drop in flux
I n eastern Asia, the early farmers created a high-performing rice cropping system in which rice seedlings were grown in nurseries and then transplanted in paddy fields
4.1. Results for the rectangular channel with an abrupt contraction. In this section, we show the numerical results obtained for the solutions of Stokes and Navier–Stokes systems
, after each chapter title or sub-chapter title, a summary is proposed in the manner of ancient used to provide indications as to the contents of the text
