HAL Id: hal-01552255
https://hal.archives-ouvertes.fr/hal-01552255
Submitted on 1 Jul 2017HAL is a multi-disciplinary open access
archive for the deposit and dissemination of sci-entific research documents, whether they are pub-lished or not. The documents may come from teaching and research institutions in France or abroad, or from public or private research centers.
L’archive ouverte pluridisciplinaire HAL, est destinée au dépôt et à la diffusion de documents scientifiques de niveau recherche, publiés ou non, émanant des établissements d’enseignement et de recherche français ou étrangers, des laboratoires publics ou privés.
multidisciplinary positioning of a scientific area.
Implementation for an Advisory Scientific Committee
Hervé Rostaing, Nicolas Barts, Valérie Léveillé
To cite this version:
Hervé Rostaing, Nicolas Barts, Valérie Léveillé. Bibliometrics : representation instrument of the mul-tidisciplinary positioning of a scientific area. Implementation for an Advisory Scientific Committee. Eighth ISKO-Spain Congress : Interdisciplinarity and Transdisciplinarity in the Organization of Sci-entific Knowledge, ISKO-Spain, University of Leon, 18-20 avril, Apr 2007, Leon, Spain. pp.341-350. �hal-01552255�
Bibliometrics: representation instrument of the
multidisciplinary positioning of a scientific area.
Implementation for an Advisory Scientific Committee.
Hervé ROSTAING, Nicolas BARTS, Valérie LÉVEILLÉ
Université Paul Cézanne Aix Marseille III, LSIS UMR 6168, Campus Saint Jérôme, F-13397 Marseille Cedex 20
[email protected], [email protected], [email protected]
Abstract
Bibliometric techniques study researchers’ communication activity to have a better understanding of phenomena of construction, dissemination and use of scientific and technical knowledge. In this paper, a bibliometric study was used like an assistance instrument for the strategic positioning of a scientific area. The aim of this bibliometric study was to help the work of an Advisory Scientific Committee by offering a global and "objective" view of the position and the evolution of the scientific activity of the Aix-Marseilles area. The methodology employed was strongly inspired by strategic analysis methods carried out in companies. The implemented strategic analysis process involves the definition of strategic scientific units, the selection of competitors (a set of scientific areas), the choice of measuring criterion of the scientific activity, the evaluation of the dynamics over the years and the graphical representation of the scientific portfolio of the Aix-Marseille area. Such a strategic analysis process for analyzing a scientific portfolio allows positioning the strategic scientific fields of the Aix-Marseilles area in relation to the "competition" by taking into account the dynamic history of its activity.
Keywords: Bibliometrics, strategic analysis process, strategic positioning, scientific portfolio analysis
1 Introduction
Bibliometrics is a set of techniques devoted to the quantitative analysis of scientific and technical activities. These techniques implement mathematical and statistical methods to measure the data that represent researcher contributions to science and technical development. The data used for bibliometric studies mainly stem from information produced by the activity of researchers’ communication. These quantitative studies of researchers’ communication activities try to have a better understanding of phenomena of construction, dissemination and use of scientific and technical knowledge.
Basic assumptions within the field of bibliometrics are that:
scientific and technical activities produce scientific and technical knowledge,
scientific and technical knowledge is transformed into scientific and technical information when the promoters of this knowledge seek to formalize it for communicating or storing,
scientific and technical information is the expression of the representation of this scientific and technical knowledge
scientific and technical information circulating by well controlled public media, the application of statistical methods measuring flows of information transmitted by these media provides a good image of the "production" of scientific and technical information.
By extrapolation, bibliometrics allows to estimate the researchers’ contribution to scientific and technical knowledge production, dissemination and use.
Bibliometric research approaches the analysis of these phenomena by various methods (White and McCain 1989, Rostaing 1996, Van Raan 1997):
measurement of the scientific knowledge concentration in scientific journals (Bradford law), by researchers (Lotka law)
measurement of the scientific knowledge growth
measurement of the dissemination media of scientific knowledge and more especially studies of scientific journals
measurement of the scientific knowledge use: obsolescence and impacts within a scientific community
measurement of the social and scientific organization of science players and its impact on the scientific knowledge development (scientific collaborations)
measurement of the scientific knowledge structure by co-citation analysis, co-word analysis, co-heading analysis, or more recently text mining analysis (information mapping)
measurement of the production, the productivity and even the performance of players or scientific institutions for their scientific knowledge contribution (research assessment)
…
This bibliometric study fulfils another purpose. The main objective is the use of bibliometric techniques like an assistance instrument for the strategic positioning of the scientific potential. Companies use bibliometrics for technology watch (or competitive technical intelligence) as an assistance tool to position its R&D activity in relation to the competition. By analogy, a scientific area or a university needs to know its strengths and weaknesses compared to its "competitors". Bibliometric quantitative analysis can help to measure this competitive position and assess the efforts required to preserve or improve scientific potential.
2 Context
In the past, all the scientific orientations and funding decisions were in the French research system assigned to the national public research establishments (Research Ministry, CNRS and National Research Institutes). This situation is changing. The authority devolution to the Regions is transferring part of the decision-making centres near the local public players. In the same way, the French universities are gaining independence and must elaborate new instruments for supporting their development strategy in general, and their scientific policy strategy in particular (Rostaing et al. 2004).
In such a context, the three universities of the Aix-Marseilles area joined their efforts to organize in April 2006 an Advisory Scientific Committee (Comité d’Orientation Scientifique). The aim of such a Scientific Committee is not to carry out a research assessment of the three universities or its players, but much more to analyze the research potential and express recommendations on the scientific orientations to improve their research activities. The organization of this Scientific Committee process fits rather into a self evaluation process with an external expertise assistance.
This Scientific Committee was made up of scientists – about forty experts in the various scientific fields of the 3 universities (coming from many areas of France, countries of Europe or other parts of the world). These experts were on-site during one week at the 3 universities. During this week, they attended a general presentation of the universities scientific activities and their shared actions; they visited the various sites of the three universities where they met the numeros persons in charge of research.
As the members of this Scientific Committee were external to the 3 universities, they did not know very well about the scientific activities of the Aix-Marseilles area and had a vague idea of the scientific potential of this area compared to other European scientific areas. To help them, several instruments were put at their disposal: presentation documents of the research organization in the universities and their research groups; gateway on Internet presenting all these research groups and the administrative structures on which they depend... Among these instruments, the steering committee of this event considered that it was necessary to propose a bibliometric study of the three universities’ scientific activities.
The aim of this bibliometric study was to try to help the work of the Scientific Committee members by offering a global and "objective" view of the position and the evolution of the scientific activity of the three Aix-Marseilles universities.
3 Methodology and data collection process
The bibliometric study is not intended to be an instrument for helping in the research assessment of the Aix Marseilles universities, but rather an instrument for helping in the strategic analysis of the three universities’ scientific policy. Thus, the methodology employed for this bibliometric study was strongly inspired by strategic analysis methods carried out in companies.
The approach of these company strategy analyses is usually presented according to a strategic analysis process realized in four stages (Strategor 1997, Ernst 2003):
Identification of the Strategic Business Units (SBU): definition of the activity fields which characterize the company trade perfectly and will be the matter of the competitive analysis.
Choice of the competitive analysis criteria for each SBU: the chosen criteria are considered as the key factors of economic success for the strategic activity fields.
The competitive position of each SBU: performance assessment of its company to those of its main competitors according to the criterion or the criteria chosen for each SBU.
Portfolio management: this last stage seeks to offer a common representation of the strategic position of the company as a whole, judged by its SBU portfolio assessment. Such a representation (ex: strategic matrix of Boston Consulting Group, Arthur D Little or McKinsey) makes it possible to compare the competitive position of each SBU and to make a global analysis of the business portfolio for arbitrage making.
The methodology of the bibliometric study follows the strategic analysis process to offer a "competitive" position view of scientific activity the Aix-Marseilles universities according to:
the “strategic scientific units” corresponding to the key factors of their scientific activities a set of scientific areas (considered as "competitors") with whom they wish to be compared.
3.1 Measuring criterion of the scientific activity
The scientific activity of a research center can take many forms (Callon et al. 1995): "certified" scientific research (academic research), participation in formation by research, transfer and exchange with social and economic world, commitment in public interest actions, spreading of scientific culture…
In this study, only the activity of academic research will be taken into account as measuring criterion of the scientific activity. Furthermore, this activity of academic research was restricted to only the production of scientific contributions indexed by the databases produced by Thomson-ISI. These Citation Indexes have many advantages (multidisciplinary and international cover, became a de facto standard, publications taken into account have an international dimension, relatively well normalized data…) but also many drawbacks that directly influence this bibliometric study. By using this source of information, the measurement of scientific research is only based on the scientific contributions published in scientific journals. All other means of scientific communication are not taken into account by the Citation Indexes. The scientific communities having other communication practices (books contribution, international conferences participation) are undervalued. Theses disadvantages become critical for social sciences and humanities.
The WoS1 version of the Citation Index was used for collecting the data and, more precisely, the following
databases: SCIE (Science Citation Index Expanded) and SSCI (Social Science Citation Index).
3.2 Definition of the strategic scientific units
The steering committee considered that the research fields covered by the various Doctoral Schools (Ecole
Doctorale) represent perfectly the scientific activities of the three universities. Over several years in France, the
accredited research laboratories have been brought together in Doctoral Schools. In the Aix-Marseilles area, twelve Doctoral Schools were accredited to the three universities: seven include sciences and technology fields and five social sciences and humanities fields.
The bibliometric study could not take into account the scientific fields corresponding to the Doctoral Schools of social sciences and humanities because of the lack of reliable and accurate data from Citation Index. Only strategic scientific units covered by the seven Doctoral Schools in sciences and technology fields could be used for the competitive position analysis. The names of these seven Doctoral Schools are: 1) Mathematics and computer science (Math-Info); 2) Physics and materials sciences (Phys-Mat); 3) Physics, Modeling and engineering science (Phys-Ing); 4) Environmental sciences (Env); 5) Chemical Sciences (Chim); 6) Sciences of the Human Movement (Mouv); 7) Health and Life sciences (Vie-Santé)
The scientific fields used as strategic scientific units are defined by the scientific boundaries of the seven Doctoral Schools of the Aix-Marseilles area. The use of the Subject Category classification seeming to be inappropriate, the steering committee of the Scientific Committee chose to define the scientific boundary of each Doctoral Schools by the selection of a scientific journals panel. As much as possible, this selection of scientific journals was carried out with the Doctoral Schools by an elicitation process. However, some Doctoral Schools didn’t take part in this process. The steering committee thus had to carry out this selection by applying arbitrary criteria. The Table 1 shows the number of selected journal and how this journals panel was obtained for each strategic scientific unit.
Strategic scientific units Number of selected journals Way of selecting Mathematics and computer science 146 Selected by Doctoral Schools
Physics and materials sciences 200 Arbitrary selected (1<IF<21.36)
Physics, Modeling and engineering science 200 Arbitrary selected (0.20<IF<4.35) Environmental sciences 229 Arbitrary selected (0.83<IF<16.24)
Chemical Sciences 203 Selected by Doctoral Schools Sciences of the Human Movement 110 Selected by Doctoral Schools Health and Life sciences 295 Arbitrary selected (2<IF<38.57)
Table 1: results of the selecting process of scientific journals for defining the boundary of each strategic scientific unit
3.3 Selection of the set of scientific areas (“competitors”)
The choice of the areas to be compared to the Aix-Marseilles area was decided by the Steering Committee of the Scientific Committee (formed of the Scientific Vice-Presidents of the 3 universities of Aix-Marseilles). The Steering Committee singled out 7 French areas (Bordeaux, Grenoble, Lyon, Montpellier, Nice, Strasbourg, Toulouse) and 5 European areas (Barcelona, Leeds, Milan, Tübingen, Turin).
1
This arbitrary choice is mainly based on strategic positioning expectations from the Steering Committee. In the same way that a company selects deliberately a set of companies considered as its competitors in a strategic analysis process, the Steering committee chose the scientific areas which it wanted to be gauged with.
Even so, this choice tried to respect two criteria:
limitation of the size effect by selecting scientific areas having a scale rather similar to the scale of the Aix-Marseilles area,
keeping a scientific coherence by selecting scientific areas having a spectrum of scientific activities characteristic of the Aix–Marseilles area.
The extraction from a database of all the publications of a university is quite impossible by only seeking the university name(s) in the address of the authors. For various reasons this process is unsuccessful (Van Raan A, 2005). Furthermore, the scientific publications representing the activity of a scientific area were extracted according to following constraints:
the geographical localization indicated in the authors addresses : the three universities of Aix-Marseilles are scattered in several cities over a wide area of about thirty kilometers (the cities of Marseilles and Aix-en-Provence are 30 km apart). All the publications indexed by the SCIE or the SSCI mentioning one of these cities (where the universities are located) are attributed to the cluster of the three universities. The same principle was applied to the twelve other scientific areas.
the universities’ names belonging to the scientific area: if some scientists of a university are not resident in these cities or if the author address is not specified in the bibliographic record, the previous search is unsuccessful. Therefore, publications containing one of the universities’ names as affiliation were also required. As unfortunately some universities are known with several names (especially for French universities), we tried to take into account all these variations of names for each university.
For example, here is how we queried the WoS databases to extract the publications of the Aix-Marseilles area:
CI=(marseille OR marseilles OR aix en provence OR les milles) OR AD=((aix SAME marseille I) OR (aix SAME marseille 1) OR (univ provence) OR (provence univ)) OR AD=((aix SAME marseille II) OR (aix SAME marseille 2) OR (univ medit* SAME france) OR (medit* univ SAME france)) OR AD=((aix SAME marseille 3) OR (aix SAME marseille III) OR (Univ SAME Paul Cezanne) OR (UDESAM) OR (univ SAME droit SAME aix))
The set of publications extracted by such a query represents much more the scientific activity of Aix-Marseilles area than the scientific activity of the three Aix-Marseilles universities. This is the reason why, in this paper, we are talking about the analysis of the scientific portfolio of a scientific area and not of a universities cluster.
3.4 Evaluation of the dynamics over the years of strategic scientific units
For evaluating the evolution of the activities of the 13 areas in the scientific fields, the data were collected over a 24-year period (1981-2004) divided into 4-year windows. Therefore, the dynamics of the areas in the various strategic scientific units are estimated with 6 periods of 4-year windows.
4 Results
4.1 Raw data scoreboards
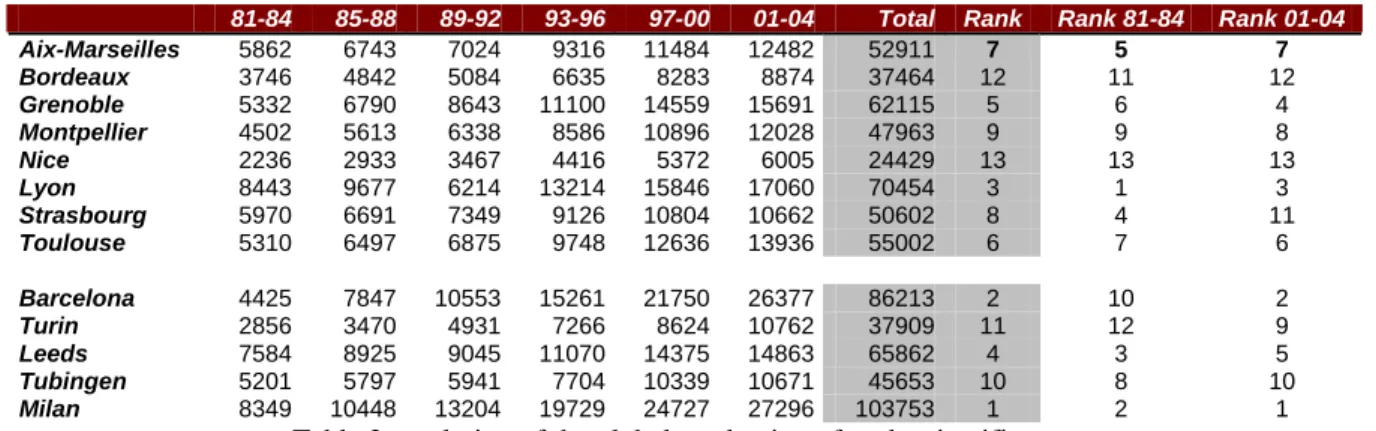
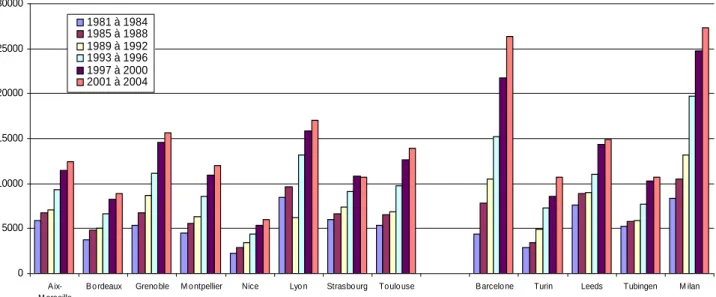
The collected data were compiled in “scoreboards”. A first scoreboard compiles the evolution of the global production of each scientific area for the 6 periods of 4-year windows (Table 2). A similar scoreboard is built up for each strategic scientific unit. Charts of these 8 scoreboards were produced (for example, the Figure 1 is the chart of the Table 2).
81-84 85-88 89-92 93-96 97-00 01-04 Total Rank Rank 81-84 Rank 01-04
Aix-Marseilles 5862 6743 7024 9316 11484 12482 52911 7 5 7 Bordeaux 3746 4842 5084 6635 8283 8874 37464 12 11 12 Grenoble 5332 6790 8643 11100 14559 15691 62115 5 6 4 Montpellier 4502 5613 6338 8586 10896 12028 47963 9 9 8 Nice 2236 2933 3467 4416 5372 6005 24429 13 13 13 Lyon 8443 9677 6214 13214 15846 17060 70454 3 1 3 Strasbourg 5970 6691 7349 9126 10804 10662 50602 8 4 11 Toulouse 5310 6497 6875 9748 12636 13936 55002 6 7 6 Barcelona 4425 7847 10553 15261 21750 26377 86213 2 10 2 Turin 2856 3470 4931 7266 8624 10762 37909 11 12 9 Leeds 7584 8925 9045 11070 14375 14863 65862 4 3 5 Tubingen 5201 5797 5941 7704 10339 10671 45653 10 8 10 Milan 8349 10448 13204 19729 24727 27296 103753 1 2 1
Figure 1: chart of the evolution of the global production of each scientific area (Table 2)
The complexity and the number of these raw data scoreboards (or theirs charts) do not make easy the analysis of the potential research positioning of the Aix-Marseilles area. It appears very difficult to evaluate dynamics of the area in each scientific field because the size effect could strongly influence the interpretation of the results. It appears significant to be able to weigh the effort provided by the actors of a scientific field by the global effort provided by the area during the same time period.
To make such raw data useful, relative indicators were computed for reducing the effect of size and translated into graphs in order to offer a global view of the evolution of the Aix-Marseilles area positioning in the chosen fields compared to the 12 other scientific areas.
4.2 Representation of the portfolio of the strategic scientific units
By analogy with the strategic matrices developed by consultancy firms, the portfolio of the strategic scientific units of the Aix-Marseille area is graphically represented according to two indicators (fig 2).
0,0 0,5 1,0 1,5 2,0 2,5 3,0 20% 40% 60% 80% 100% 120%
Indicator of the com pe titive pos ition
In d icat o r o f t h e sci en ti fi c d y n a m ic s Math-Inf o Phys-Mat Phys-Ing Env Chim Mouv Vie-Santé 85-88 89-92 93-96 97-00 01-04 leader
Figure 2: competition position dynamics of a scientific portfolio for the Aix-Marseilles area
0 5000 10000 15000 20000 25000 30000 A ix-M arseille
B o rdeaux Greno ble M o ntpellier Nice Lyo n Strasbo urg To ulo use B arcelo ne Turin Leeds Tubingen M ilan
1981 à 1984 1985 à 1988 1989 à 1992 1993 à 1996 1997 à 2000 2001 à 2004 Vie-Santé Phys-Ing Chim Math-Info Env Mouv Phys-Mat
The scientific fields (strategic scientific units) are scattered according to these two axes:
indicator of the “competitive” position on the x-axis: the research activity of the Aix-Marseilles area in a strategic scientific unit is positioned on the x-axis in proportion to the research activity of the most active competitor in this field. As all the strategic scientific units are represented on the same graph, this gap with the leader is expressed as a percentage to minimize the size effect. Thus the gap between the dot of a scientific field and this 100% vertical line corresponds to the effort that the Aix-Marseilles area should make to catch up with the leader of this scientific field. If the Aix-Marseilles area is the leader in a strategic scientific unit, then the dot is positioned beyond the vertical line and the gap to this line corresponds to how far it has pulled away from the second most active area in this field.
indicator of the scientific dynamics on the y-axis : a strategic scientific unit is positioned on the y-axis according to the growth of the scientific activity of the Aix-Marseilles area in this field. This growth measures the evolution (expressed as a percentage) of the production between a time window and the previous time window. To standardize this measurement for the set of the strategic scientific units, this growth is reduced by the measurement of the growth of the areas set in this scientific field. Thus, the horizontal line having the ordinate 1 symbolizes the position at which the Aix-Marseilles area has a growth equivalent to the global growth for a time window. A strategic scientific unit located above this horizontal line shows that the Aix-Marseilles area has a dynamics more significant than the dynamics of the areas set for this period of 4-year window.
As the two axes are relative indicators, it is possible to locate the strategic scientific units for all the 4-year windows on the same graph.
5 Conclusion
Such a representation of the scientific portfolio has the advantage of:
summarizing the eight raw data scoreboards in only one graph (information loss but significance gain)
positioning all the fields of the scientific area on the same graph (according to the indicator of the competition position of the x-axis, the field Mouv has the best position while the field Phys-mat the worst one)
evaluating the effort that the scientific area must make to catch up with the leader in each field (gap to reach the leader line)
showing if the scientific area activity is growing sufficiently in each field either to maintain or catch up the gap with the leader (according to the indicator of the scientific dynamics on the y-axis Aix-Marseilles area tends to have a better growing of their activity that the global growth in all the fields except in the field Math-Info) showing the trend through time of the area scientific activity in each field (the dynamics of positioning on the
x-axis and the y-axis of each field indicates if the scientific area tends to fall behind or to catch up with the leader of each field and if it tends to have superior or inferior growth relative to the scientific areas set)
Such a scientific portfolio representation allows positioning the strategic scientific fields of the Aix-Marseilles area in relation to the "competition" by taking into account the dynamics history of its activity.
References
CALLON, M.; LARRÉDO, P.; MUSTAR P. Gestion de la recherche. La gestion stratégique de la recherche et de la
technologie. Paris: Economica, 1995
ERNST, H. Patent information for strategic technology management. World Patent Information. 2003, Vol. 25, p. 233-242
ROSTAING, H. La bibliométrie et ses techniques. Toulouse: Sciences de la Société, 1996
ROSTAING, H.; GIMENEZ TOLEDO, E.; KISTER, J. Système d’information pour l’aide à la gestion stratégique de la recherche dans un établissement public de recherche. Proceedings: VSST'04, Veille Stratégique, Scientifique &
Technologique. Toulouse: Université Paul Sabatier - IRIT, 2004, vol. 2, p. 157-168
STRATEGOR. Strategor. Politique générale de l’entreprise. Paris: Dunod, 1997 (third edition)
VAN RAAN, A.F.J. Fatal attraction: conceptual and methodological problems in the ranking of universities by bibliometric methods. Scientometrics. 2005, vol. 62, n. 1, p. 133-143
VAN RAAN, A.F.J. Scientometrics: State-of-the-Art. Scientometrics. 1997, vol. 38, n. 1, p. 205-218