https://doi.org/10.1007/s00468-018-1795-8
ORIGINAL ARTICLE
A whole-plant functional scheme predicting the early growth
of tropical tree species: evidence from 15 tree species in Central Africa
Ariane Mirabel1,2 · Dakis‑Yaoba Ouédraogo1 · Hans Beeckman4 · Claire Delvaux4 · Jean‑Louis Doucet1 ·Bruno Hérault2,3 · Adeline Fayolle1 Received: 25 April 2018 / Accepted: 11 December 2018 © Springer-Verlag GmbH Germany, part of Springer Nature 2018
Abstract
Key message This study highlighted the consistency of a functional scheme integrating leaf, stem and root traits, biomass allocation and stem anatomy for 15 tropical tree species at the seedling stage. This functional scheme was shaped by the trade-offs for resource use and the hydraulics of the plants and was found to determine seedling growth. Abstract Functional traits determine plant functioning, performance and response to the environment and define species functional strategy. The functional strategy of 15 African tree species was assessed by (1) highlighting the structure of traits covariance and the underlying functional trade-offs, (2) inferring a whole-plant functional scheme and (3) testing the cor-relation of the functional scheme with plant performance for two early developmental stages (seedlings and saplings). We selected 10 seedlings for each of the 15 species studied from a nursery in south-eastern Cameroon and measured 18 functional traits, including leaf, stem and root traits, biomass allocation and stem anatomy. We assessed the height and diameter growth of the seedlings and the DBH growth and survival for the saplings of nearby plantations. Multivariate analyses highlighted the covariations among the functional traits of the leaf/stem/root, biomass allocation ratios and stem anatomy. The major trait covariation axes were driven by two trade-offs, first between resource acquisition and conservation and second between hydraulic safety and efficiency. The axes were integrated into a Bayesian network inferring a functional scheme at the whole-plant scale, which was found to predict the growth of the seedlings but not the performance of the saplings. The functional strategies of the seedlings were determined by an integrated whole-plant scheme reflecting the trade-offs for resource use and plant hydraulics. The scheme predicted the growth of the seedlings through mechanistic pathways from the wood stem to all the plant traits, but it appeared to shift at the stage of the saplings.
Keywords ‘Fast–slow’ plant economics spectrum · Integrated functional type · Wood anatomy · Ontogeny · Performance · Seedlings · Functional trade-offs
Introduction
A key objective of plant community ecology is to understand how functional traits determine the phenotypic response of plants to environmental factors and their effects on eco-system processes and services (Wright and Westoby 2001; Lavorel and Garnier 2002; Hérault et al. 2011; Aubry-Kientz et al. 2013). Functional traits encompass morphological, phenological and physiological characteristics of plants measurable at the individual scale (Violle et al. 2007). They have been largely adopted in trait-based approaches to describe the species through their biological attributes. Thus, functional traits reduce the dimensionality of species-rich ecosystems and facilitate the comparison of communi-ties and ecosystems, therefore easing the inferences on the Communicated by Grams.
Electronic supplementary material The online version of this
article (https ://doi.org/10.1007/s0046 8-018-1795-8) contains
supplementary material, which is available to authorized users. * Ariane Mirabel
1 TERRA Teaching and Research Center, Gembloux Agro-Bio
Tech, Passage des Déportés 2, 5030 Gembloux, Belgium
2 Cirad, UR Forest and Societies, Montpellier, France
3 INPHB (Institut National Polytechnique Félix Houphouët
Boigny), Yamoussoukro, Ivory Coast
4 Service of Wood Biology, Royal Museum of Central Africa
dynamics and functioning of tropical forests (Scheiter et al.
2013).
The search for contrasting functional types able to dis-criminate species led to a consensus on the relevance of some major continuous trait axes (Reich 2014). The most frequently reported is the leaf economics spectrum (Reich et al. 1997; Wright et al. 2004). One end of the spectrum corresponds to species with tough, dense and long-lived leaves. On the other end are the species with light, large and short-lived leaves (Reich et al. 1997). These species dis-play higher photosynthetic rates but greater susceptibility to damage and herbivory (Caldwell et al. 2015). The leaf economics spectrum also fits a slow-fast continuum of spe-cies strategies from the conservation of resources through long-lived, dense tissues in stressful environments to the potentially fast acquisition of resources when they are avail-able (Chapin 1980). A similar continuum proved consistent for root traits (Bardgett et al. 2014; Valverde-Barrantes et al.
2017) and stem traits (Chave et al. 2009). The stem econom-ics spectrum based on stem traits and properties was recently proposed and consistently predicted the performance of the plants (Chave et al. 2009; Baraloto et al. 2010). The spec-trum specifically highlighted the central role of wood density in determining the hydraulic and mechanical functions of the plant (Fortunel et al. 2013; Beeckman 2016). Functional traits and economic spectra of the leaf, stem and root were well documented separately, but it remains unclear how they correlate with each other, specifically for tropical tree species. While leaf/stem/root traits appeared decoupled for tropical woody species at the adult stage in French Guiana and Peru (Baraloto et al. 2010; Fortunel et al. 2012), they proved to be correlated in several empirical studies and a literature review. Such coupling would argue for an inte-grated economics spectrum at the whole-plant scale (Fre-schet et al. 2010; Bucci et al. 2012; Reich 2014; Valverde-Barrantes et al. 2017). The correlation of functional traits with biomass allocation ratios and stem anatomical traits also remains unclear. Correlations with biomass allocation would be expected, as these are also shaped by resource-use trade-offs between managing with limited resources and maintaining the functions of organs (Poorter et al. 2011; Kleyer and Minden 2015). Similarly, stem anatomy inte-grates different microscopic and macroscopic observation scales and might highlight the mechanisms underlying plant performance (Beeckman 2016). Thus, it has been demon-strated for roots (Hummel et al. 2007) and suggested for wood (Lachenbruch and Mcculloh 2014) that anatomical traits explained interspecific variations in other key traits. Specifically, the combination of fibre and vessel features and the partitioning of stem tissues alone would reflect the vital balance between stem hydraulic and mechanical functions (Chave et al. 2009; Fan et al. 2012). However, anatomical traits and their role in shaping other functional trait values
remain to be clarified through broad multi-trait approaches as proposed by Fortunel et al. (2013) and Poorter et al. (2010), who related wood density to fibre and vessel traits.
Functional traits are expected to shape the average perfor-mance of species and its variation according to the environ-ment (Violle et al. 2007; Rüger et al. 2012). The functional trade-offs underlying trait covariations would then correlate with the demographic trade-offs balancing plant growth and survival. Such a correlation, mediated by the availability of resources, was suggested between the resource acquisi-tion-conservation trade-off and the demographic growth-mortality trade-off (Reich et al. 2003; Reich 2014). How-ever, in practice, correlations between functional traits and performance either proved inconsistent (Paine et al. 2015; Gibert et al. 2016) or varied across different climates and soils (Kitajima and Poorter 2008; Poorter et al. 2008; Russo et al. 2008; Rüger et al. 2012). If some properties, such as the wood density and species maximum height, consist-ently determined plant mean growth (Poorter and Rozendaal
2008; Wright et al. 2010; Rüger et al. 2012), the role of other key traits for plant performance remained unclear. For exam-ple, leaf traits proved to be correlated to seedling growth for 250 Australian species (Westoby and Wright 2003), as well as growth and mortality for 53 tropical tree species (Poorter and Bongers 2006). However, no leaf trait consistently pre-dicted the average specific growth rate of 171 Neotropical tree species (Rüger et al. 2012) or the maximum growth rate and the magnitude of ontogenetic changes in growth for 50 tree species in French Guiana (Hérault et al. 2011). The leaf traits predicted the sapling growth of 37 subtropical tree species only when considered in combination rather than individually (Li et al. 2017).
In studying the role of functional traits and strategies in tropical forest dynamics, early development stages should be carefully examined. Indeed, little is known about the trait-growth relationships in these early development stages, although they correspond to crucial differentiation between species due to the harsh environment of the forest understory (displaying low light and seasonal drought) (Markesteijn and Poorter 2009; Paine et al. 2015). This lack of knowledge is partly attributed to the mismatch between pantropical func-tional trait databases that usually register the trait values of mature trees and the fact that important changes in the trait-performance relationships may occur during plant ontogeny (Visser et al. 2016). In this study, we examined the seedlings of 15 tropical tree species in south-eastern Cameroon for which the functional characteristics and juvenile traits are poorly documented (Markesteijn et al. 2011; Verbeeck et al.
2011). We examined a large set of 18 traits, including leaf, stem and root traits, biomass allocation (leaf/stem and shoot/ root ratios) and stem anatomical traits (tissue proportion, vessel density and diameter and fibre wall thickness). The functional traits were measured on seedlings with similar
development stages raised under optimal conditions in a nursery. In addition, the seedling traits were completed with additional traits at the species level, including seed mass, maximum height, phenology and performance at the sapling stage. We performed multi-trait analyses to highlight the correlation map and trait covariation axes to identify the primary functional trade-offs. Specifically, we questioned the consistency of the widespread resource acquisition-conservation trade-off, the coupling between the leaf/stem/ root traits and the correlations of seedling functional traits with additional traits at the species level. These analyses allowed us to infer an integrative functional scheme at the whole-plant scale. We then examined the correlations of this whole-plant scheme with the performance at both the seed-ling and sapseed-ling stages to identify the mechanistic pathways of plant functioning from anatomical traits to performance through functional traits.
Materials and methods
Study site and speciesWe selected 15 tree species, mostly timber species, wide-spread across the lowland mixed-moist forests of the Guineo-Congolian Region (White 1983). The species were grown in south-eastern Cameroon in the nursery of the Pallisco® Logging Company (3°34′N; 13°24′E) and
germi-nated from seeds collected in the nearby forests. For each species, the seeds were collected from a set of determined mother trees within a 100 km radius in the Forest Manage-ment Units of the company. Mother trees are monitored monthly for phenology and yearly for growth in the frame of the DynAfFor project (https ://www.dynaff or.org/local isati on-des-sites ). The seeds collected were germinated without storage and grown in the controlled conditions of the nurs-ery, following the protocols applied for seedlings intended for forest enrichment and reforestation (Doucet et al. 2009,
2016). The seedlings were planted in nutrient-enriched soils (black soils from villages, i.e. compost), constantly shaded and watered daily. The annual average temperature in the area is 24 °C, and the annual rainfall varies between 1500 and 2000 mm year−1. The 15 species belong to 9 families
and 13 genera. Additional information on leaf phenology at the adult stage (deciduous or evergreen), dispersal mode (animal, wind or unassisted dispersal) and regeneration guild (pioneer, non-pioneer light demander, shade-bearer) at the species level were extracted from Meunier et al. (2015) and complemented by field expertise (J. L. Doucet, pers. com.). The maximum tree height (Hmax in m), maximum diameter
at breast height (Dmax in m) and seed length (SL in cm)
were extracted from the CoForTrait database (Bénédet et al.
2014). The wood density (WD in mg mm−3) was extracted
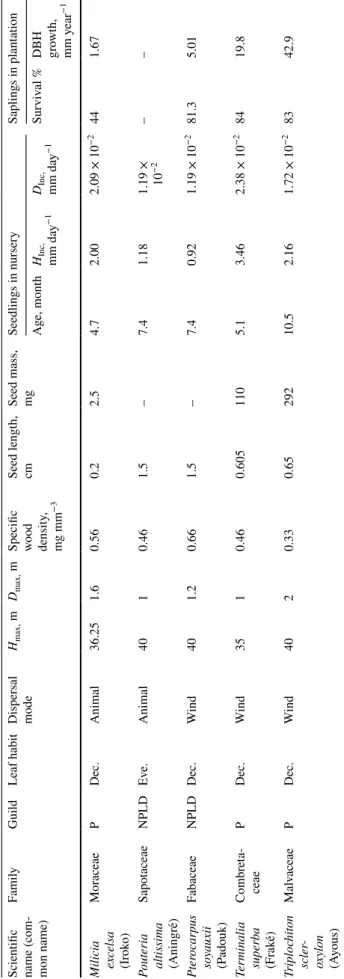
from the Global Wood Density Database (Zanne et al. 2009) and the seed mass (SM in mg, measured for air-dried seeds) from the Seed Information Database (Royal Botanic Gar-dens Kew 2016). Table 1 summarizes the information of the 15 species. Most of the species were deciduous (n = 12 species) and light-demanding at the adult stage, either pio-neers (n = 5) or non-pioneer light-demanders (n = 8). Most of the species had seeds dispersed by wind (n = 7) or animals (n = 7). The maximum tree height ranged from 22 m (Dio-spyros crassiflora [Ebenaceae]) to 50 m (Entandrophragma utile [Meliaceae]), and the wood density ranged from 0.33 (Triplochiton scleroxylon [Malvaceae]) to 0.89 mg mm−3
(Desbordesia glaucescens [Irvingiaceae]).
Trait measurements
A total of 18 traits were measured following standard proto-cols (Pérez-Harguindeguy et al. 2013). Leaf, stem and root traits were selected based on their relevance as proxies of tree species functional strategy (Garnier and Shipley 2001; Borchert 1994; Ostonen et al. 2014) and according to prac-tical constraints, specifically the time-consuming measure-ments of root traits. The traits measured also encompassed biomass allocation ratios (Poorter et al. 2011) and the ana-tomical traits of the stem (Fortunel et al. 2013). For each species, ten seedlings aged from 4 to 10.5 months (Table 1) were selected among the healthier ones, considering their size, number of leaves and potential damage. The total leaf and stem biomass and nine of the leaf and stem functional traits were measured on all ten seedlings (10 seedlings × 9 traits). In addition, the leaf nitrogen content, root biomass, specific root length and stem anatomical traits were meas-ured for a subset of five seedlings per species (5 seed-lings × 18 traits, Table 2).
Leaf/stem/root traits
For all ten seedlings per species, the number of leaves (Nleaves) was counted at the time of sampling. The third leaf
from the apex was collected and stored for 6 h in the refrig-erator to stabilize its metabolism. The petiole length and two perpendicular median diameters were then measured with a calliper, and the leaf was scanned to measure the leaf area (LA in mm2) using ImageJ software (Rasband 2015).
The leaf was then oven dried for 72 h at 65 °C, after which the whole leaf and the petiole alone were weighed. The leaf and petiole dry mass allowed the computation of the specific leaf area (leaf area per unit dry mass; SLA in m2 kg−1), the
leaf dry matter content (leaf dry mass per unit leaf fresh mass; LDMC in mg g−1), the specific petiole length (petiole
fresh length per unit petiole dry mass; SPL in cm g−1) and
the petiole mass fraction (petiole dry mass per unit leaf dry mass; PMF in g g−1). For the subset of five seedlings, the
Table
1
Lis
t of t
he 15 s
tudied species wit
h t heir bo tanical f amil y, r eg ener
ation guild, leaf phenology deciduous (Dec.) or e
ver
gr
een (Ev
e.), dispersal mode (fr
om Meunier e t al. 2015 ), a ver ag e
maximum height and diame
ter seed lengt
h (fr om Bénéde t e t al. 2014 ), w
ood density at species le
vel (fr
om Zanne e
t al.
2009
) and seed mass (fr
om R oy al Bo tanic Gar den K ew 2016 )
Scientific name (com
-mon name) Famil y Guild Leaf habit Dispersal mode Hmax, m Dmax, m
Specific wood density
, mg mm −3 Seed lengt h, cm Seed mass, mg Seedlings in nurser y Saplings in plant ation Ag e, mont h HInc, mm da y −1 DInc, mm da y −1 Sur viv al % DBH growt h, mm y ear −1 Afzelia bipin -densis (Doussié) Fabaceae, Caesal -piniodea NPLD Dec. Animal 28.75 1 0.73 2.5 – 6.7 2.54 2.41 × 10 −2 54.7 5.75 Antr ocar yon klaine -anum (Ozambili) Anacar di -aceae P Dec. Animal 30 1 0.50 1 – 9.9 3.29 1.78 × 10 −2 – – Autr anella congolen -sis (Muk u-lungu) Sapo taceae NPLD Dec. Animal 30 1.5 0.78 3.3 – 7.4 0.95 1.40 × 10 −2 100 6,41 Baillonella to xisper ma (Moabi) Sapo taceae NPLD Dec. Animal 38.75 3 0.72 2.5 – 7.4 2.02 1.85 × 10 −2 58.7 6.76 Desbor desia glauce -scens (Alep) Irvingiaceae SB Ev e. W ind 30 1.75 0.89 2.25 – 6.3 1.20 9.59 × 10 −3 – – Diosp yr os cr assiflor a (Ebène) Ebenaceae SB Ev e. Animal 22.5 1 0.86 1.5 – 7.3 0.92 1.27 × 10 −2 – – Ent andr o-phr agma candollei (Kosipo) Meliaceae NPLD Dec. W ind 40 2 0.57 1.7 370 9.6 0.46 1.52 × 10 −2 – – Ent andr o-phr agma cy lindr icum (Sapelli) Meliaceae NPLD Dec. W ind 40 2 0.57 1.5 312 8.7 0.648 1.15 × 10 −2 72.6 1.71 Ent andr o-phr agma utile (Sipo) Meliaceae NPLD Dec. W ind 50 2.5 0.53 5 300 4.4 1.44 2.51 × 10 −2 73.4 5 Er yt h-rophleum suav eolens (T ali) Fabaceae, Caesal -piniodea P Dec. Unassis ted 30 1.45 0.84 1.05 425 4 1.52 1.56 × 10 −2 88 7,3
Table
1
(continued)
Scientific name (com
-mon name) Famil y Guild Leaf habit Dispersal mode Hmax, m Dmax, m
Specific wood density
, mg mm −3 Seed lengt h, cm Seed mass, mg Seedlings in nurser y Saplings in plant ation Ag e, mont h HInc, mm da y −1 DInc, mm da y −1 Sur viv al % DBH growt h, mm y ear −1 Milicia ex celsa (Ir ok o) Mor aceae P Dec. Animal 36.25 1.6 0.56 0.2 2.5 4.7 2.00 2.09 × 10 −2 44 1.67 Pout er ia altissima (Aning ré) Sapo taceae NPLD Ev e. Animal 40 1 0.46 1.5 – 7.4 1.18 1.19 × 10 −2 – – Pt er ocar pus so yauxii (P adouk) Fabaceae NPLD Dec. W ind 40 1.2 0.66 1.5 – 7.4 0.92 1.19 × 10 −2 81.3 5.01 Ter
minalia superba (Frak
é) Combr et a-ceae P Dec. W ind 35 1 0.46 0.605 110 5.1 3.46 2.38 × 10 −2 84 19.8 Tr iploc hit on scler -oxy lon (A yous) Mal vaceae P Dec. W ind 40 2 0.33 0.65 292 10.5 2.16 1.72 × 10 −2 83 42.9 Abbr eviations f or r eg ener
ation guild cor
respond t o P pioneers, NPLD non-pioneers light-demanders, SB Shade Bear ers
dry leaf was stored in silica gel for later determination of the leaf nitrogen content (nitrogen mass per unit leaf dry mass; LNC in mg g−1) using the Kjeldahl method.
A 5-cm long stem sample was collected at a third of the plant height for the ten seedlings per species. The fresh vol-ume of the samples was computed from its length and diam-eter. The stem sample was weighed first immediately after cutting and then after soaking for 24 h in tap water once the tissues were water-saturated. The weights and volume were combined to compute the stem density (SD in mg mm−3)
and saturated water content (stored water mass per unit stem fresh mass; SWC in %).
For the subset of five seedlings per species, the roots were cleaned with water and sorted to obtain a sample of
the secondary roots (diameters < 2 mm) with at least 10 absorptive roots. The sample was stained for 24 h in a 0.1% methylene blue solution and scanned to measure the root length using QGIS software (Development Team Quantum GIS 2015). The root sample was oven dried for 72 h at 65 °C and weighed to compute the specific root length (root length per unit dry mass; SRL, in m g−1).
Biomass allocation
For all ten seedlings, the leaf and stem compartments were separated. For the subset of five seedlings, the root compart-ment was also separated. The leaves and roots were oven dried for 72 h at 65 °C, and the stem was oven dried for Table 2 List of the 18 functional traits measured on 15 tropical tree
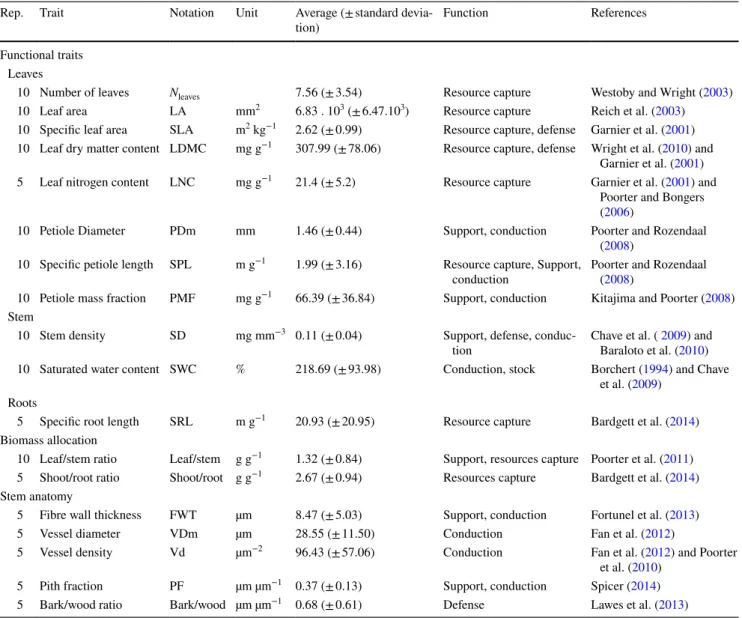
species at the seedling stage, including leaf, stem and root traits, bio-mass allocation ratios and stem anatomical traits. Sampling effort (number of seedlings measured for each species), trait name,
corre-sponding abbreviation, unit, average value and standard deviation for the whole dataset, trait function and corresponding references are given for each trait
Rep. Trait Notation Unit Average (± standard
devia-tion) Function References
Functional traits Leaves
10 Number of leaves Nleaves 7.56 (± 3.54) Resource capture Westoby and Wright (2003)
10 Leaf area LA mm2 6.83 . 103 (± 6.47.103) Resource capture Reich et al. (2003)
10 Specific leaf area SLA m2 kg−1 2.62 (± 0.99) Resource capture, defense Garnier et al. (2001)
10 Leaf dry matter content LDMC mg g−1 307.99 (± 78.06) Resource capture, defense Wright et al. (2010) and
Garnier et al. (2001)
5 Leaf nitrogen content LNC mg g−1 21.4 (± 5.2) Resource capture Garnier et al. (2001) and
Poorter and Bongers
(2006)
10 Petiole Diameter PDm mm 1.46 (± 0.44) Support, conduction Poorter and Rozendaal
(2008)
10 Specific petiole length SPL m g−1 1.99 (± 3.16) Resource capture, Support,
conduction Poorter and Rozendaal (2008)
10 Petiole mass fraction PMF mg g−1 66.39 (± 36.84) Support, conduction Kitajima and Poorter (2008)
Stem
10 Stem density SD mg mm−3 0.11 (± 0.04) Support, defense,
conduc-tion Chave et al. ( Baraloto et al. (20092010) and )
10 Saturated water content SWC % 218.69 (± 93.98) Conduction, stock Borchert (1994) and Chave
et al. (2009)
Roots
5 Specific root length SRL m g−1 20.93 (± 20.95) Resource capture Bardgett et al. (2014)
Biomass allocation
10 Leaf/stem ratio Leaf/stem g g−1 1.32 (± 0.84) Support, resources capture Poorter et al. (2011)
5 Shoot/root ratio Shoot/root g g−1 2.67 (± 0.94) Resources capture Bardgett et al. (2014)
Stem anatomy
5 Fibre wall thickness FWT µm 8.47 (± 5.03) Support, conduction Fortunel et al. (2013)
5 Vessel diameter VDm µm 28.55 (± 11.50) Conduction Fan et al. (2012)
5 Vessel density Vd µm−2 96.43 (± 57.06) Conduction Fan et al. (2012) and Poorter
et al. (2010)
5 Pith fraction PF µm µm−1 0.37 (± 0.13) Support, conduction Spicer (2014)
72 h at 103 °C. All the compartments were then weighed to compute the leaf/stem and shoot/root ratios (in g g−1).
Stem anatomy
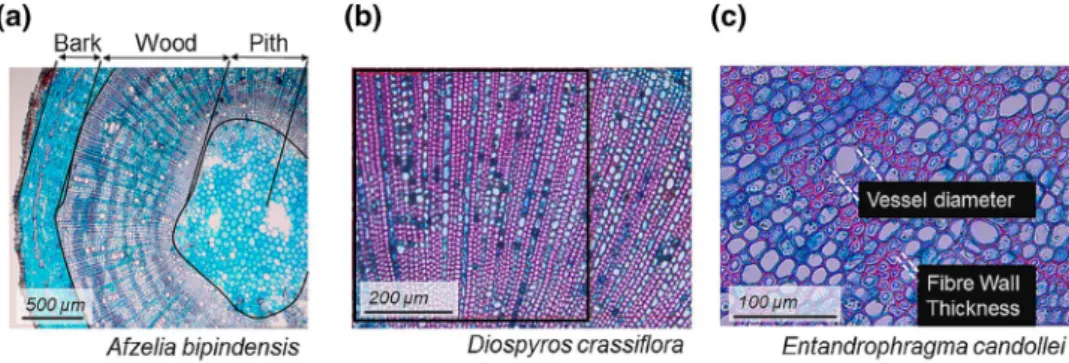
After the measurement of the stem functional traits (SD and SWC), the stem samples were stored in 38° alcohol to prevent tissue drying. In the lab, five thin sections of the samples were cut using a mechanical microtome (12–16 µm thick), stained in a safranin/alcian blue mixture before dehy-dration in ethanol at 50, 75, 95 and 100% and mounted. The best thin section was selected for each sample under the microscope, and pictures were taken at various objective magnifications. Anatomical traits were measured with image analysis using ImageJ software (Fig. 1). The widths of the pith, wood and bark were measured with the 2.5 magnifica-tion objective lens (Fig. 1a) to compute the pith fraction (pith thickness per unit section radius; PF in µm µm−1) and
the bark/wood ratio (bark thickness per unit wood section radius; bark/wood in µm µm−1). The vessel surface density
(number of vessels per unit surface area; Vd in n µm−2,
Fig. 1b) was measured with the 20 magnification objective lens by counting the vessels in a 0.25 mm2 area. The
aver-age vessel diameter (VDm in µm) and fibre wall thickness (FWT in µm) were measured from 30 randomly selected vessels and wood fibres (Fig. 1c) with the 40 magnification objective lens.
Performance measurements
At the seedling stage, the height and diameter absolute incre-ments were computed at the time of the sampling. Prior to the trait measurements, the height of all ten seedlings and two perpendicular diameters were measured at a third of the total plant height (to avoid the remaining cotyledons). The height and diameter of the seedlings were normalized by their age in days, known from the precise recording of the
germination of the seeds, to compute the height and diameter increments (HInc and DInc in mm day−1) of the seedlings.
At the sapling stage, the DBH growth rates (mean and maximum) and survival in plantation were extracted from Doucet et al. (2016, Table 1) for 10 of the 15 study species. The species missing were Antrocaryon klaineanum [Anac-ardiaceae], D. glaucescens [Irvingiaceae], D. crassiflora [Ebenaceae], Entandrophragma candollei [Meliaceae] and
Pouteria altissima [Sapotaceae] (Table 1). Seedlings grown
in the same nursery and conditions as those of the seed-lings used for trait measurements were planted in 14 plots installed between 2009 and 2014 during the rainy season. At the time of planting, the seedling height was 50 cm high on average, with a 2.1 cm standard deviation, and the seedling diameter at 10 cm above the stem base ranged from 5.0 to 11.5 mm. The plots were located between 10 and 70 km from the nursery in highly degraded areas along roads on Ferralsols (Doucet et al. 2016). The understory was clear-cut before planting by keeping only the high-value species and the trees with a DBH greater than 50 cm. At the time of planting, the remaining canopy cover ranged from 8.2 to 70.5%. The plots corresponded to a mixture of species planted in pure-species blocks (15 × 15 m planted with 25 conspecific seedlings). Species were planted in blocks where their shade tolerance matched the canopy openness. Thus, the mixture of species differed for each plot. The number of species varied from 2 to 10 per plot. After plantation, 75% of the seedlings were planted in fully open areas (81% of the pioneers and 62% of the non-pioneer species). Doucet et al. (2016) analysed sapling performance using a DBH growth model. A linear mixed model was adjusted on 4621 surviving saplings with species and species-time interaction as fixed effects and individuals as random effects. The fixed model parameters were extracted for each species to obtain their mean DBH growth rate (in mm year−1). The maximum
DBH growth rates (in mm year−1) of species were computed
as the mean growth rate of the best performing individu-als (i.e. the best 10% of stems) obtained by extracting the
Fig. 1 Protocol for stem anatomy measurements: a tissues proportion was measured with the 2.5 magnification objective lens, b vessel den-sity was measured with the 200 magnification objective lens based on
vessel count on 0.25 mm2 and c vessel diameter and fibre wall
thick-ness were measured with the 400 magnification objective lens for 30 vessels and fibres randomly selected
best linear unbiased estimate of the random effects for each individual. The species survival (%) at 690 days after plant-ing was estimated usplant-ing the Kaplan–Meier estimator, which gives the probability at time t of individuals surviving since planting (Kaplan and Meier 1958).
Data analyses
The correlation map and the main correlation axes among the leaf, stem and root functional traits, biomass allocation ratios and stem anatomical traits at the seedling stage were highlighted with a principal component analysis (PCA). To account for the trait intraspecific variability, trait analyses were performed at an individual scale rather than on spe-cies averages.
A first analysis was conducted on the 18 trait values measured on the subset of five seedlings. The analysis was confirmed with a second one conducted on the nine trait values measured on all 10 seedlings. In addition, trait covari-ations were examined using pairwise Pearson multiple cor-relation tests with P values adjusted for multiple tests using the Holm correction (Holm 1979). The seedling height and diameter increments were added to the PCA analysis as sup-plementary variables. This allowed mapping the seedling growth parameters in the functional space to compute their interrelation with other functional traits without changing the definition of the PCA axes.
To assess the relationships between trait values and both literature-based trait information and species-level perfor-mance, non-parametric correlation tests were performed between species-level performance and species mean trait values and scores on the first two PCA axes. Spearman correlation tests were performed for quantitative variables (wood density, seed length and mass, growth and survival at the seedling and sapling stages), and Kruskal–Wallis tests were performed for qualitative variables (regeneration guild and leaf phenology).
The contributions of the traits to the PCA axes were cal-culated as their relative inertia, i.e. the square of the trait coordinates relative to the eigenvalue of the axis considered. The traits defining more than 10% of the two first axes were integrated into a Bayesian network. The Bayesian analysis inferred a directed acyclic graph (DAG) corresponding to a whole-plant functioning scheme. To preserve the logic of the axes, the DAG was constrained by preventing links between traits of the two axes. To test the mechanistic pathways across scales, the direction of the relationships was imposed from anatomical traits to organ functional traits and perfor-mance variables and from all traits to perforperfor-mance variables. To account for the intraspecific dependencies among all the traits and performance, the regression coefficients (r) were computed using a mixed model with species as a grouping variable.
All analyses were conducted within the R environment version 3.1.3 (R Core Team 2014) using the ade4 package for multivariate analysis (Dray and Dufour 2007), the psych package for multiple correlation tests (Revelle 2015), the abn package for Bayesian network analysis (Lewis 2016) and the plotrix package for figures (Lemon 2006).
Results
Among the 15 tropical tree species studied, the most variable traits at the seedling stage were the SPL (2.0 ± 3.16 m g−1)
and the SRL (20.93, ± 20.95 m g−1), both showing a
100-fold variation, and the LA (6.83 ± 6.47 × 103 mm2)
(Table 2). The measures were in the range of the values pre-viously reported at the adult stage (Cornelissen et al. 2003; Pérez-Harguindeguy et al. 2013). The SLA ranged from 1.18 (D. crassiflora [Ebenaceae]) to 4.45 m2 kg−1 (Milicia excelsa
[Moraceae]), the LDMC from 180.62 (Terminalia superba [Combretaceae]) to 477.80 mg g−1 (D. crassiflora), the LNC
from 13.3 (D. crassiflora) to 30.0 mg g−1 (M. excelsa) and
the SRL from 3.37 (Baillonella toxisperma [Sapotaceae]) to 74.07 mg g−1 (M. excelsa).
Trait covariations
The trait covariations among the 15 tropical tree species at the seedling stage highlighted a strong coupling between the leaf, stem and root functional traits. The first covaria-tion axis was shaped at the whole-plant scale by a trade-off between resource acquisition and conservation. The second covariation axis highlighted the strong correlations between the biomass allocation ratios and vessel traits determined by a plant hydraulics trade-off (Fig. 2).
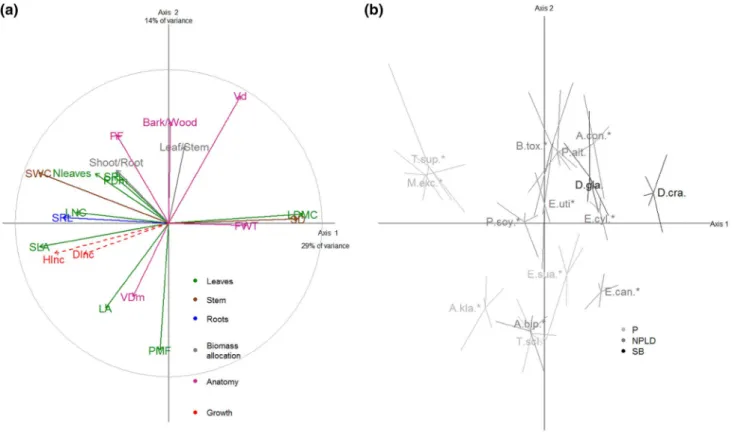
The multivariate analysis of trait correlations (PCA) con-ducted at the seedling stage (n = 75, 5 seedlings × 15 species) for the 18 functional traits highlighted two major trait axes (43% of the total variance, Fig. 2). The first axis (29% of the explained variance) was defined by the leaf, stem and root functional traits involved in the resource acquisition-con-servation trade-off. In particular, the contributions of SLA, LDMC, SWC, SD and SRL ranged from 9.2 to 14.8% of the axis definition. The first axis opposed species with dense tissues (high LDMC, SD and FWT), such as true Ebony, D. crassiflora, against species with large exchange sur-faces (high SLA, SRL and SWC), such as Limba/Fraké, T. superba. This axis also highlighted the correlation between the SD and FWT (r = 0.36, P = 0.077).
The second axis (14% of the explained variance) was defined by functional traits more likely to be involved in plant hydraulics. In particular, it was defined by the coor-dination between the vessel density, petiole mass fraction and bark/wood biomass allocation ratio. Biomass allocation
and anatomical traits contributed from 12.5 to 19.6% of the second axis definition. On the positive end of the axis were species such as Mukulungu, Autranella congolensis [Meliaceae], with a high allocation of shoot biomass to the leaves and a high allocation of total biomass to the shoot. On the negative end of the axis were species such as Ayous, T. scleroxylon [Malvaceae], with large vessels and an important petiole mass fraction. These results were confirmed by both pairwise Pearson correlation tests (Table S1) and the results of the PCA conducted on the restricted set of 9 traits avail-able for 10 seedlings per species (n = 150, Fig. S1). The third axis (10% of the total variance) was primarily defined by the leaf/stem ratio, LA and petiole diameter. It was redundant with the second axis, and its interpretation supported similar concepts.
Considering the additional information at the species level, positive correlations were found with species mean scores on the first PCA axis (resource use). The species wood density and seed size (both length and mass) were pos-itively correlated with the scores on the first axis (r = 0.58, P = 0.023 for WD; r = 0.54 = 3, P = 0.065 and r = 0.77,
P = 0.072 for seed length and mass, respectively; Table S2). The results of the Kruskal–Wallis tests also showed sig-nificant relationships between the first axis and the species regeneration guild (P = 0.037). Thus, species with positive scores on the first trait axis displayed dense leaves, dense wood and large seeds and were shade-tolerant. Parallel spe-cies with negative scores displayed lighter leaves and wood and smaller seeds and were either pioneers or non-pioneer light-demanders. There were no significant relationships between the second trait axis (plant hydraulics) and any additional trait at the species level (Table S2).
Relationships between the traits and performance
The functional traits of the seedlings were significantly cor-related to growth at both the seedling and sapling stages. However, there was a strong shift in some trait-growth rela-tionships between the two ontogenetic stages.
At the seedling stage, scores on the first axis were signifi-cantly and positively correlated with the height increment in the nursery (Fig. 2; Table 3). Seedling height increments Fig. 2 a PCA of the 18 functional traits measured on 15 tropical tree
species at the seedling stage (n = 5 seedlings). The correlation circle is given for the 18 traits with a colour code corresponding to leaf (green), stem (brown) and roots (blue) traits, biomass allocation ratios (grey) and stem anatomy (pink). The height and diameter increments of seedlings are displayed as supplementary variables (red). b Loca-tion of the 15 studied species in the factorial plan defined by the two
first trait axes, radiating lines linking individuals to the corresponding barycenter of each species. Deciduous species are indicated by aster-isk and the grey levels indicates regeneration guild from pioneers (P, light grey), to non-pioneer light-demanders (NPLD, dark grey) and shade bearers (SB, black). Species are named by the Genus first letter
were also correlated with individual traits, including the functional traits of the leaf (LA, SLA, LDMC and PDm), stem (SD and SWC) and root (SRL), and with biomass allo-cation ratios (shoot/root and leaf/stem ratios) and anatomi-cal traits (VDm, Vd, FWT, PF and bark/wood ratio). At the species level, the only correlation was between the height increment of the seedlings and the species regeneration guild (P = 0.047). Pioneers and non-pioneer light-demand-ers showed average height increments of 2.5 mm day−1 and
1.3 mm day−1 respectively.
At the sapling stage, there was no relationship between sapling performance in the plantations and the average scores of species on the two trait axes. However, some seedling individual traits were correlated with sapling
performance in the plantation. The sapling mean DBH growth measured in the plantation was positively correlated with the seedling shoot/root ratio (r = 0.78 and P = 0.012). Similarly, the maximum sapling DBH growth was positively correlated with the petiole mass fraction of the seedlings and the bark/wood ratio (r = 0.61, P = 0.066 and r = − 0.58,
P = 0.088, respectively, Table 3). For example, Ayous, T.
scleroxylon, saplings had the highest maximum and mean growth rates in the plantation, and the seedlings displayed the highest petiole mass fraction and bark/wood ratio and the third highest shoot/root ratio.
The only correlation between the seedling and sapling stage growths was a weak correlation between the seedling height increment and sapling DBH increment. However, Table 3 Pearson correlation
coefficients for the 15 species between seedlings’ height and diameter absolute increments and their 18 functional traits, biomass allocation ratios and stem anatomical traits and coordinates along the two main trait-PCA axes
Spearman correlation coefficients between the same seedlings’ information and species mean and maxi-mum growth rates at the sapling stage, and survival rate at 690 days in plantation. Significant correlations are showed in bold and significance levels are indicated with **P < 0.05 and * P < 0.1
Seedlings in nursery (n = 15 species) Saplings in plantation (n = 10 species)
HInc (mm day−1) D
Inc (mm day−1) Mean DBHInc
(mm year−1) Max DBH(mm year−1Inc) Survival (%)
Seedling traits Leaves Nleaves 0.50** 0.33** − 0.07 0.22 0.05 LA 0.59** 0.30 0.37 0.31 − 0.37 SLA 0.51** 0.39** − 0.28 0.12 − 0.31 LDMC − 0.51** − 0.41** 0.24 0.05 0.15 LNC 0.33 0.34 − 0.27 − 0.3 − 0.32 PDm 0.43** 0.25 0.19 − 0.08 − 0.33 SPL 0.13 0.07 − 0.37 − 0.16 0.03 PMF 0.19 0.07 0.52 0.61* 0.24 Stem SD − 0.57** − 0.44** 0.08 − 0.09 0.38 SWC 0.45** 0.32** − 0.19 0.05 − 0.19 Roots SRL 0.36** 0.22 0.1 0.26 − 0.07 Biomass allocation Leaf/stem − 0.31** − 0.19** − 0.31 0.05 0.24 Shoot/root 0.43** 0.11 0.78** 0.54 0.14 Stem anatomy FWT − 0.41** − 0.15 0.01 − 0.25 0.26 VDm 0.34** 0.42** 0.15 0.05 − 0.37 Vd − 0.43** − 0.43** − 0.26 − 0.42 0.21 PF 0.45** 0.18 0.12 − 0.08 − 0.04 Bark/wood − 0.22** − 0.09 − 0.38 − 0.58* − 0.14 PCA coordinates Axis 1 0.75** 0.56 − 0.02 − 0.26 0.26 Axis 2 0.17 0.17 − 0.16 − 0.25 0.18 Growth values Hinc / / 0.58* 0.43 − 0.13 Dinc / / − 0.04 0.21 0.35
important growth at the seedling stage tended to correspond to the highest mean growth rate in the plantations. For exam-ple, T. scleroxylon had the fourth highest height increment at the seedling stage (2.2 mm day−1) and the highest mean
growth rate at the sapling stage (19.8 mm year−1). In
con-trast, Sapelli, Entandrophragma cylindricum [Meliaceae], had the second lowest height increment at the seedling stage (0.5 mm day−1) and the second lowest mean growth rate at
the sapling stage (1.67 mm year−1).
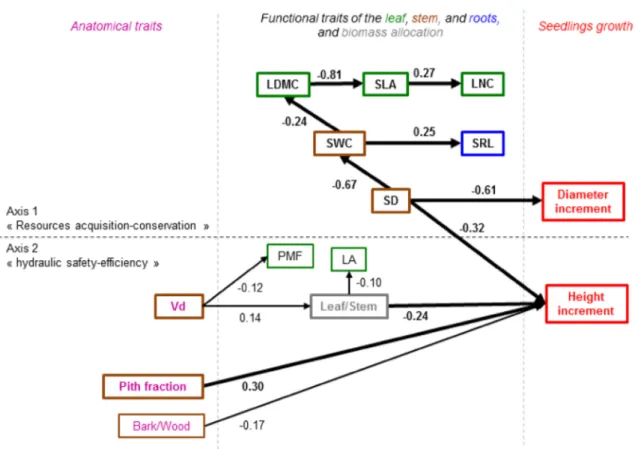
Inferred seedling functional scheme
Based on the PCA analysis, we used the traits linked to the main axes and the seedling growth values to construct a directed acyclic graph (DAG) and infer the functional scheme at the whole-plant scale (Fig. 3). The DAG was constructed with the functional traits (SD, SWC, SRL, LA, SLA, LNC, LDMC and PMF), biomass allocation (leaf/ stem) and anatomical traits (bark/wood ratio, PF and Vd). The leaf/stem ratio and SD were directly related to the height increment (r = − 0.24 and r = − 0.32, respectively). Traits involved in the first trait axis shaped by the functional
trade-off for resources use were related to the growth in the height and diameter through the stem density (r = − 32 and r = − 61, between the SD and increments in height and diameter, respectively). Vessel density was a determinant of the biomass allocation ratios (r = 0.14 between Vd and the leaf/stem ratio) and some of the leaf traits (r = − 0.12 between Vd and PMF). Although the fibre wall thickness had been input as a variable to draw the DAG, it did not stand out significantly. Traits involved in the second PCA axis shaped by the trade-off between hydraulic safety and efficiency were directly related to the height increment (r = − 0.17 for the bark/wood ratio and r = 0.30 for PF).
Discussion
Trait covariations have been widely documented within organs sampled individually using the definition of the worldwide Leaf Economics Spectrum (Wright et al. 2004) and the Stem Economics Spectrum (Chave et al. 2009). However, the consistency of the trait covariations at the whole-plant scale remains a topic of debate (Baraloto et al.
Fig. 3 Directed acyclic graph (DAG) inferred from a Bayesian net-work analysis based on the functional traits determining more than 10% of the PCA axis and their relations to the seedlings’ growth. The regression coefficients indicating the relationship between nodes were calculated from a mixed model with seedlings species as
group-ing variable. The direction of the arrows was imposed from anatomi-cal traits to functional traits, biomass allocation ratios and seedlings’ growth. Growth variables were defined as terminal nodes and no con-nections between traits defining the different axes were allowed
2010; Freschet et al. 2010; Reich 2014). In this study, we examined the covariations among 18 functional traits of all plant organs (leaf/stem/root), biomass allocation ratios and anatomical traits of the stem for 15 tropical tree species at the seedling stage. Trait measurements were conducted on individuals of the same life-cycle stage (seedling) grown in comparable conditions; thus avoiding the variability due to the environment and plant ontogeny (Rüger et al. 2012). Our results highlighted two orthogonal axes of trait covari-ations. The first axis, specifically driven by D. crassiflora, M. excelsa and T. superba, corresponded to the coordina-tion of the leaf, stem and root traits. This trait coordinacoordina-tion supported the coupling among all the organs and was not entirely consistent with the conclusions of Baraloto et al. (2010) and Fortunel et al. (2012). This result suggested that leaf and stem coupling is specific to light-demanding species (Makesteijn et al. 2011; Martínez-Garza et al.
2013). However, our results were consistent with the inte-grated whole-plant functional coordination proposed by Reich (2014) and revealed among functional groups by Martínez-Garza et al. (2013) for 24 Mexican tree species. The first trait axis corresponded to the global trade-off between resource acquisition and conservation (Kitajima and Poorter 2008) and the reflected species light require-ment. The definition of the axis largely depended on the stem density determined by the fibre wall thickness (FWT) as demonstrated by Fortunel et al. (2013) and Powell et al. (2017). The first trait axis was also related to the growth of the seedlings and could be additionally interpreted as a “fast-slow” continuum (Reich 2014). Species with high light demand and an “acquisitive” strategy showed faster growth than more shade-tolerant species with a “conserva-tive” strategy.
The second axis of the trait covariations was shaped by the coordination of the biomass allocation ratios (leaf/stem ratio and petiole mass fraction) and the vessel traits (density and diameter). This second axis was interpreted as the trade-off between safety and the efficiency of hydraulic conductiv-ity (Fortunel et al. 2013; Lachenbruch and Mcculloh 2014; Beeckman 2016). This axis illustrates the trade-off, already reported for 42 coexisting species in Bolivia (Poorter et al.
2010), between the number and size of the vessels. The axis opposed species with small numerous vessels, which lim-its the cavitation risks and enforces the safety of hydraulic conduction, against species with fewer large vessels, which allows a more efficient hydraulic conductivity (Markesteijn et al. 2011). The axis with more efficient hydraulic conduc-tivity, ensured by a large vessel diameter and a low vessel density, was associated with leaf traits recognized to imply a high water demand (large leaf area and specific leaf area). Such an association was consistent with the observations of a wide range of species and functional types in Amazonia (Powell et al. 2017).
In addition to the descriptive multivariate analyses, the functional scheme inferred confirmed the consistency of a whole-plant functional scheme. It was driven by the func-tional trade-offs for resource use and plant hydraulics and highlighted the mechanistic pathways between the hierar-chical scales from the anatomical traits to functional traits of all the organs (Fig. 3) and eventually to plant growth. Specifically, the anatomical traits of the vessel density, bark/ wood ratio and pith fraction determined the functional traits of all the organs (SD, SWC, SLA, LDMC and SRL). In turn, the functional traits of the organs predicted the individual growth in height and diameter (Reich 2014; Beeckman
2016). This result emphasized the importance of hydraulic conductivity for plant growth at the seedling stage (Fan et al.
2012; Poorter et al. 2010), although the regression coeffi-cients of the correlations remained low. It also emphasized the need to account for a large set of anatomical traits to define species functional strategy: the fibre wall thickness, usually thought as a key trait to consider (Fan et al. 2012), did not significantly integrate into the scheme. In addition, the functional scheme confirmed the central role of wood density (Chave et al. 2009; Wright et al. 2010; Lachenbruch and Mcculloh 2014). As previously noted, stem density determined the seedling growth and other key functional traits, consistent with the pioneer study of Poorter and Bongers 2006 and several other studies and meta-analyses (Poorter et al. 2008; Rüger et al. 2012; Gibert et al. 2016).
The functional traits of the seedlings proved predic-tive of plant growth at the seedling stage. However, only three traits predicted sapling growth (the shoot/root ratio, the petiole mass fraction and the bark/wood ratio), and none predicted sapling survival. Such disconnection in tree performance between ontogenetic stages has already been reported across the whole life-cycle and had been related to tree size (Hérault et al. 2011; Rüger et al. 2012; Prado-Junior et al. 2016). Thus, in a meta-analysis, Gibert et al. (2016) reported the disappearance of some trait-growth relationships during the ontogeny. Similarly, Visser et al. (2016) showed that during the whole life-cycle, the per-formance was first primarily determined by seed mass and adult stature at the seedling stage and by wood density at the sapling and adult stages. Therefore, we found an integrative role of stem density (SD) during plant devel-opment. At the seedling stage, stem density was strongly correlated to height and diameter increments (respec-tively, r = − 0.57 and r = − 0.44, P < 0.05), while Doucet et al. (2016) identified a correlation between performance and wood density from a global database at the sapling stage. In contrast, it is only at the seedling stage that the leaf traits (LA, SLA, LDMC and petiole diameter) fully integrated into the “fast-slow” economics spectrum and consistently predicted plant growth (Wright et al. 2010). Among the leaf traits, only the petiole mass fraction was
related to the average specific growth rate at the sapling stage. Petioles that ensure the leaf mechanical support and sap conduction compensate for the hydrostatic constraints resulting from the plant height and leaf transpiration sur-face (Niinemets et al. 2004; Cavaleri et al. 2010). Petiole allometry directly depends on the plant growth rate at any stage. In contrast, the other leaf traits did not relate to the sapling growth rate and displayed significant varia-tion, as already experienced in another in situ experiment, particularly for tropical tree species (Poorter et al. 2008; Lloyd et al. 2010; Hérault et al. 2011; Markesteijn et al.
2011; Rüger et al. 2012). In particular, the SLA proved unsuitable for predicting the seedling growth rates (Paine et al. 2015), suggesting its strong dependence on the environment, as demonstrated for 15 tropical tree species (Philipson et al. 2014) and 37 subtropical tree species (Li et al. 2017). In addition, trait de-correlation with sapling growth may come from a shift in the role of the traits during the ontogeny. This was theorized by Falster et al. (2011) and revealed by the meta-analysis of Gibert et al. (2016) and for tropical tree species in Central Panama (Visser et al. 2016) and Australia (Sendall et al. 2018). The shift in the role of the traits would also be stronger for light-demanding species whose growth depends first on the efficiency of light interception and second on water use, thus involving different leaf traits (Delagrange et al.
2008; Poorter et al. 2008; Wright et al. 2010; Prado-Junior et al. 2016; Sendall et al. 2018). Our results based on not only classical functional traits but also biomass alloca-tion and stem anatomical traits are consistent with those of Wright et al. (2010), who already mentioned that“[al] though WD [Wood Density] provides a promising start, a successful trait-based ecology of tropical forest trees will require consideration of additional traits”. This motivates the focus on new traits, such as the petiole mass fraction or diameter, and additional development of standardized protocols (Garnier and Shipley 2001) to fit the particulari-ties of the tropical tree species.
Our analyses produced a consistent functional scheme at the whole-plant scale for light-demanding and some shade-tolerant species. This integrative scheme was shaped by two major functional trade-offs and highlighted the mechanistic pathway from the anatomical and organ functional traits that determine plant growth. Put in perspective with con-tradictory results (Baraloto et al. 2010; Fortunel et al. 2012; Paine et al. 2015), the consistency of the whole-plant scheme argues for the need to consider the specificity of central Afri-can species ecology (Verbeeck et al. 2011). It also argues for the consideration of ontogenetic shifts in the species func-tional strategies (Hérault et al. 2011; Gibert et al. 2016) and advocates an individual-based approach to avoid confusing intraspecific, environmental and ontogenetic variability of the functional traits (Rüger et al. 2012; Visser et al. 2016).
Author contribution statement AF, DYO, HB, CD and JLD conceived the ideas and designed the methodology. AM and DYO collected the data. AM and BH analysed the data. AM, AF and DYO led the writing of the manuscript. All the authors contributed critically to the drafts and gave final approval for publication.
Acknowledgements The authors are grateful to the Pallisco Logging Company for access to the site, to the NGO Nature Plus for logis-tic support, and to Françoise Toussaint and Gilles Collinet from the Soil-System Unit of Gembloux Agro-Bio Tech, University of Liège, Belgium, for the chemical analyses of leaf samples. We also thank Eric Marcon and Stéphane Traissac from the EcoFoG Unit, French Guiana, for valuable comments on the manuscript. A. M. benefitted from a grant of the Agence Universitaire de la Francophonie (AUF). Part of this study was funded by the HERBAXYLAREDD project (BR/143/ A3/HERBAXYLAREDD).
Data accessibility The data are available from the Dryad database.
Compliance with ethical standards
Conflict of interest The authors declare that they have no conflict of interest.
References
Aubry-Kientz M, Hérault B, Ayotte-Trépanier C, Baraloto C, Rossi V (2013) Toward trait-based mortality models for tropical forests. PLoS One 8(5):e63678
Baraloto C, Paine TCE, Poorter L, Beauchene J, Bonal D, Domenech AM et al (2010) Decoupled leaf and stem economics in rain forest trees. Ecol Lett 13:1338–1347
Bardgett RD, Mommer L, De Vries FT (2014) Going underground: root traits as drivers of ecosystem processes. Trends Ecol Evol 29:692–699
Beeckman H (2016) Wood anatomy and trait-based ecology. IAWA J 37:127–151
Bénédet F, Vincke D, Fayolle A, Doucet JL, Gourlet-Fleury S (2014) Cofortraits, African plant traits information database. Version 1.0
Borchert R (1994) Soil and stem water storage determine phe-nology and distribution of tropical dry forest trees. Ecology 75:1437–1449
Bucci SJ, Scholz FG, Campanello PI, Montti L, Jimenez-Castillo M, Rockwell FA et al (2012) Hydraulic differences along the water transport system of South American Nothofagus species: do leaves protect the stem functionality? Tree Physiol 32:880–893 Caldwell E, Read J, Sanson GD (2015) Which leaf mechanical traits
correlate with insect herbivory among feeding guilds? Ann Bot 117-2:349–361
Cavaleri MA, Oberbauer SF, Clark DB, Clark DA, Ryan MG (2010) Height is more important than light in determining leaf morphol-ogy in a tropical forest. Ecolmorphol-ogy 91(6):1730–1739
Chapin FS (1980) The mineral nutrition of wild plants. Annu Rev Ecol Syst 11:233–260
Chave J, Coomes D, Jansen S, Lewis SL, Swenson NG, Zanne AE (2009) Towards a worldwide wood economics spectrum. Ecol Lett 12:351–366
Cornelissen JHC et al (2003) A handbook of protocols for standard-ized and easy measurement of plant functional traits worldwide. Aust J Bot 51:335–380
Delagrange S, Potvin C, Messier C, Coll L (2008) Linking multiple-level tree traits with biomass accumulation in native tree species used for reforestation in Panama. Trees 22(3):337–349 Development Team Quantum GIS (2015) QGIS geographic
informa-tion system. http://qgis.osgeo .org. Accessed May 2015
Doucet JL, Kouadio YL, Monticelli D, Lejeune P (2009) Enrich-ment of logging gaps with moabi (Baillonella toxisperma Pierre) in a Central African rain forest. For Ecol Manage 258(11):2407–2415
Doucet JL, Daïnou K, Ligot G, Ouédraogo DY, Bourland N, Ward SE et al (2016) Enrichment of Central African logged forests with high-value tree species: testing a new approach to regenerat-ing degraded forests. Int J Biodivers Sci Ecosyst Serv Manag 12.1(2):83–95
Dray S, Dufour AB (2007) The ade4 package: implementing the duality diagram for ecologists. J Stat Softw 22(44):1–20 Falster DS, Brännström Å, Dieckmann U, Westoby M (2011)
Influ-ence of four major plant traits on average height, leaf-area cover, net primary productivity, and biomass density in single-species forests: a theoretical investigation. J Ecol 99(1):148–164 Fan ZX, Zhang SB, Hao GY, Slik JWF, Cao KF (2012)
Hydrau-lic conductivity traits predict growth rates and adult stature of 40 Asian tropical tree species better than wood density. J Ecol 100:732–741
Fortunel C, Fine PVA, Baraloto C (2012) Leaf, stem and root tis-sue strategies across 758 Neotropical tree species. Funct Ecol 26:1153–1161
Fortunel C, Ruelle J, Beauchêne J, Fine PVA, Baraloto C (2013) Wood specific gravity and anatomy of branches and roots in 113 Amazo-nian rainforest tree species across environmental gradients. New Phytol 202:79–94
Freschet GT, Cornelissen JHC, van Logtestijn RSP, Aerts R (2010) Evidence of the “plant economics spectrum” in a subarctic flora. J Ecol 98:362–373
Garnier E, Shipley B (2001) A standardized protocol for the determina-tion of specific leaf area and leaf dry matter content. Funct Ecol 15:688–695
Garnier E, Laurent G, Bellmann A, Debain S, Berthelier P, Ducout B et al (2001) Consistency of species ranking based on functional leaf traits. New Phytol 152:69–83
Gibert A, Gray EF, Westoby M, Wright IJ, Falster DS (2016) Plant species traits and growth rates: meta-analysis shows correlations change with plant size, as predicted. J Ecol 104:1488–1503 Hérault B, Bachelot B, Poorter L, Rossi V, Bongers F, Chave J et al
(2011) Functional traits shape ontogenetic growth trajectories of rain forest tree species. J Ecol 99:1431–1440
Holm S (1979) A simple sequentially rejective multiple test procedure. Scand J Stat 6:65–70
Hummel I, Vile D, Violle C, Devaux J, Ricci B, Blanchard A, Garnier E, Roumet C (2007) Relating root structure and anatomy to whole-plant functioning in 14 herbaceous Mediterranean species. New Phytol 173:313–321
Kaplan EL, Meier P (1958) Nonparametric estimation from incomplete observations. J Am Stat Assoc 282(53):457–481
Kitajima K, Poorter L (2008) Functional basis for resource niche par-titioning by tropical trees. Trop For Commun Ecol 2008:160–181 Kleyer M, Minden V (2015) Why functional ecology should consider
all plant organs: an allocation-based perspective. Basic Appl Ecol 16:1–9
Lachenbruch B, Mcculloh KA (2014) Traits, properties, and per-formance: how woody plants combine hydraulic and mechani-cal functions in a cell, tissue, or whole plant. New Phytol 204:747–764
Lavorel S, Garnier E (2002) Predicting changes in community compo-sition and ecosystem functioning from plant traits: revisiting the Holy Grail. Funct Ecol 16:545–556
Lawes MJ, Midgley JJ, Clarke PJ (2013) Costs and benefits of relative bark thickness in relation to fire damage: a savanna/forest contrast. J Ecol 101:517–524
Lemon J (2006) Plotrix: a package in the red light district of R. R-News 6(4):8–12
Lewis FI (2016) ABN: modelling multivariate data with additive
bayes-ian networks. http://cran.r-proje ct.org/packa ge=abn. Accessed
Dec 2016
Li Y, Kröber W, Bruelheide H, Härdtle W, von Oheimb G (2017) Crown and leaf traits as predictors of subtropical tree sapling growth rates. J Plant Ecol 10(11):136–145
Lloyd J, Patiño S, Paiva RQ, Nardoto GB, Quesada CA, Santos AJB et al (2010) Optimisation of photosynthetic carbon gain and within-canopy gradients of associated foliar traits for Amazon forest trees. Biogeosciences 7:1833–1859
Markesteijn L, Poorter L (2009) Seedling root morphology and bio-mass allocation of 62 tropical tree species in relation to drought- and shade-tolerance. J Ecol 97:311–325
Markesteijn L, Poorter L, Paz H, Sack L, Bongers F (2011) Ecological differentiation in xylem cavitation resistance is associated with stem and leaf structural traits. Plant Cell Environ 34:137–148 Martínez-Garza C, Bongers F, Poorter L (2013) Are functional traits
good predictors of species performance in restoration plantings in tropical abandoned pastures? For Ecol Manage 303:35–45 Meunier Q, Moumbogou C, Doucet JL (2015) Les Arbres Utiles du
Gabon. Les presses Agronomiques de Gembloux, Gembloux Niinemets U et al (2004) Petiole length and biomass investment in
support modify light interception efficiency in dense poplar plan-tations. Tree Physiol 24:141–154
Ostonen I, Püttsepp Ü, Biel C, Alberton O, Bakker MR, Lõhmus K et al (2014) Specific root length as an indicator of environmental change. Plant Biosyst 141:426–442
Paine TCE, Amissah L, Auge H, Baraloto C, Baruffol M, Bourland N et al (2015) Globally, functional traits are weak predictors of juve-nile tree growth, and we do not know why. J Ecol 103:978–989 Pérez-Harguindeguy N, Díaz S, Garnier E, Lavorel S, Poorter H,
Jau-reguiberry P et al (2013) New handbook of protocols for stand-ardized measurement of plant functional traits worldwide. Aust J Bot 61:167–234
Philipson CD, Dent DH, O’Brien MJ, Chamagne J, Dzulkifli D, Nilus R, Philips S, Reynolds G, Saner P, Hector A (2014) A trait-based trade-off between growth and mortality: evidence from 15 tropical tree species using size-specific relative growth rates. Ecol Evol 4(18):3675–3688
Poorter L, Bongers F (2006) Leaf traits are good predictors of plant per-formance across 53 rain forest species. Ecology 87(7):1733–1743 Poorter L, Rozendaal DMA (2008) Leaf size and leaf display of
thirty-eight tropical tree species. Oecologia 158:35–46
Poorter L, Wright SJ, Paz H, Ackerly DD, Condit R, Harms E et al (2008) Are functional traits good predictors of demographic rates? Evidence from five neotropical forests. Ecology 89:1908–1920 Poorter L, McDonald I, Alarcon A, Fichtler E, Licona JC,
Peña-Cla-ros M et al (2010) The importance of wood traits and hydraulic conductance for the performance and life history strategies of 42 rainforest tree species. New Phytol 185:481–492
Poorter Z, Niklas KJ, Reich PB, Oleksyn J, Poot P, Mommer L (2011) Biomass allocation to leaves, stems and roots: meta-analyses of interspecific variation and environmental control. New Phytol 193:30–50
Powell TL, Wheeler JK, de Oliveira AAR, Lola de Costa C, Saleska A, Meir P, Moorcroft PR (2017) Differences in xylem and leaf hydraulic traits explain differences in drought tolerance among mature Amazon rainforest trees. Glob Change Biol 23:4280–4293
Prado-Junior JA, Schiavini I, Vale VS, Raymundo D, Lopes SF, Poorter L (2016) Functional traits shape size-dependent growth and mor-tality rates of dry forest tree species. J Plant Ecol 10(16):895–906 R Core Team (2014) R: a language and environment for statistical
computing. http://www.r-proje ct.org/. Accessed Sept 2014
Rasband WS (2015) ImageJ. http://image j.nih.gov/ij/. Accessed Feb
2015
Reich PB (2014) The world-wide “fast-slow” plant economics spec-trum: a traits manifesto. J Ecol 102(2):275–301
Reich PB, Walters MB, Ellsworth DS (1997) From tropics to tundra: global convergence in plant functioning. Proc Natl Acad Sci 94(25):13730–13734
Reich PB, Wright IJ, Cavender-bares J, Craine JM, Oleksyn J, Westoby M et al (2003) The evolution of plant functional variation: traits, spectra, and strategies. Int J Plant Sci 1643:143–164
Revelle W (2015) psych: procedures for personality and
psychologi-cal research. http://cran.r-proje ct.org/packa ge=psych . Accessed
June 2015
Royal Botanic Gardens Kew (2016) Seed information database.
Ver-sion 7.1. Available from: http://data.kew.org/sid. Accessed July
2015
Rüger N, Wirth C, Wright SJ, Condit R (2012) Functional traits explain light and size response of growth rates in tropical tree species. Ecology 93(12):2626–2636
Russo SE, Brown P, Tan S, Davies SJ (2008) Interspecific demographic trade-offs and soil-related habitat associations of tree species along resource gradients. J Ecol 96:192–203
Scheiter S, Langan L, Higgins SI (2013) Next-generation dynamic global vegetation models: learning from community ecology. New Phytol 198:957–969
Sendall KM, Reich PB, Lusk CH (2018) Size-related shifts in carbon gain and growth responses to light differ among rainforest ever-greens of contrasting shade tolerance. Oecologia 2018:1–15 Spicer R (2014) Symplasmic networks in secondary vascular tissues:
parenchyma distribution and activity supporting long-distance transport. J Exp Bot 65:1829–1848
Valverde-Barrantes OJ, Freschet GT, Roumet C, Blackwood CB (2017) A worldview of root traits: the influence of ancestry, growth form, climate and mycorrhizal association on the functional trait varia-tion of fine-root tissues in seed plants. New Phytol 215:1562–1573 Verbeeck H, Boeckx P, Steppe K (2011) Tropical forests: include
Congo basin. Nature 479(7372):179
Violle C, Navas ML, Vile D, Kazakou E, Fortunel C (2007) Let the concept of trait be functional! Oikos 116:882–892
Visser MD, Bruijning M, Wright SJ, Müller-Landau HC, Jongejans E et al (2016) Functional traits as predictors of vital rates across the life cycle of tropical trees. Funct Ecol 30:168–180
Westoby M, Wright IJ (2003) The leaf size-twig size spectrum and its relationship to other important spectra of variation among species. Oecologia 135:621–628
White F (1983) The vegetation of Africa. United Nations Sudano-Sahelien Office, ed. UNESCO, Paris
Wright IJ, Westoby M (2001) Understanding seedling growth rela-tionships through specific leaf area and leaf nitrogen concentra-tion: generalizations across growth forms and growth irradiance. Oecologia 127:21–29
Wright IJ, Reich PB, Westoby M, Ackerly DD (2004) The worldwide leaf economics spectrum. Nature 428:821–827
Wright SJ, Kitajima K, Kraft NJB, Reich PB, Wright IJ, Bunker DE et al (2010) Functional traits and the growth—mortality trade-off in tropical trees. Ecology 91:3664–3674
Zanne AE, Lopez-Gonzalez G, Coomes DA, Ilic J, Jansen S et al (2009)
Global wood density database. Dryad. Available from http://hdl.
handl e.net/10255 .dryad .235. Accessed July 2015
Publisher’s Note Springer Nature remains neutral with regard to jurisdictional claims in published maps and institutional affiliations.