P. Morimont*, T. Desaive*, J.G. Chase**, B. Lambermont*
*Cardiovascular Research Center, University of Liege, Liege, Belgium
* Department of mechanical engineering, University of Canterbury, Christchurch, New Zealand Abstract: The performance of the cardiovascular system depends on the interaction between the left ventricle and the arterial tree. Functional analysis of this interaction requires that the left ventricle and the arterial system be described in similar terms. Effective arterial elastance (Ea) characterizes the functional properties of the arterial system and ventricular end-systolic elastance (Ees) characterizes the ventricular systolic function. The efficiency of energy transfers between the left ventricle and the arterial system strongly depends on Ees/Ea ratio. The aim of this paper is to show the interest of collaboration between cardiologists and engineers, to elaborate new original techniques to assess ventriculo-arterial coupling in critically ill patient and guide hemodynamic therapy
Keywords: Cardiovascular system, Decision support and control of biomedical systems
1. INTRODUCTION
Blood flow creates a continuous interaction between the ventricle and the arterial tree. This interaction, known as ventriculo-arterial coupling, is the main determinant of stroke volume and ejection pressure because it relates effort or force capacity to output resistance or afterload. This concept, which can be applied to the systemic as well as pulmonary circulation, was developed as a whole quantitative and structured theory by Sunagawa (Sunagawa et al., 1984). Theoretically, acute assessment of the ventriculo-arterial coupling should lead to optimal hemodynamic therapy (Lambermont and D'Orio, 2006). The effect of the coupling is mainly seen in changes in ejection fraction and vascular resistances. However, these parameters do not characterize completely ventricular contractility as well as cardiovascular energetics. Thus, it becomes clinically important to define an index reflecting the interaction between arterial and ventricular properties, and consequently the adequacy of the hemodynamic treatment.
However, the technical difficulties of instantaneous pressure
and volume measurements requiring high-fidelity,
manometer-tipped catheters and ultrasonic micro-crystals or conductance catheters have always hampered routine clinical applications due to cost and invasiveness. In addition, it has been generally assumed that the frequency response of the fluid-filled pressure catheter that are used routinely would be insufficient for instantaneous measurements, but would be acceptable for mean pressure estimations. Hence, the goal of regularly measuring ventriculo-arterial coupling remains elusive.
Therefore, the aim of this paper is to show the interest of collaboration between cardiologists and engineers, to elaborate new original techniques to assess ventriculo-arterial coupling in critically ill patient and guide hemodynamic therapy. As described, it is a problem of technology and system identification more than a clinical difficulty. Thus, it
is an ideal point for collaboration across disciplines. This paper thus seeks to define this problem from a joint engineering and clinical perspective.
2. METHODS
2.1 Description of the heart
The heart is a muscular organ responsible for the circulation of blood in blood vessels. It has four chambers, two atria and two ventricles. Blood flows only in one direction through the heart. The ventricles are the main pumps and the atria are smaller chambers that prime and manage flow into these ventricles. The left heart (atrium and ventricle) pumps oxygenated blood returning from the lungs out to the entire body and extremities, excluding the lungs. The right ventricle pumps venous blood returning from the extremities to the lungs where it is re-oxygenated. The entire circuit thus provides blood flow and oxygen to the body tissues. Flow and pumping are managed primarily by the four valves at the entrance and exit of each ventricle over a cardiac cycle. The cardiac cycle can be divided into two major events. The first is systole when the heat contracts. The second is diastole when the heart relaxes. More precisely, one can define four main phases as pictured in Figure 1 in a pressure-volume (P-V) diagram that applies equally to both sides (left and right) of the heart. These four phases are, respectively, the ventricular filling, the isovolumetric contraction, the ejection, and the isovolumetric relaxation. Together they create a complete pumping action that sends blood out into the arterial system to the extremities or lungs at high pressure, while taking in low pressure returning venous blood. Systole ends at the top left point of the P-V loop, while the diastole ends at the lower right corner. The vertical portions are thus the isovolumetric contraction and relaxation portions. Note that this simple diagram captures the fundamental mechanics of
the heart and is readily measured, and thus has significant clinical use.
Fig. 1: The four phases of the cardiac cycle
The tension in the ventricle at the end of diastole is known as the preload. This is a measure of the ventricular filling pressure that can be characterized by the end-diastolic volume, or the pressure in the lower right corner of Figure 1. Another useful concept is the afterload, which can be thought of as the load that the ventricle must face to eject blood into the arterial system of blood vessels. Thus, afterload is directly linked to the end-systolic pressure in the upper left corner of Figure 1
Clinically, these are critical points in the PV loop. They define the pressure available to fill the heart with blood, and the pressure or resistance against which the heart must pump. A weak heart therefore has more difficulty pumping blood against a higher afterload. Similarly, it thus also cannot generate as much cardiac output, or returning blood, to fill the ventricles, creating a lower preload. Thus, these simple pressures and analyses can diagnose a range of emerging dysfunction in a patient’s cardiovascular status.
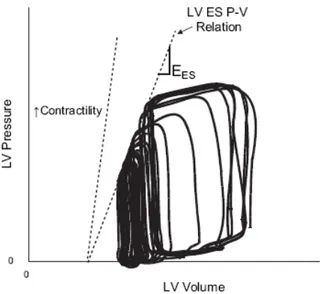
2.2 Ventricular properties (Ees)
Ventricular end-systolic elastance (Ees) is the reference contractility parameter that characterizes ventricular systolic function. It is quantified by the slope of the ventricular end-systolic P-V (ES P-V) relation. Figure 2 shows a typical P-V loop sequence and this relationship. A heart with high contractility is one able to generate a steep slope by generating both a high pressure to eject blood and thus ejecting a lot of volume to obtain that slope. Clinically, it is a measure of the heart’s energetic ability to pump blood. This ES P-V relation line can be obtained from measured P-V loops during a preload reduction manoeuvre. This manoeuvre is usually performed via a caval occlusion, which is a highly invasive procedure that blocks blood flow back to the ventricle. Figure 2 illustrates this procedure as well as the ES P-V relation obtained by joining the end-systolic pressures corresponding to the successive preload levels. Figure 2 also shows the change in the ESPVR relation when contractility is increased, which would result in a shifting left (and upward) of these PV loops in the Figure.
Fig 2: Left ventricular pressure-volume (P-V) loops and definition of the end-systolic P-V relation (ES P-V relation or ESPVR line) the slope of which defines Ees.
From Figure 2, it is easily seen that Ees is defined:
Ees = � P(t)
V(t) − V0�max (1)
where P(t) and V(t) are respectively the ventricular pressure and volume at the end of systole, and V0 is called the dead space volume where the ES P-V relation line meets the volume axis, and is the volume of the heart at zero pressure.
2.3 Arterial properties
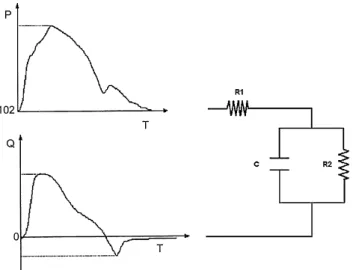
Since vascular impedance accurately describes the properties of the vasculature distal to the point of measurement, calculation of ascending aortic input impedance is accepted as being the most complete description of the hydraulic afterload faced by the left ventricle (Nichols et al., 1977). This impedance is a complex number that can be estimated in the frequency domain (Maughan et al., 1984) using a three-element windkessel model. This model is an electrical systems analogy or model of the vascular bed, and incorporates resistance of the main vessels, peripheral resistances, and the compliance of the vascular bed. Figure 3 gives a schematic of the three-element windkessel model, as well as the experimental data (aortic pressure and flow) needed to identify the parameters of the model for the left ventricle (Lambermont et al., 1998).
The windkessel model thus separate calculation of every component of the input impedance (compliance, main and peripheral resistances) in the model (R1, R2, C). In the time domain, these elements can be combined in an arterial elastance Ea (Sagawa et al., 1988):
Ea = 𝑅1 + 𝑅2
where ts and td denote respectively the systolic and diastolic time, while τ is the time constant defined by the product of the compliance and the sum of both resistances.
Fig. 3: Three-element windkessel model. P = LV pressure, Q = Aortic flow, R1 = resistance of the main vessels, R2 = peripheral resistance, C = compliance.
Ea is shown in Figure 4 as the compliance or slope of the line between the end diastolic corner of the PV loop and the end systolic point. This elastance thus defines the ability of the ventricle to overcome afterload and pump blood. A low Ea thus implies a large stroke volume and/or a lower change in pressure during a cardiac cycle, and thus indicates an efficient ventricle. A high Ea implies a high afterload or resistance to pumping blood via smaller stroke volumes and/or higher changes in pressure. Again, this value also has significant clinical diagnostic use.
It has been shown by Sagawa (Sagawa et al., 1988) that Ea can also be simply assessed clinically by the ratio:
Ea= Pes/SV (3)
where Pes is the end-systolic pressure (upper right corner of Figures 1-2) and SV is the stroke volume, which is the volume change at constant pressure during systole. Equation 3 lacks resolution, but is easy to use. More importantly, clinically, it doesn’t require an invasive and ethically difficult occlusion manoeuvre.
2.4 Ventriculo-arterial coupling.
The complete performance of the ventricular pump can therefore be described by both lines defined by Equations 1 and 2 (or Equation 3). The intersection of these lines defines the operating point of the ventricle, as seen in Figure 4. The ratio of Ees to Ea, obtained from P-V relations, characterizes the ventriculo-arterial interaction and is known as the ventriculo-arterial coupling index.
Fig. 4: Illustration of the operating point of the ventricular pump.
More generally, it defines the efficiency of energy transfer between the left ventricle and the arterial system, in that it defines the ability to pump blood or the energetics of the heart (Ees) and the resistance or impedance it faces in this pumping action (Ea). Thus, this ratio has clinical significance as clinicians have different therapeutics to manage heart energetics (inotropes) and arterial/vascular impedance (such as vasodilators).
Finally, it can be mathematically shown that the maximum stroke work is reached for Ees/Ea ~1 (Kass and Kelly, 1992). However, similarly, optimal efficiency corresponds to Ees/Ea=2 (Sagawa et al., 1988). Clinically, these values are managed by clinicians on a regular basis. Thus, having a non-invasive, high resolution means of capturing this ratio would provide significant advantage to clinicians.
3. DISCUSSION AND CLINICAL PERSPECTIVE The interaction of ventricular and arterial properties, or coupling, is a major determinant of cardiac performance. However, this concept is largely under-appreciated mainly because it requires very invasive measurements to acquire P-V loops and determine Ees and Ea with good resolution. In addition, the simple ratios currently used can lack resolution to make significant clinical impact.
For animal models, the gold standard to determine the ventricular volume is the conductance catheter (Baan et al., 1984). This technique is not suitable for clinical use due to its invasiveness. Recent developments in non invasive imaging (echocardiography) allow its application in daily practice and offer new tools to estimate the ventricular volume. However, these imaging techniques, while effective, do not provide continuous measurement, but instead can be used to gain a snapshot of the patient’s status when applied. In this way, pressure-volume loops can derived from left ventricular pressure obtained from femoral fluid-filled catheter and left ventricular volume obtained with echocardiography, at least for those time points where the imaging, and the processing
to obtain the volume, are available. Finally, it should be noted that echocardiography imaging to assess volume can lack resolution depending on operator and software capability. The preload reduction from a caval occlusion necessary to assess Ees is very difficult to achieve clinically. Given the risk involved with occluding blood flow in a critically ill patient there are obvious ethical issues. An alternative is to use leg raising manoeuvres or ventilation pressure variation to change preload. However, these methods lack resolution and are difficult to get consistent, repeatable results.
Therefore, cardiologists have worked extensively to develop and research new methods to bypass the preload reduction. Takeuchi (Takeuchi et al., 1991) proposed the "single-beat method" but this method failed to detect the (known) contractility modifications induced by pharmacologic interventions (Lambermont et al., 2004). Others have tried to increase the resolution of current less invasive methods, but with lesser success to date.
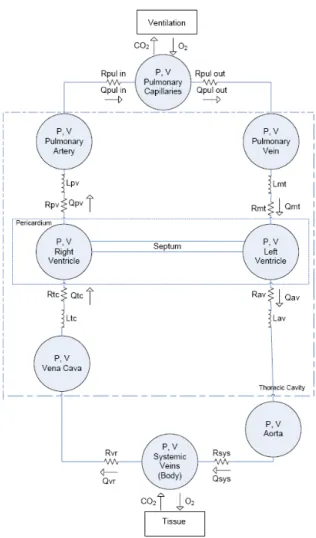
However, recently growing collaborations between cardiologists and engineers (Desaive et al., 2008b) open new perspectives by offering less invasive and reliable tools to assess ventricular contractility. In particular, there is the potential to use models that are computationally light, such as the one in Figure 5 with clinical measurements. The low parameter numbers of this model, for example, combined with the wealth of clinical measurements typically taken via a range of catheters and sensors, offers the opportunity to identify a patient-specific model, continuously, and in real-time.
Since this model, and similar ones, have direct analogies to Ees and Ea, they offer the opportunity to monitor these rations in real-time for clinical management. While only animal studies have been done to date (Desaive et al., 2008a, Starfinger et al., 2008a, Starfinger et al., 2007), they have shown the potential to delineate and diagnose a range of conditions from pulmonary embolism to septic shock. The main question will be whether these models can, with the available data, provide the resolution and accuracy necessary to provide significant and useful clinical input. More generically, such models offer the opportunity for engineers and clinicians to collaborate to create new systems and devices that can have significant potential impact on patients, outcomes, and the practice of medicine.
4. CONCLUSIONS
Ventriculo-arterial coupling is the corner-stone of ventricular efficiency assessment and clinical management. Recent evolution in non invasive imaging technique on the one hand and the development of fast reliable computer models on the other, offer new tools to evaluate ventriculo-arterial coupling in real-time in critically ill patients. A high resolution metric that matches invasive gold standard methods would enable significant advances in the capability of clinicians to guide hemodynamic therapy, improve cardiovascular system performance, and, thus, to improve patient outcomes.
Fig. 5: A computationally light, or “minimal” model that offers the potential for real-time diagnosis of cardiovascular and circulatory system dysfunction at the bedside of the critically ill patient. The model captures all the fundamental circulatory and cardiovascular dynamics with details in (Starfinger et al., 2008c, Starfinger et al., 2008b).
REFERENCES
Baan, J., van der Velde, E. T., de Bruin, H., Smeenk, G. J., Koops, J., van Dijk, A. D., Temmerman, D., Senden, J. & Buis, B. 1984. Continuous measurement of left ventricular volume in animals and humans by conductance catheter. Circulation, 70, 812-823. Desaive, T., Lambermont, B., Ghuysen, A., Kolh, P., Dauby,
P. C., Starfinger, C., Hann, C. E., Chase, J. G. & Shaw, G. M. 2008a. Cardiovascular Modelling and Identification in Septic Shock - Experimental validation. Proceedings of the 17th IFAC World
Congress July 6-11, 2008, Seoul, Korea.
Desaive, T., Lambermont, B., Janssen, N., Ghuysen, A., Kolh, P., Dauby, P. C., Starfinger, C., Hann, C. E., Shaw, G. M. & Chase, J. G. 2008b. Model-Based Assessment of Right Ventricular Arterial Coupling During Septic Shock – Results With a Porcine Model. Intensive Care Medicine, Vol 34(Suppl 1), S24.
Kass, D. A. & Kelly, R. P. 1992. Ventriculo-arterial coupling: concepts, assumptions, and applications.
Ann Biomed Eng, 20, 41-62.
Lambermont, B. & D'Orio, V. 2006. The role of right ventricular-pulmonary arterial coupling to differentiate between effects of inotropic agents in experimental right heart failure. Crit Care Med, 34, 2864-5.
Lambermont, B., D'Orio, V., Gerard, P., Kolh, P., Detry, O. & Marcelle, R. 1998. Time domain method to identify simultaneously parameters of the windkessel model applied to the pulmonary circulation. Arch Physiol Biochem, 106, 245-52. Lambermont, B., Segers, P., Ghuysen, A., Tchana-Sato, V.,
Morimont, P., Dogne, J. M., Kolh, P., Gerard, P. & D'Orio, V. 2004. Comparison between single-beat and multiple-beat methods for estimation of right ventricular contractility. Crit Care Med, 32, 1886-90.
Maughan, W. L., Sunagawa, K., Burkhoff, D. & Sagawa, K. 1984. Effect of arterial impedance changes on the end-systolic pressure-volume relation. Circ Res, 54, 595-602.
Nichols, W. W., Conti, C. R., Walker, W. E. & Milnor, W. R. 1977. Input impedance of the systemic circulation in man. Circ Res, 40, 451-8.
Sagawa, K., Maughan, W. L., Suga, H. & Sunagawa, K. 1988. Cardiac contraction and the pressure-volume
relationship, New-York, Oxford University Press.
Starfinger, C., Chase, J. G., Hann, C. E., Shaw, G. M., Lambermont, B., Ghuysen, A., Kolh, P., Dauby, P. C. & Desaive, T. 2008a. Model-based identification and diagnosis of a porcine model of induced endotoxic shock with hemofiltration. Math Biosci, 216, 132--139.
Starfinger, C., Chase, J. G., Hann, C. E., Shaw, G. M., Lambert, P., Smith, B. W., Sloth, E., Larsson, A., Andreassen, S. & Rees, S. 2008b. Model-based identification of PEEP titrations during different volemic levels. Comput Methods Programs Biomed, 91, 135--144.
Starfinger, C., Chase, J. G., Hann, C. E., Shaw, G. M., Lambert, P., Smith, B. W., Sloth, E., Larsson, A., Andreassen, S. & Rees, S. 2008c. Prediction of hemodynamic changes towards PEEP titrations at different volemic levels using a minimal cardiovascular model. Comput Methods Programs
Biomed, 91, 128--134.
Starfinger, C., Hann, C. E., Chase, J. G., Desaive, T., Ghuysen, A. & Shaw, G. M. 2007. Model-based cardiac diagnosis of pulmonary embolism. Comput
Methods Programs Biomed, 87, 46--60.
Sunagawa, K., Sagawa, K. & Maughan, W. L. 1984. Ventricular interaction with the loading system. Ann
Biomed Eng, 12, 163-89.
Takeuchi, M., Igarashi, Y., Tomimoto, S., Odake, M., Hayashi, T., Tsukamoto, T., Hata, K., Takaoka, H. & Fukuzaki, H. 1991. Single-beat estimation of the slope of the end-systolic pressure-volume relation in the human left ventricle. Circulation, 83, 202-12.