STRUCTURE DE POPULATION ET DIVERSITE GENETIQUE DE L'HIRONDELLE
BICOLORE (Tachycineta bicolor) LE LONG D'UN GRADIENT DE QUALITE
D'HABITAT
par
Melody Porlier
memoire presents au Departement de biologie en vue
de l'obtention du grade de maitre es science (M.Sc.)
FACULTE DES SCIENCES
UNIVERSITE DE SHERBROOKE
1*1
Library and
Archives Canada
Published Heritage
Branch
395 Wellington Street Ottawa ON K1A0N4 CanadaBibliotheque et
Archives Canada
Direction du
Patrimoine de I'edition
395, rue Wellington Ottawa ON K1A0N4 CanadaYour file Votre reference ISBN: 978-0-494-49568-1 Our file Notre reference ISBN: 978-0-494-49568-1
NOTICE:
The author has granted a
non-exclusive license allowing Library
and Archives Canada to reproduce,
publish, archive, preserve, conserve,
communicate to the public by
telecommunication or on the Internet,
loan, distribute and sell theses
worldwide, for commercial or
non-commercial purposes, in microform,
paper, electronic and/or any other
formats.
AVIS:
L'auteur a accorde une licence non exclusive
permettant a la Bibliotheque et Archives
Canada de reproduire, publier, archiver,
sauvegarder, conserver, transmettre au public
par telecommunication ou par Plntemet, prefer,
distribuer et vendre des theses partout dans
le monde, a des fins commerciales ou autres,
sur support microforme, papier, electronique
et/ou autres formats.
The author retains copyright
ownership and moral rights in
this thesis. Neither the thesis
nor substantial extracts from it
may be printed or otherwise
reproduced without the author's
permission.
L'auteur conserve la propriete du droit d'auteur
et des droits moraux qui protege cette these.
Ni la these ni des extraits substantiels de
celle-ci ne doivent etre imprimes ou autrement
reproduits sans son autorisation.
In compliance with the Canadian
Privacy Act some supporting
forms may have been removed
from this thesis.
Conformement a la loi canadienne
sur la protection de la vie privee,
quelques formulaires secondaires
ont ete enleves de cette these.
While these forms may be included
in the document page count,
their removal does not represent
any loss of content from the
thesis.
Canada
Bien que ces formulaires
aient inclus dans la pagination,
il n'y aura aucun contenu manquant.
Le 8 Janvier 2009
lejury a accepte le memoire de Mme Melody Porlier dans sa version finale.
Membres dujury
M. Dany Garant
Directeur
Departement de biologie
M. Marc Belisle
Membre
Departement de biologie
M. Robert Bradley
President-rapporteur
Departement de biologie
SOMMAIRE
La diversite genetique est un element essentiel au maintien et a l'adaptation des
populations en milieu naturel. Or, l'expansion actuelle de la population humaine et de ses
activites entraine de nombreux changements globaux susceptibles d'affecter les
populations naturelles. Les perturbations de l'habitat peuvent notamment etre responsables
d'une reduction de la diversite genetique au sein des populations et des individus,
diminuant le potentiel adaptatif et augmentant les risques d'extinction des populations.
Dans ce contexte, il est crucial de comprendre l'influence des variables ecologiques sur la
variability genetique des populations en milieu naturel.
L'objectif de ma maitrise est de determiner, a l'aide d'une approche de genetique du
paysage, la structure de population et l'effet de la qualite de l'habitat sur la diversite
genetique de l'Hirondelle bicolore {Tachycineta bicolor), le long d'un gradient
d'intensification agricole au sud du Quebec. J'ai determine la presence d'une seule
population au sein de l'aire d'etude ainsi qu'une legere association positive entre
l'apparentement des individus et la distance geographique, suggerant un mechanisme
d'evitement de la consanguinite. Ensuite, j'ai montre que, dans notre systeme d'etude, la
diversite genetique individuelle de l'Hirondelle bicolore est negativement reliee a la qualite
de l'habitat. Ce resultat contre-intuitif s'explique probablement par la configuration du
paysage dans cette region: suite a la migration, l'Hirondelle bicolore entre dans notre
systeme d'etude via le fleuve Saint-Laurent, pres duquel se trouvent les habitats de qualite
inferieure; les premiers habitats disponibles rencontres sont done de moins bonne qualite.
Or, les individus genetiquement plus diversifies arrivent plus tot dans le systeme d'etude et
s'etablissent dans les premiers habitats disponibles, generant cette relation negative entre
qualite genetique individuelle et qualite de l'habitat.
Cette etude souligne l'importance des parametres lies a la qualite de l'habitat et au
comportement sur la diversite genetique en milieu naturel, en plus de constituer l'une des
premieres quantifications de l'effet de facteurs ecologiques sur les niveaux et la
distribution de la diversite genetique mesuree au niveau individuel.
REMERCIEMENTS
J'aimerais tout d'abord remercier mon directeur de recherche, Dany Garant, pour son aide
et son soutien tout au long de ma maitrise. Je tiens egalement a remercier Marc Belisle
pour le soutien logistique ainsi que pour la collaboration aux analyses statistiques et a la
revision de l'article constituant le chapitre principal de ce memoire. Merci egalement a
Robert Bradley pour ses judicieux conseils.
Un projet d'une telle envergure ne pourrait etre mene sans l'aide de nombreux stagiaires et
assistants de terrain et de laboratoire : merci a Charles Beaudette, Marie-Claude Bernard,
Olivier Cameron-Trudel, Celine Hequet, Jonathan Menard, Leonie Mercier, Francis
Paquette et Caroline Robitaille pour leur contribution a la bonne marche de ce projet. Je
tiens aussi a remercier les autres etudiants gradues ayant travaille sur le projet Hirondelle
durant mes deux annees de maitrise, Renaud Baeta, Arnaud Ghilain et Stephane
Lamoureux, pour leur aide sur le terrain et egalement pour leur apport scientifique a ce
projet. Merci egalement a Melissa Lieutenant-Gosselin pour son aide en laboratoire, ainsi
qu'a Caroline Girard pour son aide avec l'utilisation des systemes d'information
geographique. Merci egalement a l'ensemble des gens du laboratoire en ecologie, tant pour
les activites scientifiques que sociales ayant permis de rendre ces deux annees de maitrise
d'autant plus agreables.
Finalement, cette maitrise n'aurait pu etre effectuee sans la generosite des 40 proprietaries
de fermes constituant notre systeme d'etude de l'Hirondelle bicolore. La Faculte des
sciences de l'Universite de Sherbrooke m'a supporte financierement au cours de ma
maitrise.
TABLE DES MATIERES
SOMMAIRE ii REMERCIEMENTS iii
TABLE DES MATIERES iv LISTE DES TABLEAUX v LISTE DES FIGURES vii
INTRODUCTION 1 Structure de population et variability genetique 2
Intensification de l'agriculture et consequences sur les oiseaux champetres 6
Objectifs de recherche 7
CHAPITRE 1 - Nonrandom distribution of individual genetic diversity along an
environmental gradient 9 Introduction 11 Materials and methods 14
Results 22 Discussion 27 Acknowledgements 32 CONCLUSION 33 ANNEXE 1 36 ANNEXE 2 37 ANNEXE 3 38 BIBLIOGRAPHIE 39
LISTE DES TABLEAUX
Chapitre 1
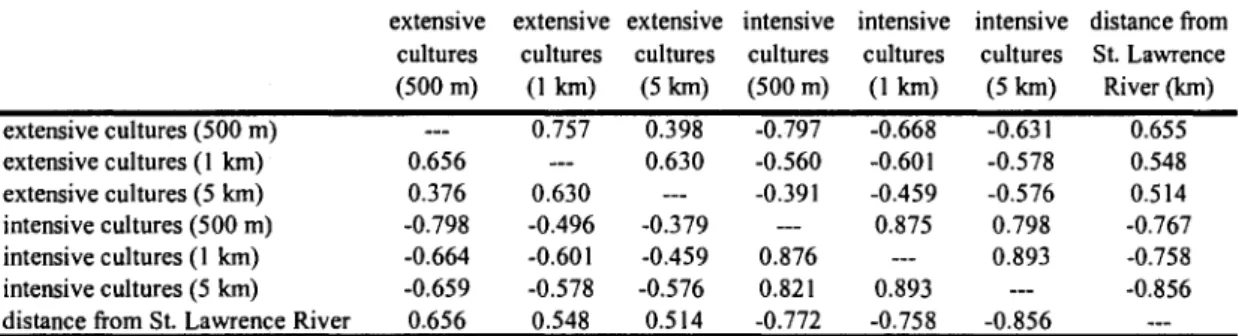
1. Pearson's correlation coefficients between ecological and landscape
variables 20
2. Effects of culture types on adult tree swallows' individual genetic diversity as measured by internal relatedness. (a) Full extensive culture (500 m) general linear model, with significance of each term included in the model, (b) Final extensive culture (500 m) model, with significant term only.
Number of observations = 952 24
3. Generalized linear model (Poisson error structure and log-link function) of effects of internal relatedness, distance from the St. Lawrence River, year and body mass on tree swallows' settlement dates. Number of observations =
726 25
Annexe 1
1. Supplementary table 1. Number of alleles, range size (bp), expected heterozygosity (HE), and observed heterozygosity (HO) (for 2006 and 2007 separately and for both study years analysed together), for each of the 7 microsatellite loci used in the final analyses. Values were calculated using genotypes from 815 adult individuals captured in 2006 and
Annexe 2
1. Supplementary table 2. Five best general linear models assessing the
influence of landscape and ecological parameters on the internal relatedness
of tree swallows as determined by Akaike's Information Criterion and their
weight of evidence (wi). The statistical significance of the parameters
included in the models are shown. Number of observations = 952 37
Annexe 3
1. Supplementary table 3. Four best generalized linear models (Poisson error
structure and log-link function) assessing the influence of landscape and
ecological parameters on the settlement date of tree swallows as determined
by Akaike's Information Criterion and their weight of evidence (wi). The
statistical significance of the parameters included in the models are shown.
LISTE DES FIGURES
Chapitre 1
1. Distribution of the 40 farms used to study tree swallows {Tachycineta
bicolor) along a gradient of agricultural intensification in Southern Quebec,
Canada. Land cover types are based on a mosaic of classified
LANDSAT-TM satellite images (Canadian Wildlife Service 2004) and include forest
cover (medium gray), extensive cultures (e.g., hayfields and pastures; light
gray), and intensive cultures (e.g., maize, cereals, and soybeans; white). The
St. Lawrence River is shown in dark gray at the western limit of our study
area. Circles indicate farm locations 15
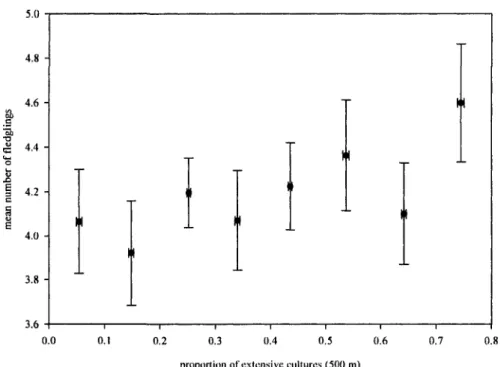
2. Effect of the proportion of extensive cultures within 500 m of each nest-box
on the number of fledglings. For illustration purposes, each circle represents
mean values (± SE) for 8 classes of proportion of extensive cultures. The
effect of the proportion of extensive cultures at 500 m on number of
fledglings was significant (b = 1.288 ± 0.587, p = 0.035) when analysed
using a linear mixed model with farm identity included as a random term (N
= 515) 23
3. Relationship between extensive cultures within 500 m of around each
nest-box and internal relatedness. Each circle represents mean values (± SE) for
each farm in the study system (N = 952) 24
4. Effect of internal relatedness (a) and body mass (b) on the settlement date of
tree swallows. Settlement dates correspond to adjusted values from a
generalised linear model (Poisson error structure and log-link function) of
including internal relatedness, body mass, distance from the St. Lawrence
INTRODUCTION
La diversite genetique est un element essentiel pour le maintien et l'adaptation des
populations en milieu naturel (Fisher, 1930 ; Saccheri et al, 1998 ; Spielman et al, 2004).
En effet, une reduction de la diversite genetique au sein des populations limite leur
capacite a s'adapter a de nouvelles conditions de leur environnement (Burger et Lynch,
1995 ; Etterson, 2004). De plus, au niveau individuel, la diversite genetique est
positivement associee a plusieurs trais lies au fitness, tels la resistance aux maladies
(Acevedo-Whitehouse et al, 2003), la survie (Coltman et al, 1998 ; Kretzmann et al,
2006), la probability de recrutement (Jensen et al, 2007) et le succes reproducteur (Tomiuk
et al, 2007 ; Zedrosser et al, 2007). Les niveaux de variability genetique observes en
milieu naturel sont cependant susceptibles d'etre affectes par des modifications de
l'environnement, tels la perte des habitats naturels, la diminution de leur qualite ou leur
fragmentation. En effet, ces modifications de l'environnement, en entrainant une
diminution potentielle de la taille effective des populations ainsi qu'une reduction de la
connectivite entre populations, peuvent affecter les forces evolutives (migration, selection,
derive genique) influencant du meme coup la structure et la diversite genetique des
populations (Slatkin, 1985 ; Whitlock et Barton, 1997). Par exemple, plusieurs etudes
montrent que la fragmentation de 1'habitat augmente le niveau de differentiation genetique
entre populations, du a une reduction du flux genique (Keyghobadi, 2007 ; Whitlock,
1992). De plus, les populations fragmentees ou en declin peuvent subir une diminution de
leur diversite genetique au niveau populationnel (Frankham, 1996 ; Keyghobadi, 2007).
L'isolement et la reduction de la taille effective de population peuvent aussi etre lies a une
hausse des niveaux de consanguinite et une diminution de la diversite genetique
individuelle (Andersen et al, 2004 ; Ortego et al, 2008a).
Les changements environnementaux sont done susceptibles d'affecter autant la structure
des populations que les niveaux de diversite genetique au sein des populations et des
individus. L'explication des mecanismes sous-jacents a la diversite genetique observee est
alors essentielle autant pour la comprehension de revolution que pour l'etablissement du
potentiel de conservation des especes. Or, l'une des consequences majeures de l'expansion
de la population humaine et de ses activites est la grande vitesse des changements environnementaux actuels, notamment la destruction rapide des habitats naturels (Hannah et al, 1995 ; IPCC, 2007). Nous observons presentement une reduction de la biodiversite a l'echelle mondiale (Dirzo et Raven, 2003), la perturbation des habitats naturels etant de loin la principale cause actuelle de l'extinction d'especes et de populations (Bailie et al, 2004 ; Wilcove et al, 1998). Cependant, malgre l'importance des changements environnementaux actuels et en depit de l'interet majeur de ce genre de precision pour la biologie evolutive, peu d'etudes ont tente de quantifier l'influence de variables ecologiques liees a la qualite de 1'habitat sur la variabilite genetique observee en milieu naturel, particulierement au niveau de la diversite genetique individuelle.
Structure de population et variabilite genetique
Marqueurs moleculaires
La capacite a detecter la variation genetique depend tout d'abord du pouvoir de resolution des marqueurs moleculaires utilises (Parker et al, 1998 ; Sunnucks, 2000). L'avenement de nouvelles techniques d'analyses moleculaires vers la fin des annees 1980, comme 1'amplification par reaction de polymerase en chaine, a permis 1'utilisation de plusieurs marqueurs moleculaires hautement polymorphiques, tels les microsatellites (Jarne et Lagoda, 1996). Ces derniers consistent en des regions neutres de l'ADN nucleaire contenant des sequences de 2 a 6 paires de bases repetees en tandem, dont le nombre de repetitions est tres variable, du a des mutations frequentes lors de la replication de l'ADN (Queller et al, 1993). Ce fort taux de polymorphisme confere a ces marqueurs un plus grand pouvoir de detection de la variabilite genetique entre individus et populations comparativement a d'autres types de marqueurs traditionnellement utilises en genetique des populations, tel les allozymes et l'ADN mitochondrial (Parker et al, 1998 ; Ryman et al, 2006). Les microsatellites sont maintenant couramment utilises en genetique des populations, permettant entre autres la detection d'evenements recents de migration (Bergl et Vigilant, 2007 ; Kuehn et al, 2007), de structure genetique a fine echelle geographique (Nussey et al, 2005 ; Shorey et al, 2000), de declin de taille de population (Garza et Williamson, 2001 ; Lee et al, 2001) et d'effets de perturbations recentes de l'habitat sur la
variability genetique (Gerlach et Musolf, 2000 ; Martinez-Cruz et al, 2007 ; Williams et
al, 2003).
Genetique du paysage
L'integration de donnees genetiques provenant de tels marqueurs polymorphiques a de
nouvelles methodes d'analyses statistiques et d'outils informatiques puissants a permis
l'emergence d'un nouveau domaine de recherche, la genetique du paysage (Manel et al,
2003). Cette approche, qui combine genetique des populations, ecologie du paysage et
analyses spatiales, permet notamment de definir une structure de population sans avoir a
determiner a priori le nombre et l'emplacement des populations, ainsi que de mettre en
relation des patrons de variability genetique observes avec des caracteristiques liees au
paysage ou a l'environnement (Manel et al, 2003 ; Storfer et al, 2007).
L'approche traditionnelle en genetique des populations est basee sur l'echantillonnage de
populations discretes prealablement identifiees. Bien que, dans certains cas, il soit
relativement facile de determiner les frontieres des populations, par exemple dans le cas
d'organismes aquatiques dans differents lacs (Adams et Hutchings, 2003) ou differentes
rivieres (Tessier et al, 1997), il arrive plus souvent que les individus soient distribues de
facon plus continue dans l'espace, par exemple dans le cas d'organismes ayant une grande
capacite de dispersion, comme les oiseaux. Cette distribution continue rend done la
delimitation des populations plus difficile et arbitraire. Or, de nouvelles methodes
d'analyse, tels les tests d'inference bayesienne, permettent d'utiliser rinformation obtenue
a partir de genotypes individuels afin de detecter le nombre le plus probable de populations
au sein d'une aire de distribution donnee et d'assigner chaque individu a une population
(Dawson et Belkhir, 2001 ; Manel et al, 2005 ; Pritchard et al, 2000). Ce type d'analyse
est maintenant couramment utilise afin de definir la structure de population en milieu
naturel (Coulon et al, 2008 ; Croteau et al, 2007 ; Dionne et al, 2008), permettant la
detection de populations differenciees meme chez des especes possedant une forte capacite
de dispersion et en presence de flux genique entre populations (Martinez-Cruz et al, 2004 ;
Senar et al, 2006). De plus, l'integration de rinformation sur la localisation geographique
des individus aux analyses bayesiennes permet de detecter l'emplacement geographique de
discontinuites entre populations, et done d'identifier des barrieres au flux genique (Coulon et al, 2006 ; Fedy et al, 2008 ; Guillot et al, 2005 ; McCaims et Bematchez, 2008).
Dans d'autres cas, la structure de population suit un modele d'isolement par la distance, ou les individus geographiquement plus eloignes sont egalement plus differencies (Wright,
1943). Le test de Mantel (Mantel, 1967) permet de mettre en evidence la presence d'isolement par la distance en testant la correlation entre une matrice de distances genetiques (entre populations ou individus) et une matrice de distances geographiques (Crispo et Chapman, 2008 ; Francisco et al, 2007 ; Hull et al, 2008 ; Sumner et al, 2001). Une association entre la variabilite genetique et la distance geographique peut egalement etre mise en evidence par des analyses d'autocorrelation spatiale, qui permettent de tester si le genotype d'un individu a un endroit donne est dependant du genotype des individus situes dans son voisinnage (Smouse et Peakall, 1999 ; Sokal et Neal, 1978). Cette methode offire la possibilie de detecter une structure de population a une echelle tres fine, en plus de permettre de determiner 1'echelle spatiale a laquelle une structure genetique est observee (Double et al, 2005 ; Elmer et al, 2007 ; Temple et al, 2006).
D'autres approches permettent d'integrer de facon explicite l'effet de variables environnementales a 1'etude de la genetique des populations, permettant une meilleure comprehension des processus ecologiques sous-jacents a la variabilite genetique observee. Par exemple, les tests de Mantel partiels (Smouse et al, 1986) peuvent etre utilises afm de determiner si des parametres ecologiques permettent de mieux expliquer la structure genetique observee que la distance geographique seule. Plusieurs etudes ont ainsi montre l'effet de la composition du paysage sur la connectivite et la differenciation genetique entre populations, permettant de determiner quelles caracteristiques du paysage facilitent ou contraignent le flux genique entre populations (Keyghobadi et al, 1999 ; Spear et al, 2005 ; Stevens et al, 2006). Par exemple, Lindsay et al. (2008) ont ainsi trouve que la differenciation genetique entre populations de paruline a dos noir (Dendroica chrysoparia) est positivement corellee a la distance geographique et au pourcentage de terres agricoles entre populations, et negativement reliee au pourcentage de couvert forestier.
La genetique du paysage est done un domaine de recherche prometteur permettant de
mieux comprendre l'effet de modifications de l'habitat sur la variability genetique des
populations. Cependant, plusieurs avenues de recherche sont encore a explorer dans ce
domaine. Tout d'abord, un grand nombre d'etudes montrant les effets de modifications de
l'environnement sur la variability g6netique des populations sont effectuees en comparant
les niveaux de differenciation entre populations et en estimant la diversite genetique au
sein des populations situees en milieu perturbe et en milieu « controle » (Caizergues et al,
2003 ; Dhuyvetter et al, 2005 ; Johansson et al, 2005 ; Keyghobadi et al, 2005 ;
Lesbarreres et al, 2006 ; Segelbacher et al, 2003 ; Stow et al, 2001 ; Sumner, 2005 ;
Williams et al, 2003 ; Yamamoto et al, 2004). Or, de telles approches descriptives ne
permettent pas de quantifier l'effet des variables ecologiques liees a la perturbation des
habitats sur la variabilite genetique observee. Bien que certaines methodes d'analyse, tels
les tests de Mantel partiels, permettent d'expliquer les niveaux de differenciation genetique
entre populations par des variables liees au paysage, celles-ci ne peuvent pas etre
appliquees a l'etude de la diversite genetique au sein des populations et des individus, et ne
permettent pas de tester et de quantifier l'effet de plusieurs variables ecologiques et de
leurs interactions sur la variabilite genetique observee. L'utilisation de methodes
statistiques telles les regressions multiples et l'analyse canonique par correspondance serait
plus appropriee afin de tester de telles relations. En effet, plusieurs associations ont ainsi
ete trouvees entre les niveaux de differenciation genetique entre populations et la salinite
de l'eau (McCairns et Bernatchez, 2008), les interactions interspecifiques (Manier et
Arnold, 2006), la structure des communautes forestieres (Gram et Sork, 2001), et les
patrons de drainage, 1'altitude et les niveaux de peche sportive et d'ensemencements
(Angers et al, 1999). Cependant, peu d'etudes ont utilise ce type d'approche afin d'evaluer
l'impact de modifications environnementales recentes (voir cependant Raeymakers et al,
2008). Ce type d'analyse peut egalement etre applique a l'etude des niveaux et de la
distribution de la diversite genetique au niveau individuel (Manel et al, 2003). Or, a notre
connaissance, aucune etude effectuee a ce jour n'a quantifie les effets de variables
ecologiques liees a la perturbation des habitats naturels sur la diversite genetique
individuelle, malgre l'importance de cette derniere en biologie evolutive et en
conservation.
Intensification de l'agriculture et consequences sur les oiseaux champetres
L'une des principales causes de la perturbation des habitats naturels liee aux activites
humaines est l'expansion et 1'intensification des pratiques agricoles (Soule et al, 1990). En
Amerique du Nord, les pratiques agricoles ont subi d'importants changements depuis le
debut du 20
esiecle avec l'avenement de la mecanisation du travail agricole, l'utilisation de
pesticides et de fertilisants chimiques et le developpement de nouvelles varietes et de
plants hybrides (Belanger et Grenier, 2002 ; Jobin et al, 2003). Cette transition des
methodes traditionnelles vers l'agriculture intensive a entraine un changement profond du
paysage, notamment dans les regions du sud du Quebec. Dans la vallee du Saint-Laurent,
par exemple, 1'agriculture, l'urbanisme et les industries occupent une part preponderante
du paysage, laissant moins de 25% du couvert forestier intact (Belanger et Grenier, 2002).
Consequemment, les paysages agricoles sont maintenant caracterises par une mosaique
d'ilots d'habitats naturels separes les uns des autres par des terres agricoles, des routes, des
villes et des villages.
De nombreuses etudes documentent les effets de ces perturbations de l'habitat sur diverses
especes, notamment chez les oiseaux des zones temperees (Hole et al, 2002) et plus
particulierement en Amerique du Nord (Venter et al, 2006 ; Wilcove et al, 1998). Par
exemple, par rapport a 1'agriculture traditionnelle ou aux fermes organiques, les cultures
intensives abritent une moins grande biodiversite et abondance d'oiseaux (Beecher et al,
2002 ; Freemark et Kirk, 2001). De plus, Chamberlain et al. (2000) ainsi que Benton et al.
(2002) ont mis en evidence une association entre le declin de differentes populations
d'oiseaux en Angleterre et un gradient temporel d'intensification agricole. Plusieurs etudes
suggerent que ce declin serait du a une diminution dans 1'abondance des arthropodes,
source de nourriture pour bon nombre d'especes aviaires, en raison de l'utilisation de
pesticides et de l'homogeneisation des cultures associees a l'agriculture intensive (Benton
et al, 2002 ; Britschgi et al, 2006 ; Vickery et al, 2001 ; Wilson et al, 1999). Les
pesticides ont egalement un effet direct sur le succes reproducteur des oiseaux, notamment
chez l'Hirondelle bicolore (Tachycineta bicolor) (Bishop et al, 1999). De plus, la
diminution de l'heterogeneite de l'habitat, due a la moins grande diversite des cultures et a
la disparition de milieux humides et d'habitats marginaux tels que les boises, les haies et
les arbres morts, peut etre responsable de la diminution de l'abondance et de la richesse de
plusieurs especes d'oiseaux (Freemark et Kirk, 2001); les plans d'eau et les habitats
marginaux constituant un habitat important et une source majeure de nourriture pour les
oiseaux en milieu agricole (Gunnarsson et al, 2006). L'expansion de l'agriculture, en
causant une fragmentation ainsi qu'un declin des populations chez un grand nombre
d'especes d'oiseaux, serait done egalement susceptible d'entrainer plusieurs changements
au niveau de leur variabilite genetique. La plupart des etudes portant sur les effets de la
fragmentation de l'habitat sur la variabilite genetique des oiseaux sont toutefois effectuees
sur des especes residentes (Bates, 2002 ; Caizergues et al, 2003 ; Segelbacher et al,
2008). Les effets des modifications de l'habitat sur des especes de passereaux migrateurs
sont moins connus; certaines etudes montrant une absence d'effets de la fragmentation du
paysage sur la variabilite genetique (Croteau et al, 2007 ; Galbusera et al, 2004 ; Veit et
al, 2005), alors que d'autre demontrent que certains parametres lies au paysage, par
exemple la presence de terres agricoles, peut augmenter la differenciation genetique entre
populations (Lindsay et al, 2008).
Objectifs de recherche
L'objectif general des travaux presentes dans ce memoire est de determiner quelle est la
relation entre la qualite de l'environnement et la variabilite genetique de l'Hirondelle
bicolore (Tachycineta bicolor), le long d'un gradient d'intensification agricole.
Pour ce faire, j'utilise un systeme d'etude compose d'un reseau de 400 nichoirs, distribues
sur 40 fermes (10 nichoirs par ferme) situees au sud du Quebec, et couvrant un territoire
d'environ 10 200 km
2(voir Figure 1, Chapitre I). Cette region est caracterisee par un
gradient d'intensification agricole, allant de petites fermes laitieres, fourrages et paturages
(cultures extensives) a Test, a de grandes monocultures de mai's, de soya et autres cereales
(cultures intensives) a l'ouest. Cette transition de cultures extensives vers des cultures
intensives est associee a une reduction du couvert forestier et une fragmentation accrue de
l'habitat, ainsi qu'une homogeneisation du paysage due a la perte d'habitats marginaux,
tels des boises, haies, milieux humides et marecages, couplee a une augmentation de la
superficie des terres agricoles. Une des especes d'oiseaux particulierement susceptible
d'etre affectee par cette intensification des pratiques agricoles est l'Hirondelle bicolore. Comme dans le cas de plusieurs especes d'oiseaux insectivores, les populations d'Hirondelle bicolore au Quebec ont subi un important declin durant les 20 demieres annees, avec un taux moyen annuel de diminution de taille de population de 4,6% entre
1997 et 2007 (Downes et Collins, 2008). L'Hirondelle bicolore est un petit passereau migrateur se reproduisant dans l'ensemble de l'Amerique du Nord (Robertson et al, 1992). Durant la saison de reproduction, cette espece se retrouve principalement en milieux ouverts, et est dependante de la presence d'habitats marginaux, tels que plans d'eaux et milieux humides, qui consistent en une source importante de nourriture, ainsi que d'arbres morts comprenant des cavites leur permettant de nicher (Robertson et al, 1992). Ces caracteristiques font en sorte que les modifications de l'habitat dues a Fintensification agricole sont probablement l'une des pricipales causes expliquant le declin de cette espece au cours des dernieres decennies. De plus, il a effectivement ete montre que le succes reproducteur de l'Hirondelle bicolore sur notre systeme d'etude est plus faible (taille de portee et nombre d'oisillons a l'envol plus faibles) en milieux agricole intensif (Ghilain et Belisle, 2008). Finalement, l'Hirondelle bicolore se reproduit aisement en nichoir et se laisse manipuler facilement, sans consequences sur sa reproduction, ce qui facilite grandement le suivi de populations et la prise de donnees sur cette espece (Jones, 2003).
Plus specifiquement, les travaux presentes dans ce memoire visent a combiner information genetique obtenue a l'aide de marqueurs microsatellites et variables ecologiques et spatiales afin de : 1) etablir la structure genetique populationnelle de l'Hirondelle bicolore dans mon systeme d'etude, a l'aide d'une approche de genetique du paysage ; 2) quantifier l'effet de variables ecologiques et du paysage sur le niveau de differenciation entre les populations, s'il y a lieu, ainsi que sur la diversite genetique mesuree au niveau individuel. Etant donne que le succes reproducteur de l'Hirondelle bicolore dans notre systeme d'etude est plus faible en milieux agricoles intensifs, nous avons teste l'hypothese que la diversite genetique sera plus faible dans ce type d'habitat.
CHAPITRE 1
NONRANDOM DISTRIBUTION OF INDIVIDUAL GENETIC DIVERSITY ALONG AN ENVIRONMENTAL GRADIENT
par
MELODY PORLIER, MARC BELISLE & DANY GARANT Philosophical Transactions of the Royal Society B, accepte pour publication
Dans le contexte actuel de changements rapides et globaux, il est particulierement important de comprendre comment les modifications de l'habitat affectent le potentiel d'adaptation des populations. Un aspect critique de cette problematique consiste a mettre en evidence les mecanismes sous-jacents a la diversite genetique observee en milieu naturel. Peu d'etudes ce sont cependant attardees aux effets de la variabilite de l'environnement sur la quantite et la distribution de la diversite genetique mesuree au niveau individuel, malgre l'importance de cette derniere pour revolution et la conservation des especes. Cet article vise a comprendre et quantifier Finfluence du paysage et des facteurs ecologiques et comportementaux sur la diversite genetique individuelle de l'Hirondelle bicolore (Tachycineta bicolor), en milieu naturel. J'ai effectue la majorite de la collecte de donnees et d'analyses de laboratoire et statistiques menant aux resultats presentes dans l'article, en plus d'avoir redige la premiere version du manuscrit. Marc Belisle a contribue au travail par son soutien logistique, sa collaboration aux analyses statistiques et sa revision finale du manuscrit, et Dany Garant a supervise chacune des etapes de ce projet et contribue a la redaction de la version finale du manuscrit. Cet article a ete accepte pour publication dans la revue Philosophical Transactions of the Royal Society of London B, dans le cadre d'un numero special portant sur l'emergence d'un nouveau creneau de recherche nomme «Eco-evolutionary Dynamics», qui vise a quantifier l'importance des interactions entre processus ecologiques et evolutifs. L'originalite de cette recherche reside dans 1'integration de parametres spatiaux, ecologiques et comportementaux pour expliquer la variabilite genetique observee en milieu naturel. De plus, il s'agit d'un des premiers travaux quantifiant l'effet de variables ecologiques sur la diversite genetique mesuree au niveau individuel.
Abstract
Improving our knowledge of the links between ecology and evolution is especially critical in the actual context of global rapid environmental changes. A critical step in that direction is to quantify how variation in ecological factors linked to habitat modifications might shape observed levels of genetic variability in wild populations. Still, little is known on the factors affecting levels and distribution of genetic diversity at the individual level, despite its vital underlying role in evolutionary processes. In this study, we assessed the effects of habitat quality on population structure and individual genetic diversity of tree swallows (Tachycineta bicolor) breeding along a gradient of agricultural intensification in Southern Quebec, Canada. Using a landscape genetics approach, we found that individual genetic diversity was greater in poorer quality habitats. This counterintuitive result was partly explained by the settlement patterns of tree swallows across the landscape. Individuals of higher genetic diversity arrived earlier on their breeding grounds and settled in the first available habitats, which correspond to intensive cultures. Our results highlight the importance of investigating the effects of environmental variability on individual genetic diversity, and of integrating information on landscape structure when conducting such studies.
Keywords: agricultural intensification, environmental change, individual genetic diversity,
INTRODUCTION
Maintenance of genetic diversity is essential for a natural population's potential to evolve and adapt (Fisher 1930; Lenormand 2002). Accordingly, populations or species with low genetic diversity, and thus low adaptive potential, will generally have little chance of persisting in the face of rapid modifications of their environment (Burger & Lynch 1995; Etterson 2004). This is especially important in the actual context of rapid global environmental changes linked to the increasing human population and the expansion of its activities (Hannah et al. 1995; IPCC 2007). For example, the perturbation of natural habitats through fragmentation or habitat loss is currently one of the major causes of the decline of wild populations and the extinction of species worldwide (Wilcove et al. 1998; Bailie et al. 2004). Such habitat modifications will in most cases lead to a reduction in genetic diversity, increased levels of inbreeding, and a reduction in fitness, which ultimately increase extinction risks (Frankham 1995). In this context, it becomes particularly important to quantify how variation in ecological factors linked to habitat quality might affect and shape observed levels of genetic variability in wild populations.
The recent emergerice of the field of landscape genetics, which integrates population genetics, landscape ecology, and spatial analyses, provides an effective integrated approach to understand how landscape and ecological processes influence genetic variability in wild populations (Manel et al. 2003; Storfer et al. 2007). As a result, an increasing number of population genetic studies have quantified the effects of different landscape and ecological parameters on gene flow and resulting population differentiation at various scales and for different taxa (Keyghobadi et al. 2005; Spear et al. 2005; Vandergast et al. 2007; Dionne et al. 2008). Further studies have investigated how the interaction between habitat features and individual behaviour can shape population genetic structure and differentiation (Clark et al. 2008; Zheng et al. this issue). Much less emphasis has however been put on the assessment of the ecological factors that can potentially affect the amount and distribution of genetic diversity at the individual level. This is of great concern given that individual genetic diversity plays a vital underlying role in population
genetics and evolutionary processes, for instance through sexual and natural selection (Kretzmann et al. 2006; Kempenaers et al. 2007).
Yet, several studies have underlined the importance of individual genetic diversity at various levels. For instance, extra-pair mating often results in higher offspring individual heterozygosity in various species of birds (Foerster et al. 2003; Suter et al. 2007), mammals (Cohas et al. 2006; Bishop et al. 2007) and fishes (Garant et al. 2005; but see Dibattista et al. 2008). Also, studies have found evidence for female mate choice based on the level of individual heterozygosity of potential mates (reviewed in Kempenaers 2007). Positive associations have also been found between individual genetic diversity and sexually selected traits in male birds, such as crown colour (Foerster et al. 2003) and song complexity (Marshall et al. 2003). Importantly, several associations have been reported between increased individual genetic diversity and greater fitness-related traits, such as reproductive success (Tomiuk et al. 2007; Zedrosser et al. 2007), recruitment (Hansson et al. 2001) and survival (Kretzmann et al. 2006), across different taxa. However, none of these studies considered the potential interplay between individual genetic diversity and environmental variability, a critical step toward providing an accurate evaluation of a species' evolutionary potential in changing environments as well as an assessment of the links between ecological and evolutionary dynamics in the wild (see Pelletier et al. this issue).
The main objective of this study was to assess how ecological and landscape parameters affect the levels and distribution of individual genetic diversity in a wild bird population sampled throughout a gradient of agricultural intensification in Southern Quebec, Canada. The expansion and intensification of agricultural practices are major causes of current habitat loss and degradation (Soule et al. 1990; Venter et al. 2006). Agricultural practices throughout Europe and North America have drastically changed since the beginning of the 20th century, mainly due to an increased mechanisation of agricultural work, a greater use
of pesticides, herbicides and chemical fertilisers as well as the development and use of new and hybrid plant varieties (Tscharntke et al. 2005). In Southern Quebec and elsewhere, these modifications have transformed the agricultural landscapes, originally composed of hayfields and pastures, associated with a significant residual forest cover and the presence
of marginal habitats, such as hedgerows and wetlands, into large, intensively managed crops of cereal, soybean and maize (Belanger & Grenier 2002; Benton et al. 2003; Tscharntke et al. 2005). This transformation and homogenisation of agricultural landscapes have been linked to the decline in diversity and abundance of many bird species associated with farmland (Benton et al. 2003; Donald et al. 2006). The tree swallow (Tachycineta bicolor), a small migratory passerine, is one such species susceptible to be affected by the habitat modifications caused by agricultural intensification. Like many species of aerial insectivorous birds, tree swallow populations in Canada have declined during the past 20 years, one of the most important reductions in population sizes being observed in the province of Quebec, with an average annual decline of 4.6% between 1997 and 2007 (Downes & Collins 2008). The breeding activities of tree swallows occur mostly in open habitats, including agricultural fields, where they are dependent upon marginal habitats, such as drainage ditches and wetlands for foraging, and upon standing dead trees comprising nesting cavities since they are obligate second-cavity nesters (Robertson et al.
1992). Given these food and breeding site requirements, habitat modifications resulting from agricultural intensification are possible causes of the recent tree swallow's decline. Indeed, it has been recently shown that tree swallows have a smaller clutch size as well as a lower fledging success in landscapes mostly composed of intensively managed agricultural fields (Ghilain & Belisle 2008).
The specific objectives of our study were twofold. First, we assessed the population genetic structure of tree swallows in Southern Quebec using a landscape genetics approach based on microsatellite markers and GIS-based information. Second, we quantified the effects of landscape features and ecological parameters on the levels and distribution of individual genetic diversity in tree swallows along a gradient of agricultural intensification. Since the reproductive success of tree swallows is lower in intensively managed agricultural areas, we assessed if tree swallows' individual genetic diversity was negatively related to agricultural intensification.
MATERIALS AND METHODS
Study system and data collection
We monitored the breeding activities of tree swallows in a network of 400 nest-boxes
distributed among 40 farms (10 nest-boxes per farm) over an area of approximately 10 200
km
2in Southern Quebec, Canada (Fig. 1; see Ghilain & Belisle 2008 for a more detailed
description of the study system). This area is characterized by a longitudinal gradient of
agricultural intensification ranging from a forested landscape with interspersed small-scale
hayfields and pastures (henceforth referred to as extensive cultures) to the east, to a
dominance of large-scale, intensively managed monocultures of maize, cereal and soybean
crops (referred to as intensive cultures) to the west (Fig. 1). This transition from extensive
to intensive cultures is associated with forest cover reduction and fragmentation, landscape
homogenisation caused by the loss of marginal habitats such as hedgerows and wetlands,
and an increase in field size.
Each nest-box was visited every two days throughout the breeding season (from April to
mid-August) in 2006 and 2007. Geographical coordinates of each nest-box were obtained
using a handheld Trimble GeoExplorer GPS (Trimble, Sunnyvale, Californie, USA). Nest
building was monitored at each visit before females laid their first egg, and main breeding
parameters were then recorded for each breeding attempt: laying date (date of first egg
laid), clutch size (number of eggs), number of nestlings (number of hatched young) and
number of fledglings (number of nestlings aged 12 days). We also defined a settlement
date for each nest-box which corresponded to the earliest observation of nest-material for
the first breeding attempt in a given nest-box. Adult tree swallows were caught in their
nest-boxes either during nest building, while incubating, or when feeding nestlings aged
from 4 - 1 2 days. Each bird was weighed and banded at first capture with a U.S. Fish and
Wildlife Service aluminum band. Blood samples were taken from the brachial vein and
transferred on a qualitative P8 grade filter paper (Fisher Scientific), air-dried and
individually stored in hermetically sealed plastic bags at room temperature until DNA
extraction. Adult tree swallows that were found dead inside nest-boxes in 2007 (N = 12)
were collected and stored at -80°C until DNA extraction. Sex was determined based either on the presence of a brood patch (females) or cloacal protuberance (males) or using molecular tools (see below).
Figure 1. Distribution of the 40 farms used to study tree swallows (Tachycineta bicolor) along a gradient of agricultural intensification in Southern Quebec, Canada. Land cover types are based on a mosaic of classified LANDSAT-TM satellite images (Canadian Wildlife Service 2004) and include forest cover (medium gray), extensive cultures (e.g., hayfields and pastures; light gray), and intensive cultures (e.g., maize, cereals, and soybeans; white). The St. Lawrence River is shown in dark gray at the western limit of our study area. Circles indicate farm locations.
Landscape variables
Local-scale landscape composition was assessed for both study years by estimating the
relative cover of culture types within 500 m from each nest-box. We determined the type
of culture covering each parcel of land that surrounded nest-boxes using either the
Generalized Crop Database (Financiere Agricole du Quebec 2007) or by visual assessment
of culture type associated with each parcel of land. Landscape composition was then
reported on orthophotographs (scale: 1/40000; Ministere des Ressources naturelles et de la
Faune du Quebec 2000), and cover percentages were calculated using ArcView GIS
Spatial Analyst 2.0a (ESRI 2005).
Large-scale landscape composition for each nest-box was also calculated by estimating the
cover percentage of extensive and intensive cultures within 1 km and 5 km radii based on
Landsat-7 satellite images taken from August 1999 to May 2003 (Canadian Wildlife
Service 2004). We chose a maximum radius of 5 km because it corresponds to the
maximum distance travelled by tree swallows when collecting food for their young, and
since landscape-composition effects on their brood parameters has been shown to be
maximal at this spatial scale (Ghilain & Belisle 2008). We also included analyses using
cover percentages measured within 1 km radius around each nest-box as it represents an
intermediate distance between our local (500 m) and large (5 km) scale analyses. For each
nest-box, we also calculated the nearest distance to the St. Lawrence River, since this
measure is suggested to be linked with the arrival dates of tree swallows in our study
system (based on recordings of first spring observations of tree swallows in Southern
Quebec - eBirds 2006). All measurements were obtained with ArcView GIS Spatial
Analyst 2.0a (ESRI 2005). Correlations between and within culture types at different
spatial scales as well as between culture types and distance from the St. Lawrence River
were calculated using the R statistical environment v.2.7.1 (R Development Core Team
2008).
Genetic analyses
Microsatellite genotyping
DNA extractions were carried out from a 25 mm
2piece of filter paper impregnated with
blood. We used a proteinase K overnight digestion followed by NaCl extraction as detailed
in Aljanabi & Martinez (1997). Microsatellite polymorphism was then analysed at the
following ten loci: TBI 81, TBI 104, TBI 106 (Stenzler 2001), IBI Ms5-29 and IBI Ms3-31
(Crossman 1996), developed for tree swallows, and HrU5, HrU7 (Primmer et al. 1995) as
well as Hir 17, Hir 19 and Hir 22 (Tsyusko et al. 2007), developed for barn swallows
(Hintndo rustica). Briefly, PCR reactions were performed in a 10-/iL volume [8 mM
Tris-HC1 pH 9.0; 40 mM KC1; 0.08% Triton X-100; 3.0-3.5 mM MgCl
2; 0.004 mg BSA; 80
fiM dNTPs; 500 mM unlabelled primer; 250 mM labelled primer; 1U AmpliTaq Gold
(Applied Biosystems) and 10-20 ng DNA template] using a GeneAmp 9700 thermalcycler
(Applied Biosystems). The thermal profile consisted of an initial denaturation step of 6 min
at 94°C, followed by 36 cycles at 94°C for 30 sec, 54°C (HrU5) / 55°C (Hir 17, Hir 22) /
56°C (TBI 106, IBI Ms3-31) / 58°C (IBI Ms5-29, HrU7, TBI 81, TBI 104) / 60°C (Hir 19)
for 45 sec and 72°C for 45 sec, with a final elongation step of 10 min at 72°C. PCR
products were visualized on an AB-3130 automated DNA sequencer and alleles were
scored using GENEMAPPER (Applied Biosystems).
Molecular sexing
Individuals for which sex could not be determined on a phenotypic basis were sexed by
amplification of the CHD genes, using the P2 and P8 primers (Griffiths et al. 1998). The
final PCR reaction conditions were as follows: 8 mM Tris-HCl pH 9.0; 40 mM KC1, 3.0
mM MgC12; 0.008 mg BSA, 80 /tM dNTPs, 500 mM of each primer, 2U AmpliTaq Gold
(Applied Biosystems) and 20-40 ng DNA template. PCR reactions were also carried out on
a GeneAmp 9700 thermalcycler, with a thermal profile starting with an initial denaturing
step at 95°C for 6 min, followed by 35 cycles of 95°C for 1 min, 52°C for 45 sec and 72°C
for 45 sec, with a final run of 52°C for 1 min and 72°C for 10 min. Amplified bands from
CHD-W and CHD-Z were distinguished on 3% agarose gels.
Data analysis
The occurrence of genotyping errors was investigated using Microchecker v.2.2.3 (Van Oosterhout et al. 2004). The presence of null alleles was assessed using CERVUS v.3.0.3 (Marshall et al. 1998), and tests of linkage disequilibrium (LD), Hardy-Weinberg equilibrium (HWE) and heterozygote deficiency were performed using Genepop v. 4 (Raymond & Rousset 1995). Sequential Bonferroni correction for multiple tests was applied to null alleles, HWE and LD analyses (Rice 1989).
Population genetic structure
We first assessed the extent of genetic differentiation among farms in our study system by computing pairwise FST estimates between farms for each year, as well as overall mean FST value for each year, using Arlequin v.3.0 (Excoffier et al. 2005). Significance of FST values were assessed using 10 000 permutations. We further analysed the extent of spatio-temporal variability of the genetic structure by conducting a hierarchical analysis of gene diversity using the analysis of molecular variance (AMOVA) implemented in Arlequin. In the AMOVA, we assessed the component of genetic diversity attributable to (i) variance between years (temporal component); (ii) variance among farms within years (spatial component), and (iii) variance among individuals within farms.
To assess potential patterns of isolation by distance (IBD), we performed a Mantel test (Mantel 1967), which measures the association between matrices of pairwise genetic and geographic distance, using SPAGeDi v. 1.2 (Hardy & Vekemans 2002). However, since all pairwise FST values among farms were non-significant (see Results section), we instead performed an analysis at the individual level. We thus used Lynch and Ritland's (1999) measure of relatedness (rxy) to infer a genetic distance between all pairs of individuals and
then related these measures to Euclidian pairwise geographic distances, which were calculated from the geographical coordinates of the nest-boxes in which tree swallows were captured. Five thousand matrix randomizations were performed to assess the statistical significance of tests in each year.
We farther used a Bayesian clustering approach, without any a priori assumption of
population structuring, in order to detect the occurrence of a potential population genetic
structure. We first estimated the most likely number of genetic clusters in our dataset using
STRUCTURE v.2.2 (Pritchard et al. 2000). We performed the analyses using the
admixture model with correlated allele frequency and the following parameters values: X =
1.0, a burn-in period of 50 000 iterations and 250 000 replicates of the Markov Chain. Five
independent runs were conducted for each value of K (number of populations), with K
ranging from 1 to 40 (the maximum value of K being set to the number of farms in our
study system), and the log Pr(X|AT) averaged for each K. Analyses were conducted
separately for each year. Since the maximum value of log-likelihood was reached at K=\
for both years, indicating a single genetic cluster, no further analyses were performed to
assess the extent of differentiation among groups.
Individual genetic diversity
Individual genetic diversity was assessed using internal relatedness (IR) (Amos et al.
2001). IR is a multilocus estimate derived from Queller & Goodnight's (1989) measure of
relatedness which estimates the resemblance between parental half-genotypes within an
individual and weights the importance of each allele according to its frequency in the
population (Amos et al. 2001). IR values were calculated using an Excel macro
(IRmacroN4) available at:
http://www.zoo.cam.ac.Uk/zoostaff/amos/#ComputerPrograms
.
We also estimated individual genetic diversity using the homozygosity by loci index (HL;
see Aparicio et al. 2006) but only present the results pertaining to IR, since IR and HL
were highly correlated (r = 0.98, p < 0.001).
Statistical analyses
Since landscape composition variables showed strong, positive correlations across scales
(Table 1), and as a result led to identical qualitative effects of culture types on genetic
diversity across spatial scales, we only present the results obtained with cultures measured
within 500 m of nest-boxes. We tested for the effects of extensive and intensive cultures at
500 m on internal relatedness using general linear regression models. We accounted for
possible differences between males and females, as well as between years, by including
sex and year as factors in our analyses. In order to determine which landscape or ecological
parameters were the most important determinants of the distribution of individual genetic
diversity, we built a series of models containing all possible combinations of explanatory
variables (distance from the St. Lawrence River, proportion of extensive and intensive
cultures at 500 m, year and sex) and compared them using Akaike's Information Criterion
(AIC) (defining the model with the lowest AIC value as the best model). We also
computed the weight of evidence of each model (w,), which corresponds to the likelihood
that a model is the best one in the model set given the data (Burnham & Anderson 2002).
However, given the strong negative correlation between extensive and intensive cultures
(see Table 1), we only tested for the effect of one of these variable at a time in our final
analyses. As the effects of extensive and intensive cultures always pointed to the same
conclusions (through opposite effects), we decided to report only results for extensive
cultures as it showed the best fit to our data. The presence of second-order quadratic
relationships among variables were also tested but none were significant.
Table 1. Pearson's correlation coefficients between ecological and landscape variables.
extensive extensive extensive intensive intensive intensive distance from
extensive cultures (500 m) extensive cultures (1 km) extensive cultures (5 km) intensive cultures (500 m) intensive cultures (1 km) intensive cultures (5 km) distance from St. Lawrence River
cultures (500 m) — 0.656 0.376 -0.798 -0.664 -0.659 0.656 cultures (1km) 0.757 _. 0.630 -0.496 -0.601 -0.578 0.548 cultures (5 km) 0.398 0.630 — -0.379 -0.459 -0.576 0.514 cultures (500 m) -0.797 -0.560 -0.391 ... 0.876 0.821 -0.772 cultures (1km) -0.668 -0.601 -0.459 0.875 — 0.893 -0.758 cultures (5 km) -0.631 -0.578 -0.576 0.798 0.893 ... -0.856 St. Lawrence River (km) 0.655 0.548 0.514 -0.767 -0.758 -0.856 —
Values above diagonal refer to year 2006, below diagonal to 2007
All values significant at p < 0.001
We further investigated whether the settlement behaviour of individuals could play a role
in the spatial distribution of individual genetic diversity by testing the effects of internal
relatedness on the settlement dates of individuals, using generalized linear models (GLM)
with a Poisson error structure and a log-link function, which also included distance from
the St. Lawrence River, individual body mass and year as explanatory variables.
Settlement dates and measures of body mass were defined for 726 individuals. Since the
first date of settlement differed between 2006 and 2007, we standardized our data by
defining the first settlement date in each year as being day 1. We again built a series of
models containing all possible combination of explanatory variables for this analysis, and
compared them using AIC and their weight of evidence. No evidence for over-dispersion
was found in any of the models tested. All statistical tests were performed using the R
statistical environment v.2.7.1. (R Development Core Team 2008).
RESULTS
Microsatellite polymorphism
Three of the 10 amplified loci (HrU5, TBI 106 and Hir 17) showed significant departures
from HWE and high probabilities of null alleles and so were discarded from the analyses.
A total of 815 individuals (144 of which were captured during both study years) were
genotyped at up to 7 loci (mean number ± SD of adults analysed per farm: 2006: 12.7 ±
0.8; 2007: 11.1 ± 0.9). Individuals for which sex could not be determined and/or that were
genotyped at less than 3 loci (N = 6) were removed from the analyses. Number of alleles
per locus varied from 6 to 20 (mean: 12.1), with a mean expected heterozygosity of 0.78
(range: 0.63 to 0.88) (Supplementary table 1). We found no significant percentage of null
alleles and no evidences of linkage disequilibrium for any pairwise comparison of loci
after sequential Bonferroni correction (results not shown). Three out of the 7 loci (IBI
Ms3-31, HrU7 and Hir 22) showed significant deviation from HWE when both years were
analyzed together (see Supplementary table 1). These three loci were nevertheless included
in the remaining analyses as none of them showed consistent deviation across years. Mean
internal relatedness for individuals caught dead in nest-boxes did not differ significantly from the rest of the population (mean IR ± SD of dead individuals: -0.03 ± 0.18, mean IR ± SD for the remaining individuals: 0.04 ± 0.20, t = 1.30, p = 0.22).
Population genetic structure
Overall FSJ values across farms were small and non-significant (2006: FST = -0.001, p = 0.73; 2007: FS T = -0.002, p = 0.83), with pairwise FST values ranging from -0.110 to 0.150
for 2006 and from -0.081 to 0.082 for 2007. All pairwise comparisons were non-significant after sequential Bonferroni correction, indicating no genetic differentiation among farms within our study area. AMOVA analyses also revealed no significant variance partitioning of genetic diversity between study years (-0.04 %, p = 0.86) or among farms within years (-0.12 %, p = 0.91), respectively. Bayesian clustering analyses performed with STRUCTURE revealed that maximum log-likelihood values of the data were obtained at K = 1 for both study years, indicating the presence of a single genetic cluster over the study area. Yet, analyses of isolation by distance revealed a significant positive relationship between the pairwise relatedness of individuals and geographic distance in 2007 (b = 5.04
x 10"8, p = 0.001, r = 6.73 x 10"5) indicating that more genetically similar individuals
distributed themselves further apart than expected by chance. This relationship was also observed in 2006 but did not reach significance (b = 2.66 x 10"8, p = 0.09, r = 1.65 * 10"5).
Environment and individual genetic diversity
We first confirmed that the proportion of extensive cultures at 500 m was positively related to fledging success over the study period (see Fig. 2; see also Ghilain & Belisle 2008), thus suggesting that habitat quality increases with the amount of extensive cultures. Internal relatedness increased with the proportion of extensive cultures within 500 m of nest-boxes (Table 2, Fig 3). Thus, contrary to our expectations, a higher proportion of extensive cultures in the landscape is related to higher values of IR (i.e. lower genetic diversity). The best five models following comparisons based on AIC all contained the proportion of extensive cultures at 500 m as an explanatory variable (see Supplementary table 2). Results were also consistent across loci with 6 out of 7 loci showing a positive
association between extensive cultures at 500 m and IR. No significant effects of sex or
year were found for any of the analyses (see Table 2; see also Supplementary table 2).
Interactions between extensive cultures and sex as well as between extensive cultures and
year were also tested and were not significant (results not shown).
•a
•a 5.0 4.8 4.6 4.4 4.2 4.0 3.8 3.6 T MT "
II [ »
II 1 II 1 "
II 0.0 0.1 0.2 0.3 0.4 0.5 0.6 proportion of extensive cultures (500 m)0.7 0.8
Figure 2. Effect of the proportion of extensive cultures within 500 m of each nest-box on
the number of fledglings. For illustration purposes, each circle represents mean values (±
SE) for 8 classes of proportion of extensive cultures. The effect of the proportion of
extensive cultures at 500 m on number of fledglings was significant (b = 1.288 ± 0.587, p
= 0.035) when analysed using a linear mixed model with farm identity included as a
random term (N = 515).
Table 2. Effects of culture types on adult tree swallows' individual genetic diversity as
measured by internal relatedness. (a) Full extensive culture (500 m) general linear model,
with significance of each term included in the model, (b) Final extensive culture (500 m)
model, with significant term only. Number of observations = 952.
(a) Full extensive model (b) Final extensive model Variable
Extensive cultures (500 m) Year (2006 vs 2007) Sex
t statistic df p-value Estimate SE 2.71 1 0.007 Extensive cultures (500 m) 0.083 0.031 -0.71 1 0.477 0.11 1 0.914 0.0 u . j 0.2 0.1 0.0 0.1 0.2
-1 <
I -(> T T
1"-MIL*
o
• T — - 1 * > <{
0.2 0.4proportion of extensive cultures (500 m)
0.6 0.8
Figure 3. Relationship between extensive cultures within 500 m of around each nest-box
and internal relatedness. Each circle represents mean values (± SE) for each farm in the
study system (N = 952).
Settlement date was positively correlated with the distance from the St. Lawrence River (r
= 0.15, p < 0.001). These results effectively suggest that tree swallows consistently enter
our study area from the St. Lawrence River during spring migration. We further found a
significant positive relationship between the internal relatedness and settlement date of
individuals (Table 3, Fig. 4a) suggesting that individuals of higher genetic diversity settle
earlier on their breeding sites. IR was included in the best two models in the AIC analyses
(see Supplementary table 3), providing further support for the importance of individual
genetic diversity in explaining the settlement pattern of individuals. Again, results were
consistent across loci, with 6 out of 7 loci showing a positive association between IR and
settlement date. A more detailed inspection of this relationship revealed that it seems
mainly driven by females (b = 0.295, p = 0.024, N = 456) rather than males (b = 0.006, p =
0.97, N = 270). Interestingly, we also found that individuals with larger body mass arrived
earlier in our study area (Table 3, Fig. 4b). This relationship was found for both females (b
= -0.107, p < 0.001) and males (b = -0.105, p = 0.001). The effects of IR and body mass
seem largely independent as the correlation between them is very low and non-significant
(r =-0.01, p = 0.78).
Table 3. Generalized linear model (Poisson error structure and log-link function) of effects
of internal relatedness, distance from the St. Lawrence River, year and body mass on tree
swallows' settlement dates. Number of observations = 726.
Variable
Internal relatedness
Distance from St. Lawrence River Year(2006 vs 2007) Body mass z statistic 2.06 6.60 1.86 -6.12 df 1 1 1 1 p-value 0.040 < 0.001 0.064 < 0.001 estimate 0.221 0.006 0.079 -0.080 SE 0.107 0.001 0.043 0.013
a)
b)
-0.4 -0.2 -0.0 0.2 0.4 0.6 0.8 16 18 20 22 24 26 28 30 Internal relatedness mass (g)
Figure 4. Effect of internal relatedness (a) and body mass (b) on the settlement date of tree
swallows. Settlement dates correspond to adjusted values from a generalised linear model
(Poisson error structure and log-link function) of including internal relatedness, body mass,
distance from the St. Lawrence River and year (N = 726).
We also assessed if early settlement on the breeding sites translated into a higher
reproductive success for tree swallows. We found no direct relationships between
individual genetic diversity or settlement date and clutch size, brood size or number of
fledglings (results not shown). However, settlement date (r = 0.52, p < 0.001), but not
individual genetic diversity (r = 0.05, p = 0.32), was significantly correlated with laying
date, which itself influences clutch size and number of fledglings in our study system
(Ghilain & Belisle 2008).
DISCUSSION
Here we assessed the population genetic structure and the distribution of individual genetic diversity of a wild bird species along a gradient of agricultural intensification. We found no evidence of population genetic structuring over time or space for tree swallows, using either traditional population genetics methods or a landscape genetics approach. However, we found a nonrandom distribution of individual genetic variability that depended on landscape features. Specifically, individuals of greater genetic diversity were found in less extensive agricultural landscapes, which are composed of poorer quality habitat. This pattern seems to be partly generated by the earlier arrival and settlement of the most genetically diversified individuals into breeding sites closer to the St-Lawrence River, which also correspond to less extensive agricultural habitats.
Population genetic structure
Tree swallows in our study area belong to a single genetic population, with no apparent barrier to gene flow resulting from landscape heterogeneity. Birds, in general, are expected to show relatively lower levels of population differentiation than other taxa due to their high dispersal potential (Crochet 2000). Yet, some studies have found evidences for fine-scale genetic structure between social units in cooperatively breeding species (Double et al. 2005; Temple et al. 2006; Woxvold et al. 2006), and a few others have shown landscape-based population genetic structure (Barr et al. 2008; Hull et al. 2008). However, the vast majority of studies reporting a relationship between habitat fragmentation and genetic structure involved non-migratory birds (Bates 2002; Caizergues et al. 2003; Segelbacher et al. 2008). The effects of habitat fragmentation on migratory passerines are, on the other hand, equivocal, as several studies have found no effect of fragmentation on genetic structure (Galbusera et al. 2004; Veit et al. 2005), while others have shown that agricultural land cover can reduce dispersal and gene flow between populations (Lindsay et al. 2008).