GLOBAL MOTOR SKILL ASSESSMENT FROM THE UQAC-UQAM TEST BATTERY:
NORMATIVE VALUES BY AGE AND GENDER
ENGLISH VERSION
MARIO LEONE1, Ph.D. ÉMILIA KALINOVA2, Ph.D. ALAIN-STEVE COMTOIS2, Ph.D.
1
UNIVERSITÉ DU QUÉBEC À CHICOUTIMI 2
UNIVERSITÉ DU QUÉBEC À MONTRÉAL
NORMATIVE INTERPRETATION BY TEST BASED ON AGE AND SEX
Table 1. Weight (kg) for boys aged 6 to 12 years old.
Table 2. Height (cm) for boys aged 6 to 12 years old.
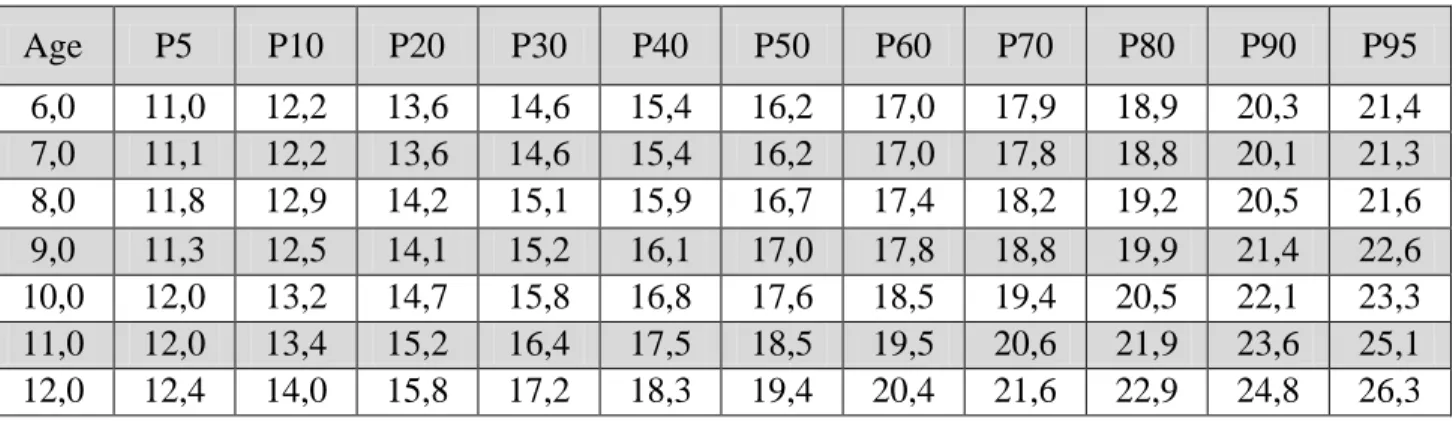
Table 3. Body mass index (kg/m2) for boys aged 6 to 12 years old.
Age P5 P10 P20 P30 P40 P50 P60 P70 P80 P90 P95 6,0 13,0 15,5 18,4 20,5 22,3 24,0 25,7 27,5 29,6 32,5 35,0 7,0 15,9 18,1 20,7 22,6 24,2 25,6 27,1 28,7 30,6 33,2 35,4 8,0 17,2 19,8 23,0 25,2 27,1 28,9 30,7 32,7 34,9 38,0 40,7 9,0 17,3 20,5 24,4 27,1 29,5 31,7 33,9 36,3 39,0 42,9 46,1 10,0 22,1 25,2 28,8 31,5 33,7 35,8 38,0 40,2 42,9 46,5 49,6 11,0 21,9 26,1 31,2 34,9 38,0 40,9 43,8 46,9 50,6 55,7 59,9 12,0 26,2 30,4 35,5 39,1 42,2 45,1 48,0 51,1 54,8 59,8 64,0 Age P5 P10 P20 P30 P40 P50 P60 P70 P80 P90 P95 6,0 111,6 113,7 116,2 118,0 119,5 121,0 122,4 123,9 125,7 128,2 130,3 7,0 116,1 118,2 120,7 122,6 124,1 125,6 127,0 128,6 130,4 132,9 135,1 8,0 120,7 123,0 125,9 127,9 129,6 131,3 132,9 134,6 136,7 139,5 141,9 9,0 124,7 127,3 130,4 132,6 134,4 136,2 138,0 139,8 142,0 145,1 147,6 10,0 131,4 133,7 136,6 138,6 140,4 142,0 143,6 145,6 147,4 150,3 152,6 11,0 135,6 138,3 141,5 143,9 145,9 147,8 149,7 151,7 154,0 157,3 160,0 12,0 138,6 141,6 145,2 147,8 150,0 152,1 154,2 156,4 159,1 162,7 165,7 Age P5 P10 P20 P30 P40 P50 P60 P70 P80 P90 P95 6,0 11,0 12,2 13,6 14,6 15,4 16,2 17,0 17,9 18,9 20,3 21,4 7,0 11,1 12,2 13,6 14,6 15,4 16,2 17,0 17,8 18,8 20,1 21,3 8,0 11,8 12,9 14,2 15,1 15,9 16,7 17,4 18,2 19,2 20,5 21,6 9,0 11,3 12,5 14,1 15,2 16,1 17,0 17,8 18,8 19,9 21,4 22,6 10,0 12,0 13,2 14,7 15,8 16,8 17,6 18,5 19,4 20,5 22,1 23,3 11,0 12,0 13,4 15,2 16,4 17,5 18,5 19,5 20,6 21,9 23,6 25,1 12,0 12,4 14,0 15,8 17,2 18,3 19,4 20,4 21,6 22,9 24,8 26,3
Table 4. Upper limb speed (nb/20s) for boys aged 6 to 12 years old.
Table 5. Lower limb speed (nb/20s) for boys aged 6 to 12 years old. .
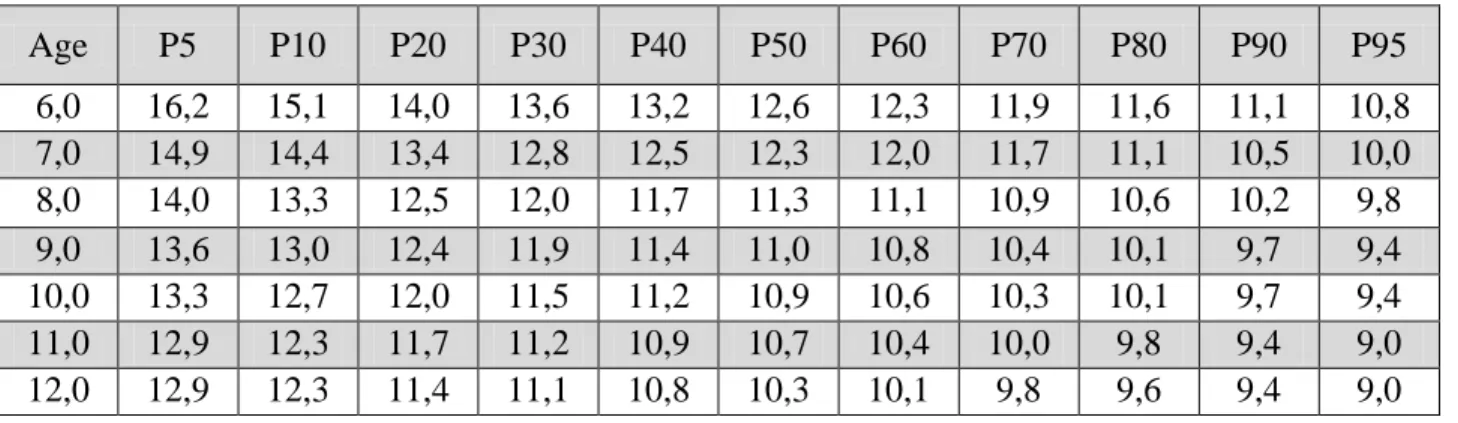
Table 6. Five meter shuttle run test (s) for boys aged 6 to 12 years old.
Age P5 P10 P20 P30 P40 P50 P60 P70 P80 P90 P95 6,0 39 41 45 47 49 51 53 55 58 61 64 7,0 40 44 48 51 54 56 59 61 64 69 72 8,0 47 50 54 57 60 62 65 67 70 74 77 9,0 52 55 59 61 64 66 68 70 73 77 80 10,0 56 59 63 66 69 71 74 76 79 84 87 11,0 61 64 68 71 73 76 78 80 83 87 90 12,0 61 64 68 71 74 77 80 83 86 91 95 Age P5 P10 P20 P30 P40 P50 P60 P70 P80 P90 P95 6,0 10 11 12 13 14 15 16 17 18 20 21 7,0 12 14 16 17 18 19 20 21 23 24 25 8,0 14 15 17 18 19 21 22 23 24 26 27 9,0 16 18 19 20 21 22 23 24 25 27 29 10,0 17 18 20 21 23 24 25 26 27 29 31 11,0 18 20 22 23 24 25 26 27 28 30 31 12,0 18 20 22 23 24 26 27 28 29 31 33 Age P5 P10 P20 P30 P40 P50 P60 P70 P80 P90 P95 6,0 16,2 15,1 14,0 13,6 13,2 12,6 12,3 11,9 11,6 11,1 10,8 7,0 14,9 14,4 13,4 12,8 12,5 12,3 12,0 11,7 11,1 10,5 10,0 8,0 14,0 13,3 12,5 12,0 11,7 11,3 11,1 10,9 10,6 10,2 9,8 9,0 13,6 13,0 12,4 11,9 11,4 11,0 10,8 10,4 10,1 9,7 9,4 10,0 13,3 12,7 12,0 11,5 11,2 10,9 10,6 10,3 10,1 9,7 9,4 11,0 12,9 12,3 11,7 11,2 10,9 10,7 10,4 10,0 9,8 9,4 9,0 12,0 12,9 12,3 11,4 11,1 10,8 10,3 10,1 9,8 9,6 9,4 9,0
Table 7. Circle run test (s) for boys aged 6 to 12 years old.
Table 8. Side step run test (s) for boys aged 6 to 12 years old.
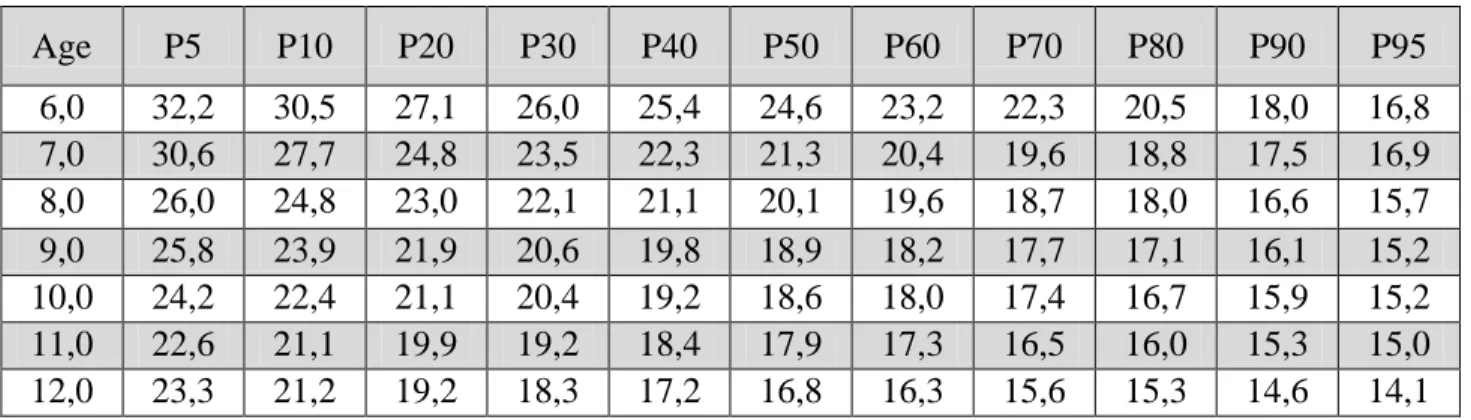
Table 9. Slalom run test (s) for boys aged 6 to 12 years old.
Age P5 P10 P20 P30 P40 P50 P60 P70 P80 P90 P95 6,0 30,8 29,0 26,7 25,8 24,9 24,3 23,7 22,9 22,0 21,1 20,1 7,0 29,0 28,1 26,5 25,4 24,1 23,4 22,8 22,1 21,4 20,7 20,0 8,0 28,2 27,0 25,2 23,9 23,0 22,3 21,8 21,3 20,7 19,8 19,4 9,0 27,6 26,2 24,5 23,3 22,3 21,6 21,1 20,6 19,9 19,0 18,3 10,0 26,3 25,1 23,5 22,5 21,6 21,2 20,6 20,1 19,7 19,0 18,1 11,0 25,4 24,6 23,0 22,1 21,5 20,9 20,3 19,9 19,2 18,4 18,1 12,0 26,0 25,1 22,3 21,5 20,9 20,3 19,9 19,4 18,9 18,3 17,9 Age P5 P10 P20 P30 P40 P50 P60 P70 P80 P90 P95 6,0 17,6 16,3 15,3 14,9 14,4 13,9 12,9 15,5 12,2 11,8 11,5 7,0 17,3 15,2 14,3 13,4 12,9 12,5 12,0 11,7 11,0 10,3 9,9 8,0 15,2 13,9 12,8 12,2 11,9 11,4 11,1 10,8 10,3 9,9 9,3 9,0 14,6 13,5 12,4 11,8 11,3 11,0 10,7 10,4 10,0 9,3 9,0 10,0 13,6 12,8 12,0 11,6 11,2 10,9 10,4 10,1 9,8 9,2 8,8 11,0 13,4 12,6 11,7 11,1 10,8 10,3 10,0 9,7 9,2 8,8 8,6 12,0 12,7 11,7 11,1 10,6 10,4 10,1 9,9 9,4 8,9 8,5 8,1 Age P5 P10 P20 P30 P40 P50 P60 P70 P80 P90 P95 6,0 32,2 30,5 27,1 26,0 25,4 24,6 23,2 22,3 20,5 18,0 16,8 7,0 30,6 27,7 24,8 23,5 22,3 21,3 20,4 19,6 18,8 17,5 16,9 8,0 26,0 24,8 23,0 22,1 21,1 20,1 19,6 18,7 18,0 16,6 15,7 9,0 25,8 23,9 21,9 20,6 19,8 18,9 18,2 17,7 17,1 16,1 15,2 10,0 24,2 22,4 21,1 20,4 19,2 18,6 18,0 17,4 16,7 15,9 15,2 11,0 22,6 21,1 19,9 19,2 18,4 17,9 17,3 16,5 16,0 15,3 15,0 12,0 23,3 21,2 19,2 18,3 17,2 16,8 16,3 15,6 15,3 14,6 14,1
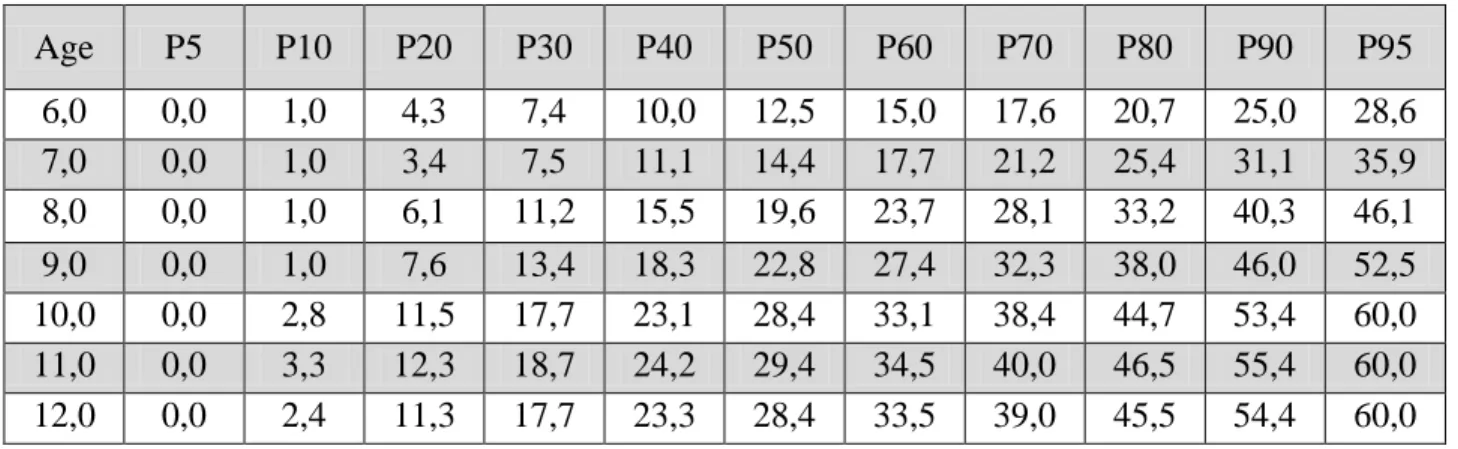
Table 10. One foot eyes opened balance test (s) for boys aged 6 to 12 years old.
Table11. One foot eyes closed balance test (s) for boys aged 6 to 12 years old.
Table 12. Board balance test (s) for boys aged 6 to 12 years old.
Age P5 P10 P20 P30 P40 P50 P60 P70 P80 P90 P95 6,0 0,0 1,0 4,3 7,4 10,0 12,5 15,0 17,6 20,7 25,0 28,6 7,0 0,0 1,0 3,4 7,5 11,1 14,4 17,7 21,2 25,4 31,1 35,9 8,0 0,0 1,0 6,1 11,2 15,5 19,6 23,7 28,1 33,2 40,3 46,1 9,0 0,0 1,0 7,6 13,4 18,3 22,8 27,4 32,3 38,0 46,0 52,5 10,0 0,0 2,8 11,5 17,7 23,1 28,4 33,1 38,4 44,7 53,4 60,0 11,0 0,0 3,3 12,3 18,7 24,2 29,4 34,5 40,0 46,5 55,4 60,0 12,0 0,0 2,4 11,3 17,7 23,3 28,4 33,5 39,0 45,5 54,4 60,0 Age P5 P10 P20 P30 P40 P50 P60 P70 P80 P90 P95 6,0 0,0 2,0 2,5 4,6 6,4 8,0 9,7 11,5 13,6 16,5 18,9 7,0 0,0 2,0 3,8 6,9 9,6 12,1 14,6 17,2 20,4 24,7 28,3 8,0 0,0 2,0 3,9 8,7 12,8 16,6 20,4 24,4 29,2 35,8 41,3 9,0 0,0 2,5 5,7 10,4 14,4 18,2 21,9 25,9 30,7 37,2 42,6 10,0 0,0 2,5 7,0 12,5 17,2 21,6 26,0 30,7 38,9 43,8 50,1 11,0 0,0 2,5 7,0 12,7 17,7 22,3 26,9 31,8 37,6 45,6 52,2 12,0 0,0 3,2 12,3 19,0 24,6 29,9 35,1 40,8 47,4 56,6 60,0 Age P5 P10 P20 P30 P40 P50 P60 P70 P80 P90 P95 6,0 0,0 0,5 1,0 2,0 3,8 5,4 7,0 8,7 10,8 13,6 15,9 7,0 0,0 0,5 1,0 2,0 3,9 5,7 7,5 9,5 11,8 14,9 17,5 8,0 0,0 0,5 1,0 2,4 4,7 6,8 8,9 11,2 13,9 17,5 20,6 9,0 0,0 0,5 1,0 3,7 7,5 11,0 14,5 18,3 22,7 28,8 33,8 10,0 0,0 1,0 2,1 7,2 11,5 15,6 19,6 23,9 29,0 36,0 41,8 11,0 0,0 1,0 2,3 6,2 11,2 15,9 20,6 25,7 31,6 39,7 46,8 12,0 0,0 1,0 3,6 9,7 15,0 19,9 24,8 30,1 36,2 44,8 51,8
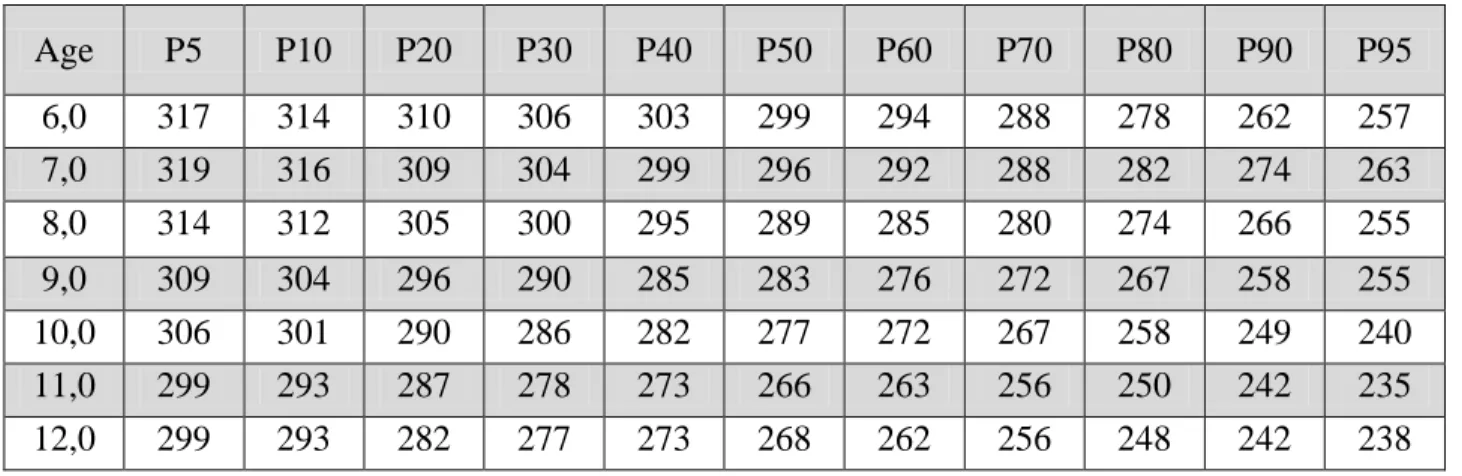
Table 13. Simple reaction time (ms) for boys aged 6 to 12 years old.
Table 14. Target (precision) test (pts) for boys aged 6 to 12 years old.
Table 15. Coordination test (s) for boys aged 6 to 12 years old.
Age P5 P10 P20 P30 P40 P50 P60 P70 P80 P90 P95 6,0 317 314 310 306 303 299 294 288 278 262 257 7,0 319 316 309 304 299 296 292 288 282 274 263 8,0 314 312 305 300 295 289 285 280 274 266 255 9,0 309 304 296 290 285 283 276 272 267 258 255 10,0 306 301 290 286 282 277 272 267 258 249 240 11,0 299 293 287 278 273 266 263 256 250 242 235 12,0 299 293 282 277 273 268 262 256 248 242 238 Age P5 P10 P20 P30 P40 P50 P60 P70 P80 P90 P95 6,0 0 0 1 1 2 2 3 3 4 5 5 7,0 0 0 1 2 2 3 3 4 5 6 6 8,0 0 1 2 3 3 4 4 5 6 7 8 9,0 0 1 2 3 4 5 6 6 7 8 9 10,0 1 2 3 4 5 6 6 7 8 9 10 11,0 2 3 4 5 6 6 7 8 9 10 11 12,0 2 3 4 5 6 7 8 9 10 11 12 Age P5 P10 P20 P30 P40 P50 P60 P70 P80 P90 P95 6,0 56,8 41,0 35,3 30,8 27,4 24,4 21,8 18,2 16,1 13,6 10,9 7,0 33,0 29,7 24,2 21,5 19,1 16,8 15,2 13,7 12,2 11,0 9,9 8,0 29,1 25,6 20,4 17,8 15,9 14,4 13,3 12,3 10,9 9,3 7,7 9,0 25,8 19,9 17,1 14,8 13,3 12,3 11,6 10,7 10,0 8,4 8,0 10,0 20,0 17,2 14,4 12,8 11,6 10,8 9,9 9,3 8,5 7,5 6,7 11,0 18,3 15,1 13,0 11,9 11,1 10,0 9,3 8,7 7,9 6,9 6,4 12,0 17,7 16,4 13,5 11,4 10,2 9,3 8,7 8,2 7,5 6,4 5,7
Table 16. Dribble test (nb/20s) for boys aged 6 to 12 years old.
Table 17. Leger 20m shuttle run test (stages) for boys aged 6 to 12 years old.
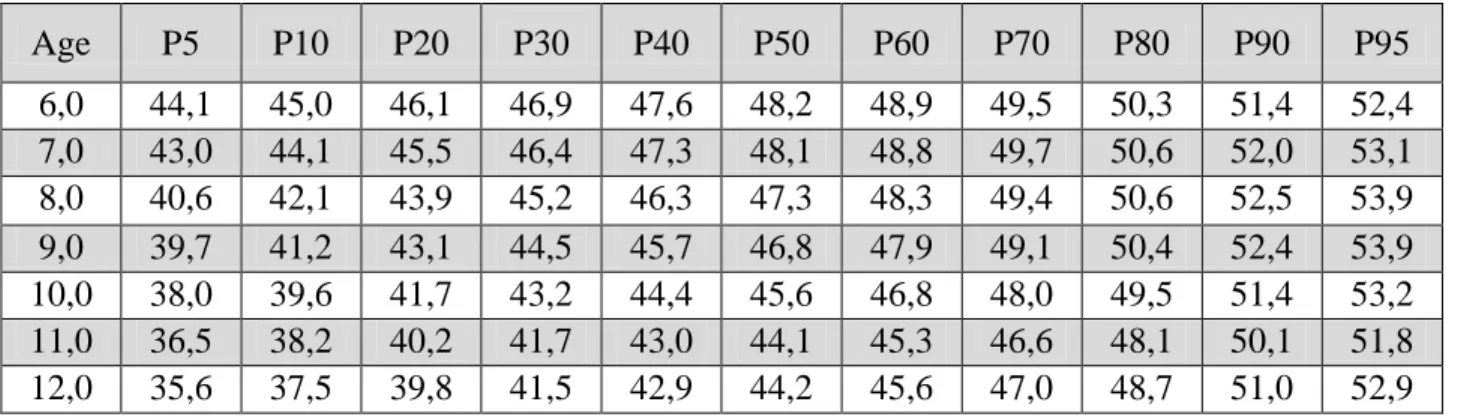
Table 18. Leger 20m shuttle run test (ml/kg/min) for boys aged 6 to 12 years old.
Age P5 P10 P20 P30 P40 P50 P60 P70 P80 P90 P95 6,0 10 14 21 25 29 32 34 35 38 41 43 7,0 16 20 26 29 31 33 35 38 40 43 46 8,0 22 27 30 32 34 36 38 41 43 47 48 9,0 27 29 34 36 38 40 42 43 46 48 52 10,0 30 32 35 37 39 41 42 43 46 49 53 11,0 31 33 37 40 41 42 44 45 47 51 53 12,0 32 35 38 41 43 46 48 49 51 53 58 Age P5 P10 P20 P30 P40 P50 P60 P70 P80 P90 P95 6,0 0,50 1,00 1,25 1,25 1,50 1,75 2,00 2,50 3,00 3,50 4,50 7,0 1,00 1,25 1,50 1,75 2,00 2,50 2,75 3,00 4,00 4,50 5,00 8,0 1,00 1,25 1,50 1,75 2,00 3,00 3,50 4,00 4,50 5,50 6,50 9,0 1,00 1,25 2,00 2,50 3,00 3,50 4,00 4,50 5,00 6,00 7,00 10,0 1,00 1,50 2,00 2,50 3,00 3,75 4,50 5,00 5,50 6,50 7,50 11,0 1,00 1,50 2,00 3,00 3,25 4,00 4,50 5,00 5,50 6,50 7,00 12,0 1,50 2,00 2,50 3,00 4,00 5,00 5,25 5,50 6,50 7,00 8,00 Age P5 P10 P20 P30 P40 P50 P60 P70 P80 P90 P95 6,0 44,1 45,0 46,1 46,9 47,6 48,2 48,9 49,5 50,3 51,4 52,4 7,0 43,0 44,1 45,5 46,4 47,3 48,1 48,8 49,7 50,6 52,0 53,1 8,0 40,6 42,1 43,9 45,2 46,3 47,3 48,3 49,4 50,6 52,5 53,9 9,0 39,7 41,2 43,1 44,5 45,7 46,8 47,9 49,1 50,4 52,4 53,9 10,0 38,0 39,6 41,7 43,2 44,4 45,6 46,8 48,0 49,5 51,4 53,2 11,0 36,5 38,2 40,2 41,7 43,0 44,1 45,3 46,6 48,1 50,1 51,8 12,0 35,6 37,5 39,8 41,5 42,9 44,2 45,6 47,0 48,7 51,0 52,9
NORMATIVE INTERPRETATION BY TEST BASED ON AGE AND SEX
Table 1. Weight (kg) for girls aged 6 to 12 years old.
Table 2. Height (cm) for girls aged 6 to 12 years old.
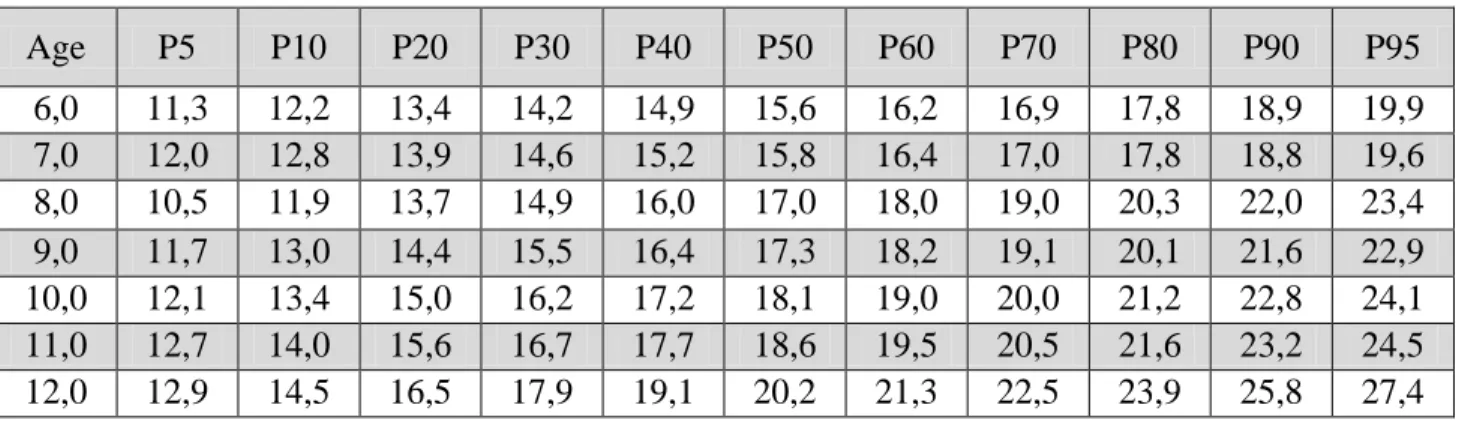
Table 3. Body mass index (kg/m2) for girls aged 6 to 12 years old.
Age P5 P10 P20 P30 P40 P50 P60 P70 P80 P90 P95 6,0 15,2 16,8 18,8 20,2 21,4 22,5 23,6 24,8 26,2 28,2 29,7 7,0 16,4 18,2 20,5 22,1 23,4 24,7 26,0 27,3 28,9 31,1 32,9 8,0 15,7 18,6 22,2 24,8 27,0 29,1 31,1 33,4 35,9 39,5 42,5 9,0 18,2 21,3 25,1 27,8 30,2 32,3 34,5 36,8 39,6 43,3 46,5 10,0 22,0 25,4 29,6 32,6 35,1 37,5 39,9 42,5 45,5 49,7 53,1 11,0 26,3 29,9 34,2 37,4 40,1 42,6 45,1 47,7 50,9 55,2 58,8 12,0 27,2 31,9 37,5 41,6 45,1 48,4 51,6 55,1 59,2 64,9 69,5 Age P5 P10 P20 P30 P40 P50 P60 P70 P80 P90 P95 6,0 110,1 113,0 115,4 117,2 118,6 120,0 121,4 122,9 124,6 127,0 129,0 7,0 115,6 117,6 120,0 121,7 123,2 124,5 125,9 127,4 129,1 131,5 133,5 8,0 120,1 122,4 124,1 127,1 128,8 130,4 132,0 133,7 135,7 138,5 140,7 9,0 124,7 127,2 130,2 132,4 134,3 136,1 137,8 139,6 141,8 144,8 147,3 10,0 130,2 133,1 136,7 139,2 141,4 142,4 145,5 147,7 150,2 153,8 156,7 11,0 137,6 140,5 144,0 146,5 148,7 150,7 152,7 154,9 157,4 160,9 163,8 12,0 142,1 144,8 148,1 150,4 152,5 154,3 156,2 158,2 160,6 163,9 166,6 Age P5 P10 P20 P30 P40 P50 P60 P70 P80 P90 P95 6,0 11,3 12,2 13,4 14,2 14,9 15,6 16,2 16,9 17,8 18,9 19,9 7,0 12,0 12,8 13,9 14,6 15,2 15,8 16,4 17,0 17,8 18,8 19,6 8,0 10,5 11,9 13,7 14,9 16,0 17,0 18,0 19,0 20,3 22,0 23,4 9,0 11,7 13,0 14,4 15,5 16,4 17,3 18,2 19,1 20,1 21,6 22,9 10,0 12,1 13,4 15,0 16,2 17,2 18,1 19,0 20,0 21,2 22,8 24,1 11,0 12,7 14,0 15,6 16,7 17,7 18,6 19,5 20,5 21,6 23,2 24,5 12,0 12,9 14,5 16,5 17,9 19,1 20,2 21,3 22,5 23,9 25,8 27,4
Table 4. Upper limb speed (nb/20s) for girls aged 6 to 12 years old.
Table 5. Lower limb speed (nb/20s) for girls aged 6 to 12 years old.
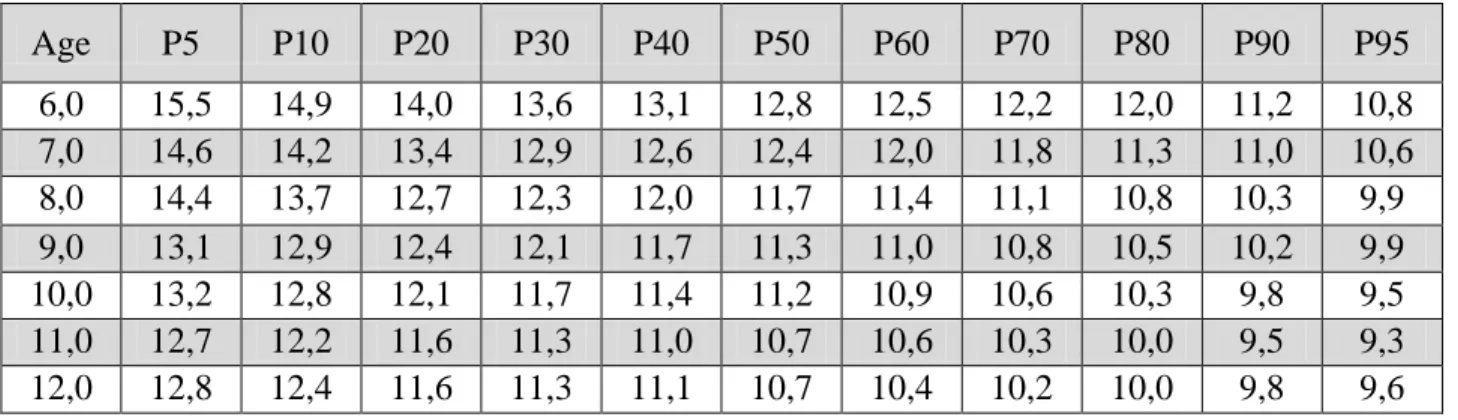
Table 6. Five meter shuttle run test (s) for girls aged 6 to 12 years old.
Age P5 P10 P20 P30 P40 P50 P60 P70 P80 P90 P95 6,0 34 38 42 46 49 51 54 56 60 64 65 7,0 38 43 48 50 54 56 60 62 64 66 68 8,0 46 51 56 58 60 62 64 66 69 72 74 9,0 52 56 60 62 64 66 68 72 74 78 82 10,0 53 60 64 66 68 72 74 77 80 86 90 11,0 60 64 68 72 74 76 80 82 86 92 96 12,0 56 64 69 72 74 77 80 83 88 92 96 Age P5 P10 P20 P30 P40 P50 P60 P70 P80 P90 P95 6,0 11 12 13 14 15 16 17 18 19 20 21 7,0 11 13 15 16 17 18 19 20 21 22 24 8,0 15 17 18 19 20 21 22 23 24 25 26 9,0 17 18 20 21 22 23 24 24 25 26 28 10,0 19 20 21 22 23 24 25 25 26 28 29 11,0 20 21 22 23 24 26 26 27 28 30 31 12,0 21 22 23 24 25 26 27 28 29 31 34 Age P5 P10 P20 P30 P40 P50 P60 P70 P80 P90 P95 6,0 15,5 14,9 14,0 13,6 13,1 12,8 12,5 12,2 12,0 11,2 10,8 7,0 14,6 14,2 13,4 12,9 12,6 12,4 12,0 11,8 11,3 11,0 10,6 8,0 14,4 13,7 12,7 12,3 12,0 11,7 11,4 11,1 10,8 10,3 9,9 9,0 13,1 12,9 12,4 12,1 11,7 11,3 11,0 10,8 10,5 10,2 9,9 10,0 13,2 12,8 12,1 11,7 11,4 11,2 10,9 10,6 10,3 9,8 9,5 11,0 12,7 12,2 11,6 11,3 11,0 10,7 10,6 10,3 10,0 9,5 9,3 12,0 12,8 12,4 11,6 11,3 11,1 10,7 10,4 10,2 10,0 9,8 9,6
Table 7. Circle run test (s) for girls aged 6 to 12 years old.
Table 8. Side step run test (s) for girls aged 6 to 12 years old.
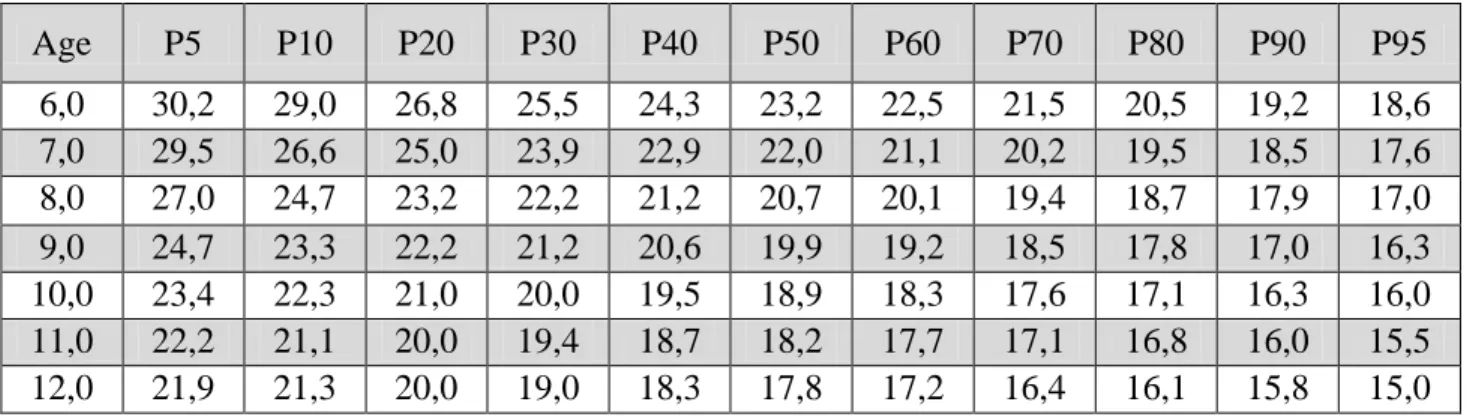
Table 9. Slalom run test (s) for girls aged 6 to 12 years old.
Age P5 P10 P20 P30 P40 P50 P60 P70 P80 P90 P95 6,0 29,3 27,8 26,8 26,0 25,0 24,6 24,1 23,3 22,6 21,9 20,7 7,0 29,8 28,1 26,5 25,4 24,4 23,7 23,2 22,7 22,2 21,5 21,0 8,0 28,3 26,4 25,2 24,1 23,4 22,8 22,2 21,6 21,2 20,3 19,7 9,0 26,7 25,5 24,5 23,8 23,1 22,5 21,9 21,2 20,6 19,9 19,3 10,0 26,9 25,5 24,4 23,5 22,5 21,8 21,3 20,7 20,1 19,5 19,1 11,0 26,1 24,7 23,2 22,5 21,8 21,3 21,0 20,3 20,0 19,4 18,7 12,0 26,5 25,0 23,2 22,5 21,7 21,4 20,9 20,2 19,7 19,2 18,6 Age P5 P10 P20 P30 P40 P50 P60 P70 P80 P90 P95 6,0 19,2 17,1 15,6 14,6 14,1 13,5 13,0 12,5 12,1 11,6 11,2 7,0 16,4 15,5 14,4 13,7 13,3 13,0 12,5 12,1 11,6 11,0 10,6 8,0 15,2 14,6 13,7 12,9 12,5 12,0 11,5 11,1 10,8 10,2 9,7 9,0 14,3 13,8 12,9 12,2 11,8 11,4 11,1 10,8 10,3 10,0 9,3 10,0 13,6 12,9 12,2 11,7 11,4 11,1 10,6 10,4 9,9 9,4 8,9 11,0 13,0 12,3 11,8 11,3 10,9 10,6 10,2 10,0 9,6 9,2 8,7 12,0 12,9 11,9 11,5 11,1 10,7 10,5 10,1 9,8 9,5 9,0 8,8 Age P5 P10 P20 P30 P40 P50 P60 P70 P80 P90 P95 6,0 30,2 29,0 26,8 25,5 24,3 23,2 22,5 21,5 20,5 19,2 18,6 7,0 29,5 26,6 25,0 23,9 22,9 22,0 21,1 20,2 19,5 18,5 17,6 8,0 27,0 24,7 23,2 22,2 21,2 20,7 20,1 19,4 18,7 17,9 17,0 9,0 24,7 23,3 22,2 21,2 20,6 19,9 19,2 18,5 17,8 17,0 16,3 10,0 23,4 22,3 21,0 20,0 19,5 18,9 18,3 17,6 17,1 16,3 16,0 11,0 22,2 21,1 20,0 19,4 18,7 18,2 17,7 17,1 16,8 16,0 15,5 12,0 21,9 21,3 20,0 19,0 18,3 17,8 17,2 16,4 16,1 15,8 15,0
Table 10. One foot eyes opened balance test (s) for girls aged 6 to 12 years old.
Table 11. One foot eyes closed balance test (s) for girls aged 6 to 12 years old.
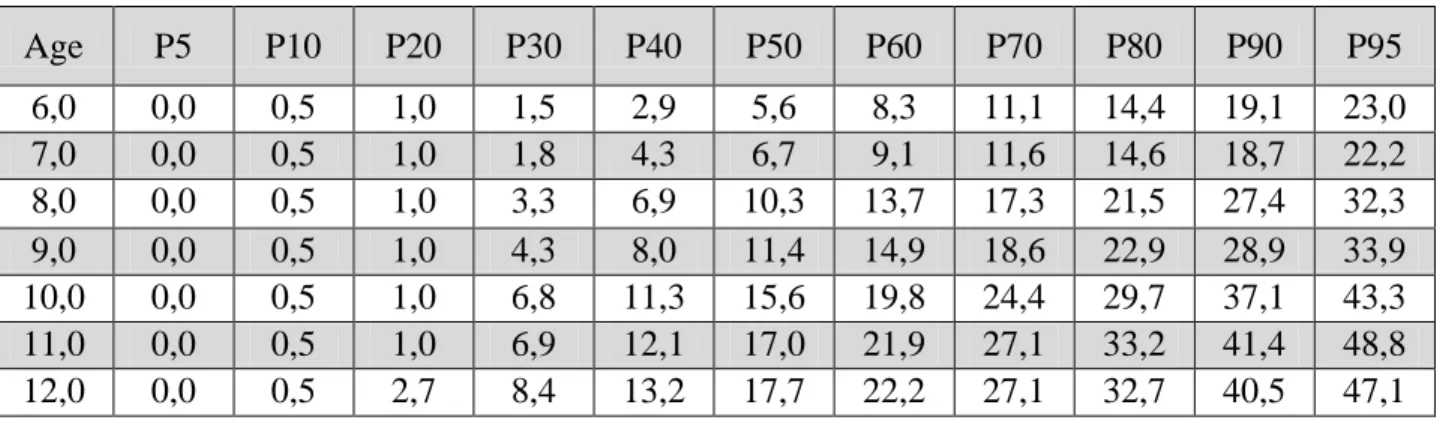
Table 12. Board balance test (s) for girls aged 6 to 12 years old.
Age P5 P10 P20 P30 P40 P50 P60 P70 P80 P90 P95 6,0 0,0 1,0 3,1 7,9 12,0 15,8 19,6 23,7 28,5 35,1 40,6 7,0 0,0 1,0 5,2 10,1 14,3 18,2 22,2 26,4 31,2 38,2 43,8 8,0 0,0 1,0 9,1 15,0 19,9 24,5 29,1 34,1 39,9 47,9 54,5 9,0 0,0 1,6 10,1 16,2 21,4 26,2 31,1 36,3 42,4 50,8 57,8 10,0 0,0 6,5 15,7 22,3 27,9 33,2 38,4 44,1 50,7 59,8 60,0 11,0 0,0 3,1 12,6 19,5 25,4 30,8 36,3 42,2 49,0 58,6 60,0 12,0 0,0 4,6 14,1 20,9 26,8 32,2 37,7 43,5 50,3 59,8 60,0 Age P5 P10 P20 P30 P40 P50 P60 P70 P80 P90 P95 6,0 0,0 1,0 2,0 5,2 7,9 10,4 13,0 15,7 18,9 23,3 26,9 7,0 0,0 1,0 3,3 8,0 12,0 15,7 19,4 23,4 28,0 34,5 39,8 8,0 0,0 1,0 5,6 10,6 14,9 18,9 22,9 27,2 32,2 39,1 44,9 9,0 0,0 1,0 6,9 11,7 15,8 19,7 23,5 27,6 32,5 39,1 44,6 10,0 0,0 1,0 9,2 15,2 20,3 25,0 29,8 34,8 40,8 49,1 55,9 11,0 0,0 1,0 8,7 14,8 20,1 25,0 29,9 35,1 41,3 49,8 56,8 12,0 0,0 3,8 12,5 18,7 24,1 29,0 34,0 39,3 45,6 54,2 60,0 Age P5 P10 P20 P30 P40 P50 P60 P70 P80 P90 P95 6,0 0,0 0,5 1,0 1,5 2,9 5,6 8,3 11,1 14,4 19,1 23,0 7,0 0,0 0,5 1,0 1,8 4,3 6,7 9,1 11,6 14,6 18,7 22,2 8,0 0,0 0,5 1,0 3,3 6,9 10,3 13,7 17,3 21,5 27,4 32,3 9,0 0,0 0,5 1,0 4,3 8,0 11,4 14,9 18,6 22,9 28,9 33,9 10,0 0,0 0,5 1,0 6,8 11,3 15,6 19,8 24,4 29,7 37,1 43,3 11,0 0,0 0,5 1,0 6,9 12,1 17,0 21,9 27,1 33,2 41,4 48,8 12,0 0,0 0,5 2,7 8,4 13,2 17,7 22,2 27,1 32,7 40,5 47,1
Table 13. Simple reaction time (ms) for girls aged 6 to 12 years old.
Table 14. Target (precision) test (pts) for girls aged 6 to 12 years old.
Table 15. Coordination test (s) for girls aged 6 to 12 years old.
Age P5 P10 P20 P30 P40 P50 P60 P70 P80 P90 P95 6,0 326 319 315 313 307 301 295 292 286 275 262 7,0 320 319 314 309 305 301 296 291 285 274 261 8,0 320 315 310 305 300 296 290 286 281 269 262 9,0 316 312 305 299 295 288 285 280 275 266 260 10,0 312 306 297 292 288 284 278 271 264 253 247 11,0 305 298 292 289 285 277 274 269 260 253 248 12,0 309 304 286 278 275 273 268 265 259 252 244 Age P5 P10 P20 P30 P40 P50 P60 P70 P80 P90 P95 6,0 0 0 0 1 1 1 2 2 2 3 4 7,0 0 0 0 1 1 2 2 3 3 4 4 8,0 0 0 1 1 2 3 3 4 4 5 6 9,0 0 0 1 2 2 3 3 4 5 5 6 10,0 0 1 2 3 4 4 5 5 6 7 8 11,0 1 1 2 3 4 4 5 6 6 7 8 12,0 1 2 3 4 4 5 6 6 7 8 9 Age P5 P10 P20 P30 P40 P50 P60 P70 P80 P90 P95 6,0 39,2 35,0 29,1 25,2 22,6 20,0 17,7 16,1 14,3 12,9 11,3 7,0 29,0 25,3 21,7 20,0 17,6 15,9 14,4 13,5 11,7 9,5 7,7 8,0 24,4 21,2 17,7 15,0 13,3 12,1 11,2 10,0 8,7 7,5 7,0 9,0 23,1 17,7 14,9 13,1 11,8 10,8 10,0 9,4 8,4 7,1 6,5 10,0 15,7 13,9 11,8 10,8 9,9 9,3 8,6 8,2 7,4 6,7 6,0 11,0 14,8 12,4 11,0 10,0 9,2 8,5 7,9 7,5 6,9 6,2 5,6 12,0 13,6 11,1 10,2 9,4 8,9 8,3 7,9 7,4 6,9 6,0 5,2
Table 16. Dribble test (nb/20s) for girls aged 6 to 12 years old.
Table 17. Leger 20m shuttle run test (stages) for girls aged 6 to 12 years old.
Table 18. Leger 20m shuttle run test (ml/kg/min) for girls aged 6 to 12 years old.
Age P5 P10 P20 P30 P40 P50 P60 P70 P80 P90 P95 6,0 10 12 17 20 24 27 29 32 34 38 40 7,0 12 16 23 26 29 30 32 35 36 39 40 8,0 20 27 30 31 33 35 37 39 40 43 45 9,0 26 28 32 34 36 37 39 40 41 45 48 10,0 28 30 34 36 38 39 41 42 44 47 50 11,0 31 33 36 37 38 40 41 42 45 47 49 12,0 29 34 37 38 40 41 42 44 45 49 51 Age P5 P10 P20 P30 P40 P50 P60 P70 P80 P90 P95 6,0 1.00 1.00 1.00 1.00 1.25 1.50 1.75 2.00 2.50 3.00 4.25 7,0 1.00 1.00 1.25 1.50 1.75 2.00 2.50 3.00 3.25 3.50 4.50 8,0 1.00 1.25 1.50 1.75 2.00 2.25 2.50 3.00 3.50 4.50 5.00 9,0 1.00 1.25 1.50 2.00 2.25 2.50 3.00 3.25 3.50 4.50 5.00 10,0 1.00 1.50 1.75 2.00 2.50 3.00 3.25 4.00 4.50 5.50 6.00 11,0 1.50 1.75 2.00 2.50 3.00 3.25 3.50 4.00 4.50 5.00 6.00 12,0 1.00 1.50 2.00 2.50 3.00 3.50 4.00 4.25 5.00 5.50 7.50 Age P5 P10 P20 P30 P40 P50 P60 P70 P80 P90 P95 6,0 43,6 44,5 45,6 46,4 47,1 47,7 48,3 49,0 49,8 50,8 51,7 7,0 42,9 43,8 44,9 45,7 46,4 47,1 47,7 48,4 49,2 50,3 51,2 8,0 40,8 41,9 43,3 44,3 45,1 45,9 46,7 47,5 48,5 49,9 51,0 9,0 39,8 40,9 42,1 43,0 43,8 44,5 45,2 46,0 47,1 48,8 49,2 10,0 37,6 39,0 40,7 41,9 42,9 43,9 44,9 45,9 47,1 48,8 50,2 11,0 36,8 38,1 39,6 40,8 41,7 42,6 43,5 44,4 45,6 47,1 48,4 12,0 34,4 36,0 38,0 39,4 40,6 41,7 42,8 44,0 45,5 47,4 49,0