HAL Id: hal-03224905
https://hal.archives-ouvertes.fr/hal-03224905
Submitted on 12 May 2021
HAL is a multi-disciplinary open access
archive for the deposit and dissemination of
sci-entific research documents, whether they are
pub-lished or not. The documents may come from
teaching and research institutions in France or
abroad, or from public or private research centers.
L’archive ouverte pluridisciplinaire HAL, est
destinée au dépôt et à la diffusion de documents
scientifiques de niveau recherche, publiés ou non,
émanant des établissements d’enseignement et de
recherche français ou étrangers, des laboratoires
publics ou privés.
Shashank Kumar, Bapan Debnath, Meena M. S, Julien Fade, Sankar Dhar,
Mehdi Alouini, Fabien Bretenaker, Hema Ramachandran
To cite this version:
Shashank Kumar, Bapan Debnath, Meena M. S, Julien Fade, Sankar Dhar, et al.. Imaging through
fog using quadrature lock-in discrimination. OSA Continuum, OSA Publishing, 2021, 4, pp.1649-1657.
�10.1364/osac.425499�. �hal-03224905�
Imaging through fog using quadrature lock-in
discrimination
S
HASHANKK
UMAR,
1,2B
APAND
EBNATH,
1M
EENAM. S.,
1J
ULIENF
ADE,
3S
ANKARD
HAR,
4M
EHDIA
LOUINI,
3F
ABIENB
RETENAKER,
1,5,* ANDH
EMAR
AMACHANDRAN1,†1Raman Research Institute, Sadashiv Nagar, Bangalore, India 560080
2Presently at Space Applications Centre, Indian Space Research Organisation, Ahmedabad, India 3Univ. Rennes, CNRS, Institut FOTON - UMR 6082, F- 35000 Rennes, France
4Shiv Nadar University, Gautam Buddha Nagar, Uttar Pradesh 201314, India
5Université Paris-Saclay, CNRS, ENS Paris-Saclay, CentraleSupélec, LuMIn, 91190, Gif-sur-Yvette, France *fabien.bretenaker@universite-paris-saclay.fr
†Deceased
Abstract: We report experiments conducted in the field in the presence of fog, that were aimed
at imaging under poor visibility. By means of intensity modulation at the source and two-dimensional quadrature lock-in detection by software at the receiver, a significant enhancement of the contrast-to-noise ratio was achieved in the imaging of beacons over hectometric distances. Further by illuminating the field of view with a modulated source, the technique helped reveal objects that were earlier obscured due to multiple scattering of light. This method, thus, holds promise of aiding in various forms of navigation under poor visibility due to fog.
© 2021 Optical Society of America under the terms of theOSA Open Access Publishing Agreement 1. Introduction and context
Visibility is reduced in fog because the tiny droplets of water suspended in air cause random multiple scattering of light, thereby degrading the image-bearing capabilities of photons. This is detrimental to many imaging applications of optics in open air, based either on passive imaging of scenes immersed in fog, or on active detection of beacons. This latter situation is of particular relevance when series of beacons are installed along runways to guide aircraft for landing and takeoff. It becomes impossible for the pilot to observe these beacons during thick fogs, and there is no other alternative in the case of airfields or aircraft not equipped with radio-frequency instrument landing systems. Similar problems exist in maritime navigation, railway transportation, and even for motor transport on highways. Such examples illustrate the need for a simple, cheap, and compact technique aimed at improving the visibility of optical beacons in foggy weather conditions, and if possible also viewing objects that do not themselves emit light.
One class of “fog-removal” technique is purely computational, where image processing algorithms are used on single or multiple images to remove the effect of fog (e.g., [1] and references therein). The other class of techniques exploits the physics of the problem and discriminates between different types of photon trajectories. Photons transiting a scattering medium are usually classified as (a) ballistic photons, that are forward scattered and retain their original direction of propagation, (b) snake photons, that are near forward scattered, and have paths that are not far from the ballistic, and (c) diffusive photons that are scattered through random angles over all directions and whose paths are scrambled such that the original direction of propagation is lost. The various approaches that have been used either select the small amount of ballistic (and snake) photons from among the huge amount of multiply scattered light that reaches the detector or the camera, or exploit the diffusive light itself to gain imaging capabilities (see, for example, reviews [2,3]). As illustrations of the first strategy, the ballistic photons may be temporally discriminated using a pulsed source of light in conjunction with time-gated detection
#425499 https://doi.org/10.1364/OSAC.425499
[4] or time gated holography [5]. An alternative technique also based on pulsed laser illumination exploits the different statistics of backscattered and reflected photons [6]. Many recent works have aimed at imaging or focussing light through strongly scattering media, mainly for bio-medical imaging through live tissues [7–9]. These techniques, that characterise the scattering properties of the turbid medium, have limited applicability to fog, as the scatterers in fog are constantly moving at high speed.
In the context of imaging through fog, another simpler and cheaper approach consists in using a modulated continuous-wave source of light and relies on the fact that the intensity variation of the ballistic photons retains a phase relationship with the intensity modulation of the source, while that of the multiply scattered photons does not. This technique requires a demodulation of the detected signal at the modulation frequency. High modulation frequencies are required for true ballistic filtering [10], especially when the scatterers have a large anisotropy factor with significant forward scattering, as is the case with Mie scatterers. Rayleigh scatterers, due to their almost isotropic scattering, should in principle permit discrimination of the diffusive from the ballistic low scattering order components at lower modulation frequencies [10], however at the cost of a reduced number of ballistic or snake-like photons. Thus, the modulation-demodulation technique has proven to be efficient in enhancing source visibility, by discriminating against the background contributed by ambient lighting, sources modulated at different frequencies, and to varying extents, the diffusive photons. The demodulation may be performed using a bucket detector followed by lock-in electronics. This requires a step scan of the detector to build a two-dimensional image [11], and is thus time-consuming. Demodulation may be performed numerically using Fourier transform over a time-series of images [12]. Though many optimised algorithms are available for fast Fourier transform, the technique has its drawbacks [13] - it requires large memories to store the time series (1K frames or more) of images (each megapixels or more), on-camera buffer sizes are not large enough, and storage and read-out of images on the computer takes time. An alternative technique that was recently demonstrated consists in performing this demodulation instantaneously by optical means, with promising perspectives of high-frequency operation [14]. This, however, comes with increased complexity and cost of the optical elements. A different and simpler approach, suited for moderate frequencies, has also been recently demonstrated [13]. It consists in performing quadrature lock-in discrimination (QLD) [15] computationally to obtain real-time demodulation of images. By multiply-and-accumulate operation on each image as it is acquired, the need for storing a series of images is eliminated. By multiplying by the two quadratures of the modulation, the need for phase matching between the source and receiver is obviated. Exploiting the task and data parallelization capabilities of present-day desktop computers, this technique has been shown to lead to real-time display of 600 × 600 pixel images with low latency and at rates faster than the eye bandwidth. However, till now, this technique has been applied only in table-top experiments where suspensions of microspheres were used as the scattering medium. The aim of the present paper is to test this technique in actual field conditions in real fog.
2. Principle of QLD
The principle of QLD is schematized in Fig.1. We start from a source whose intensity is modulated at angular frequency Ω. After propagation in the scattering medium, a series of frames are acquired by the camera at a rate much larger than Ω/2π and transferred in real time to a computer. The computer multiplies two copies of each frame by two sinusoidal signals at frequency Ω, which are in quadrature one to the other. After time averaging and addition, this allows the retrieval of the amplitude of the modulated part of the intensity that falls on each pixel and eliminates the DC background that blurs the original raw frames. Thanks to the fact that the modulation at Ω is imprinted only on the light emitted by the modulated beacon, this technique permits the reduction of the noise in the acquired frames that comes from background light.
However, the modulation frequency is too low to allow to filter out the part of the modulated light which is multiply scattered [16]. Thus, this technique does not perform a real selection of ballistic photons only.
Fig. 1. Principle of quadrature lock-in discrimination.
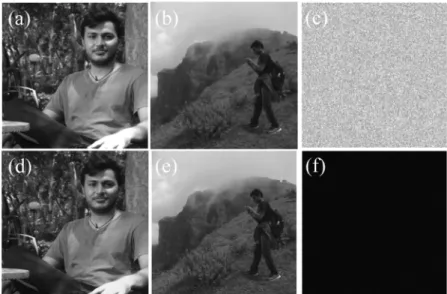
We give a simulation of this principle. We begin with two different 8-bit images (see Figs.2(a,b)). We sinusoidally modulate the first image at Ω/2π= 13 Hz and the second image at Ω/2π= 17 Hz. To obtain entire numbers of period, we need at least 13 × 17 = 221 frames. We then multiply this number of frames by 5 to increase the number of frames, leading to a total number of 5 × 13 × 17= 1105 frames for each image. An offset of 255 is added to every frame pixel in order to make all the values positive. The frames of the two series are then added. Finally, we mimic the noise by adding to every pixel of every frame a random number uniformly distributed between 0 and 5 × 255= 1275. This represents the raw frames that a camera would record when simultaneously viewing the two differently intensity modulated sources through a randomly scattering medium. One such simulated raw frame is shown in Fig.2(c). Clearly,
Fig. 2. (a) Image to be modulated at 13 Hz. (b) Image to be modulated at 17 Hz. (c) One of the frames of the mixed image after addition of noise. Original images are not visible at all. The retrieval of original image is done from 1105 such frames. (d) Image obtained upon demodulation at 13 Hz. (e) Image obtained upon demodulation at 17 Hz. (f) Image obtained upon demodulation at 14 Hz.
neither of the original images of Figs.2(a) and2(b) is visible. We then apply QLD in order to retrieve the original images from the series of raw frames. The results of processing at 13 Hz, 17 Hz and 14 Hz are shown in Figs.2(d-f), respectively. The original images are retrieved, with the added noise being filtered out when processed at the "correct" frequency. On the other hand, QLD performed at a “wrong” frequency reveals neither image.
3. Field experiments
3.1. Application of QLD to a modulated beacon
To test the efficiency of QLD in real fog, we performed field experiments as schematized in Fig.3, over a period of two months during peak winter at Shiv Nadar University, Uttar Pradesh. A LED panel, consisting of 10 uncollimated LEDs connected in parallel on a 10 cm x 16 cm standard printed circuit board, emitting typically 1 Watt each in the red (around 640 nm), was used as the source of light. Several factors, apart from the ease of availability of LEDs, contributed to this choice of wavelength. Red light is conventionally used to signify danger, and most warning lights are in this colour. Further, the Rayleigh scattering of light is proportional to the inverse fourth power of wavelength, and therefore the red part of the spectrum should be preferred over the blue. Finally, most cameras have the highest sensitivity in this part of the spectrum. The entire bunch of LEDs were so closely spaced that they could not be individually resolved at the camera, and thus appeared as a single bright source. The current through the LEDs was modulated (peak-to-peak modulation amplitude equal to 30 % of the average current) so that the intensity of the emitted light could be varied sinusoidally at any frequency in the range 13 -17 Hz. The detector used was a 16-bit Andor Neo sCMOS camera, controlled by Andor Solis
software, with a 8-48 mm F/1-1.2 zoom lens from Ernitec. In the conditions of our acquisitions, the actual pixel dynamic of the camera is 13.4 bits, obtained from the ratio of the pixel well depth (30000 electrons) to the RMS read noise (2.8 electron according to the manufacturer). Series of frames of the scene at the desired frame rates were acquired and transferred to a desktop computer where they were processed for the extraction of images using the QLD technique. The distance between the source and the detector was 150 meters. We used natural features of the scene to evaluate visibilities, which during our acquisitions, ranged between 30 to 150 m.
In Fig.4we describe a set of recordings made when the source was modulated at 13 Hz. Each data set was based on the acquisition of a total of 10,140 frames collected at rates of 260 or 390 Hz, and with exposure times per frame ranging from 0.5 ms to 5 ms depending on the weather condition. A raw frame recorded in one of the experiments is shown in false color in Fig.4(a). Although this frame was acquired at day-break, the LED panel, located at a distance of 150 m, is not visible because of the heavy fog conditions with visibility of 40 m. This frame is re-plotted in Fig.4(b) with a different color scale corresponding to a scale enhancement by a factor 850. The LED panel is still almost impossible to distinguish. After QLD processing of 10,140 such raw frames, we obtain the result reproduced in Fig.4(c), where, in contrast to Figs.4(a,b), one can now clearly see the LED panel at the centre. Figure4(d) shows the image obtained upon averaging the 10140 raw frames, without QLD processing. The source is not visible in this case.
In order to gain a more quantitative picture of the improvement of the image quality obtained using QLD, we measure the Contrast-to-Noise Ratio (CNR), defined as :
CNR= ⟨Iobj⟩ − ⟨Iback⟩ ⟨︂
(︁Ijk− ⟨Iback⟩)︁2 ⟩︂1/2
back
. (1)
In this expression, ⟨Iobj⟩ is the average value of the signal over the pixels covering the modulated source. In the case of Fig.4, it corresponds to the 3 × 3 pixels surrounded by the red rectangle. The quantity ⟨Iback⟩ is the average of the signal recorded in the background surrounding the
Fig. 3. (a) Schematic of the experiment performed. The red curved arrows indicate the location of the camera in the building in the foreground, and the LED panel fixed on the building at the background. The distance between the two is 150 m; the orange full line indicates the clear line-of-sight between them. (b) An image of a portion of the building housing the LED panel, as captured at daybreak, in the absence of fog. The portion circled in yellow is enlarged and shown in (c); this is further enlarged and shown in (d). The processed images appearing in later figures may be compared with (d).
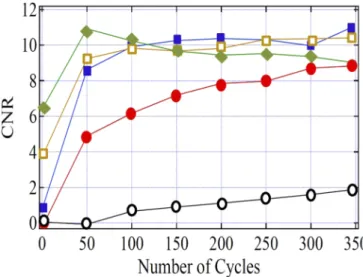
object. In Fig.4, it corresponds to the 8 blocks of 3 × 3 pixels contained in the white rectangle. In the denominator, the averaging is taken over the same i, j pixels belonging to the surrounding background, so that this denominator is the square root of the variance of the background noise. For the data of Fig.4(visibility 40 m) QLD applied to images acquired at a distance of 150 m from the source permits to increase the CNR from 2.3 to 11. In Fig.5, we plot the evolution of the CNR as a function of the number of cycles over which QLD averaging is performed. The results in this figure, obtained in five sets of experiments performed at day-break for visibilities ranging from 40 to 60 m, show that the CNR can be significantly increased using the technique of QLD. Four of them permit to reach a value of the CNR larger than 8, typically with the number of periods needed to optimize the CNR being of the order of 100. While the general trend for all data sets is the same, variations exist. For example, the curves shown in full circles and in full squares, both of which are for a visibility of 40 m, are different. This may be attributed to the somewhat different nature of the fog on the two days the data was taken, or to possible variations of the ambient illumination. It is well known that fog can have droplets with sizes ranging from sub-micrometer to several micrometers [17], and thus the scattering can vary from being isotropic to significantly anisotropic (forward scattering), leading to a difference in the efficiency of the QLD technique. This effect is more pronounced in the curve with open circles in Fig.5, which is quite different from the other four : the CNR is initially close to zero, and increases very slowly
Fig. 4. Examples of raw and QLD-processed images acquired at day-break with a visibility of 40 m. (a) One full-scale raw frame (CNR= 2.3, 1 ms exposure time). (b) Same as (a) for a reduced color scale. (c) Corresponding processed image obtained from 10140 raw frames acquired at 390 frames per second. CNR is now equal to 11.0 (d) The image obtained by averaging all 10140 raw frames. The source is not seen, the CNR is 2.5. The red and the white squares in the figures represent the "object" and the "background" regions defined after Eq. (1).
as a function of the number of modulation cycles over which QLD is performed, reaching a modest value of 1.9 even when all the available data are processed. Though this set of data was not obtained for a visibility significantly lower than the other sets of data, the nature of fog varied during observation. The wind was relatively strong then, and fog trails could be seen passing across the scene, indicating that the density and diameter of the water droplets was changing with time during the acquisition time, thus leading to the different results for seemingly identical conditions. It is also quite possible that these variations in the fog during acquisition explains why, in the case of the data represented as full diamonds, the CNR slowly decreases when the number of cycles is increased above 100.
3.2. Application of QLD to an illuminated object
We have, so far, focused on imaging light beacons through fog using the technique of QLD. We now investigate whether this method can be used under foggy conditions to enhance the visibility of an object that is illuminated by the modulated source of light, rather than the source of light itself. The data presented in Fig.6were obtained at day-break by illuminating using the modulated LED panel, a piece of cardboard located on the right of the picture. The distance between the LED panel and the illuminated cardboard was about 20 cm. The distance between this object and the camera was 75 m while the visibility through fog was estimated at about 30 m. In the raw frame of Fig.6(a) the object cannot be distinguished; the associated CNR, equal to 0.3, is indeed quite low. However, after QLD processing of 10,400 such frames acquired at a rate of 160 images per second, the image of Fig.6(b) was obtained, where the object illuminated
Fig. 5. Evolution of the CNR as a function of the number of processed modulation cycles. Modulation frequency= 13 Hz; 390 frames per second. Full circles: 40 m visibility; 1 ms exposure time. Full squares: 40 m visibility; 1 ms exposure time. Full diamonds: 50 m visibility; 2 ms exposure time. Open circles: 60 m visibility; 1 ms exposure time. Open squares: 60 m visibility; 0.5 ms exposure time.
by the LED panel can be clearly distinguished from the noisy background, with a CNR of 1.9. Notice that in the present experiment the QLD technique works at low modulation frequencies because the modulated light source is close to the illuminated object. Making it to work with the modulated light source close to the camera and thus far from the object would probably require much higher frequencies or even pulsed illumination.
Fig. 6. Examples of raw and QLD-processed images acquired at day-break with a visibility of 30 m. The red rectangle shows the position of the piece of cardboard that is illuminated by the light of modulated LED panel. (a) One full-scale raw frame (5 ms exposure time). (b) Corresponding processed image obtained from 10,400 raw frames acquired at 160 frames per second. The modulation frequency is 16 Hz.
3.3. QLD imaging in daylight condition
The preceding results of Figs.4,5, and6were obtained at day-break, when the LED panel was much brighter than the ambient light. We now show that QLD can also be useful in distinguishing a modulated beacon or an object illuminated by a modulated source, from surrounding sources
of light, especially during day time when many objects can reflect the sun light and blind the observer. Figure7illustrates this capability, using a similar setup as in Fig.6, but obtained during day time fog. Here, only a cardboard piece is illuminated by the modulated light provided by the LED panel. Close to it, but shielded from the modulated source, is a polystyrene block that strongly scatters sunlight towards the camera. Both objects, the cardboard and the polystyrene block, are 150 m from the camera, and are viewed through fog during daylight. In Fig.7(a), the parasitic sunlight reflection is clearly visible, while the illuminated cardboard is impossible to distinguish, as confirmed by a CNR measured to be equal to −0.3 for this image. This image also exhibits vague shapes in the foreground due to intervening trees. After QLD processing (see Fig.7(b)), all these spurious shining objects disappear, and we are left with a clearly visible image of the piece of cardboard illuminated by the LED panel, with a CNR which is now equal to 2.4.
Fig. 7. Examples of raw and QLD-processed images acquired during day time. The red rectangle shows the position of the piece of cardboard that is illuminated by the modulated LED panel. (a) One full-scale raw frame (5 ms exposure time), showing reflection of sunlight from a polystyrene object located close to the LED panel (b) Corresponding processed image obtained from 10,400 raw frames acquired at 160 frames per second. The modulation frequency is 16 Hz.
4. Conclusion
In conclusion, we have shown that computational QLD processing of images obtained using a modulated LED source is a powerful tool, compatible with real-time processing, which could be very useful for many applications. The fact that such imaging can be performed by illumiating with simple LEDs and processing on an ordinary computer shows that it can potentially be implemented at low cost, which further paves the way to a broad range of applications. In particular, this technique has been proven to be efficient in improving the visibility of beacons under heavy fog conditions, particularly at night, a situation that is commonly encountered during plane landing and takeoff. Moreover, we have shown that it is also capable of imaging a reflecting or diffusive object which is illuminated by the modulated source of light. Thus, in the context of aircraft navigation, unlike modern instrument landing systems that merely guide an aircraft using radio waves, the QLD technique can provide the pilot a visual image of the scene that lies ahead, and in particular a realistic representation of the runway beacons. In motor, rail or maritime navigation, apart from showing the path by means of beacons, the technique may be used to reveal obstacles in the path, that are otherwise hidden by fog. The technique is particularly interesting if one wants to be able to steer the direction of emission of the modulated light, like in the case of a lighthouse, whose range could thus be extended in heavy fog conditions. Finally, we have shown that source modulation and QLD also proves to be interesting in the presence of daylight, because
it permits one to distinguish the beacon or object of interest from any surrounding source of light that could dazzle the observer.
Finally, it is worth mentioning that an important perspective of the present work, in the context of above mentioned application, consists in assessing its validity in the case of moving targets. Funding.Centre National de la Recherche Scientifique (International Emerging Action project "HINDI-BIO"); Department of Science and Technology, Ministry of Science and Technology, India; Indo-French Centre for the Promotion of Advanced Research.
Acknowledgment.The authors are happy to thank Prof. Rupamanjari Ghosh for having made the experiments possible at Shiv Nadar University. FB acknowledges the hospitality of Raman Research Institute.
Disclosures.The authors declare no conflicts of interest.
Data availability.Data underlying the results presented in this paper are not publicly available at this time but may be obtained from the authors upon reasonable request.
References
1. M. I. Anwar and A. Khosla, “Vision enhancement through single image fog removal,”Int. J. Eng. Sci. Technol.20(3), 1075–1083 (2017).
2. H. Ramachandran, “Imaging through turbid media,” Curr. Sc. 76(10), 1334–1340 (1999).
3. C. Dunsby and P. M. W. French, “Techniques for depth-resolved imaging throug turbid media including coherence-gated imaging,”J. Phys. D: Appl. Phys.36(14), R207–R227 (2003).
4. O. David, N. S. Kopeika, and B. Weizer, “Range gated active night vision system for automobiles,”Appl. Opt.45(28), 7248–7254 (2006).
5. A. V. Kanaev, A. T. Watnik, D. F. Gardner, C. Metzler, K. P. Judd, P. Lebow, K. M. Novak, and J. R. Lindle, “Imaging through extreme scattering in extended dynamic media,”Opt. Lett.43(13), 3088–3091 (2018).
6. G. Satat, M. Tancik, and R. Raskar, “Towards photography through realistic fog,” in IEEE International Conference
on Computational Photography(IEEE, 2018).
7. S. Popoff, G. Lerosey, M. Fink, A. C. Boccara, and S. Gigan, “Image transmission through an opaque material,”Nat. Commun.1(1), 81 (2010).
8. O. Katz, E. Small, and Y. Silberberg, “Looking around corners and through thin turbid layers in real time with scattered incoherent light,”Nat. Photonics6(8), 549–553 (2012).
9. J. Bertolotti, E. G. van Putten, C. Blum, A. Lagendijk, W. L. Vos, and A. P. Mosk, “Non-invasive imaging through opaque scattering layers,”Nature491(7423), 232–234 (2012).
10. S. Panigrahi, J. Fade, H. Ramachandran, and M. Alouini, “Theoretical optimal modulation frequencies for scattering parameter estimation and ballistic photon filtering in diffusing media,”Opt. Express24(14), 16066–16083 (2016). 11. O. Emile, F. Bretenaker, and A. Le Floch, “Rotating polarization imaging in turbid media,”Opt. Lett.21(20),
1706–1708 (1996).
12. H. Ramachandran and A. Narayanan, “Two-dimensional imaging through turbid media using a continuous wave light source,”Opt. Commun.154(5-6), 255–260 (1998).
13. S. Sudarsanam, J. Mathew, S. Panigrahi, J. Fade, M. Alouini, and H. Ramachandran, “Real-time imaging through strongly scattering media: seeing through turbid media, instantly,”Sci. Rep.6(1), 25033 (2016).
14. S. Panigrahi, J. Fade, R. Agaisse, H. Ramachandran, and M. Alouini, “An all-optical technique enables instantaneous single-shot demodulation of images at high frequency,”Nat. Commun.11(1), 549 (2020).
15. L. Mullen, A. Laux, and B. Cochenour, “Demodulation techniques for the amplitude modulated laser imager,”Appl. Opt.46(30), 7374–7383 (2007).
16. L. Mullen, A. Laux, B. Cochenour, E. P. Zege, I. L. Katsev, and A. S. Prikhach, “Propagation of modulated light in water: implications for imaging and communications systems,”Appl. Opt.48(14), 2607–2612 (2009).
17. J. Allen Zak, “Drop size distributions and related properties of fog for five locations measured from aircraft,” NASA Technical Reports Server,https://ntrs.nasa.gov/search.jsp?R=19940028559(1994).