HAL Id: hal-02155443
https://hal.archives-ouvertes.fr/hal-02155443
Submitted on 14 Oct 2019HAL is a multi-disciplinary open access archive for the deposit and dissemination of sci-entific research documents, whether they are pub-lished or not. The documents may come from teaching and research institutions in France or abroad, or from public or private research centers.
L’archive ouverte pluridisciplinaire HAL, est destinée au dépôt et à la diffusion de documents scientifiques de niveau recherche, publiés ou non, émanant des établissements d’enseignement et de recherche français ou étrangers, des laboratoires publics ou privés.
Comprehensive Thermodynamic Study of the Calcium
Sulfate–Water Vapor System. Part 2: Physical Modeling
of Adsorption Phenomena
João G. D. Preturlan, Loïc Favergeon, Laetitia Vieille, Sara Quiligotti
To cite this version:
João G. D. Preturlan, Loïc Favergeon, Laetitia Vieille, Sara Quiligotti. Comprehensive Thermody-namic Study of the Calcium Sulfate–Water Vapor System. Part 2: Physical Modeling of Adsorption Phenomena. Industrial and engineering chemistry research, American Chemical Society, 2019, 58 (22), pp.9607à 9616. �10.1021/acs.iecr.9b00857�. �hal-02155443�
Comprehensive thermodynamic study of the calcium
sulfate-water vapor system. Part 2: Physical
modeling of adsorption phenomena.
João G. D. Preturlan±,†, Loïc Favergeon±,*, Laetitia Vieille±, Sara Quiligotti†
±Mines Etienne, Univ Lyon, CNRS, UMR 5307 LGF, Centre SPIN, F - 42023
Saint-Etienne France
†Saint-Gobain Research Paris, 39 quai Lucien Lefranc, F-93000 Aubervilliers France
ABSTRACT
The calcium sulfate-water vapor system is extremely relevant for a vast number scientific and
industrial applications. Although the vast number of studies about this chemical system, some
critical thermodynamic aspects seem to have been left aside. In this context, in the first part of this
study, we investigated the thermodynamic equilibrium between two calcium sulfate polymorphs
(AIII-CaSO% and CaSO%⋅ 0.5 H,O) and quantified the water vapor adsorption as a function of the temperature and water vapor partial pressure. In this second part, we employ a rigorous modeling
approach to determine the thermodynamic nature of the water adsorption phenomena on these two
polymorphs. We developed macroscopic solution models (ideal and non-ideal) for modeling
monolayer adsorption on AIII-CaSO%. This allowed the calculation of the energies of adsorption for this phenomenon, evidencing a physisorption mechanism. For the β-CaSO% ⋅ 0.5 H,O, we interpreted the water adsorption using a multilayer adsorption model. For both materials, we
showed that nitrogen adsorption data was not sufficient to represent their entire surface areas and
porosity profiles compared to the water vapor sorption capacity of these materials.
KEYWORDS
1. Introduction
In the first part of this study, we reported an experimental study about the interaction between
calcium sulfate polymorphs soluble anhydrite (AIII-CaSO%) and calcium sulfate β-hemihydrate
(β-CaSO%⋅ 0.5H,O), both obtained from the dehydration of synthetic gypsum (CaSO%⋅ 2H,O), and water vapor at atmospheric pressure. The equilibrium conditions between AIII-CaSO% and β-CaSO%⋅ 0.5H,O in the presence of water vapor were confirmed and compared to available data in the literature. This equilibrium was also confirmed to be univariant. By thermogravimetric analysis
under controlled temperature (T) and water vapor partial pressure (P123), we were also able to observe that compounds of the form CaSO%⋅ εH,O would show two bivariant zones as recalled in Figure 1. These two bivariant zones, a lower one (for 0 ≤ ε ≤ 0.15) and an upper one (for ε ≥ 0.5), were interpreted as caused by water adsorption on AIII-CaSO% and β-CaSO%⋅ 0.5H,O, respectively. We observed that the extent of the water adsorption phenomena can be reasonably
considerable when compared to the crystalline water content of both phases depending on the P123 values. The lack of knowledge regarding these variations in water content could create
uncertainties when manipulating or quantifying calcium sulfate based materials.
This second part of this study aims to analyze the nature of the water adsorption on each
previously studied phase, AIII-CaSO% and β-CaSO%⋅ 0.5H,O, and to propose a physical interpretation for this phenomenon. For this, we plotted adsorption isotherms corresponding to
each bivariant zone in Figure 1, and we compared the experimental data with thermodynamic
Figure 1. Isobars showing the overall water content ε of the calcium sulfate compounds as a function of the temperature (T) for fixed water vapor partial pressure (P123) values putting in evidence two bivariant zones (upper and lower) and a univariant transition zone (in the middle)
(Shown in the first part of this study).1
2. Thermodynamic models
Before analyzing the water adsorption phenomenon responsible for the bivariant behavior
observed in the upper and lower bivariant zones in Figure 1, it is convenient to recall some
principles. First of all, we consider the model for water vapor adsorption for which the gas
molecules adsorb locally on identical points on the surface (adsorption sites) with no mobility
within the adsorbed phase. That is, once the adsorbed molecule is fixed on an adsorption site, the
surface of the solid becomes a network of free and occupied adsorption sites. At maximum surface
coverage, all the adsorption sites are occupied forming a monomolecular layer. Everett also adds
that considering the number of available adsorption sites to be independent of the temperature was
In this context, adsorption behaves like a surface solution of free and occupied adsorption sites
for which the equilibrium equation writes4
S + G(;)⇌ SG(>?@), (1)
where S represents the free adsorption sites, G(;) the adsorbate in the surrounding gas phase, and SG(>?@) the occupied adsorption sites. This equilibrium can be treated by a macroscopic solution
model and the law of mass action for the equilibrium in (1 writes as follows
KCD= xGHγGH
xGγGP (2)
where xJ and γJ represent the molar fraction and the activity coefficient of the species i. The parameter P takes account of the pressure, and it is given by the ratio P = PH⁄ , where PP° H is the
gas G partial pressure and P° is standard reference pressure (taken as the unit pressure).
This expression is usually simplified by the introduction of the surface coverage fraction θ. This parameter is given by the ratio between the concentration of occupied adsorption sites and the total
concentration of adsorption sites. Therefore, the molar fractions in (2 can be expressed as xGH= θ and xG = 1 − θ. Furthermore, for a first approximation, we consider the surface solution to be
ideal. This approximation is often interpreted as the case for which there is no interaction between
occupied adsorption sites. However, to be precise, this approximation assumes that interactions
between occupied and free adsorption sites are identical to the interaction between two occupied
adsorption sites. As a consequence, the activity coefficients are γGH= γG = 1 and (2 simplifies to the following expression where the pressure term P is homographic to the surface coverage
θ = KPP
1 + KPP (3)
This expression is similar to the well-known Langmuir isotherm equation used to interpret type
referred to as the BDDT or Brunauer classification, which was standardized by the IUPAC.5 For
this reason, we replace the general equilibrium constant KCD by KP. The adsorption equilibrium constant KP can then be written as follows
KP(T) = KQexp T−E>?@
RTW (4)
where R stands for the gas constant, KQ represents a pre-exponential constant and E>?@ accounts for the energy of adsorption. As an alternative, Everett considers this equilibrium constant as
depending on the change in enthalpy and entropy of adsorption.2,5 For this case, the energy of
adsorption would correspond to the change in enthalpy of adsorption ΔQ>H, and the parameter K Q
would be a function of the change in entropy of adsorption Δ>QS. According to this approximation,
these two parameters change with the surface coverage except for an assumption of an ideal surface
solution and identical adsorption sites.6
Considering that surface coverage θ can also be defined as the ratio between the adsorbed molar quantity n> per moles of solid and the monolayer capacity nZ per moles of solid, (3 can be rewritten as
n>
nZ =
KPP
1 + KPP (5) which is usually employed in its linear form
P n> = 1 KPnZ+ P nZ (6)
These forms are useful to treat adsorption data because they allow the quick estimation of the
energy of adsorption by using (4 from the fitted values of KP(T). The surface area S[ of the solid in m,⁄ is also easily assessed from the fitted values of monolayer capacity ng
Z and by considering
S[ =
nZσN`a
M@ (7)
where N`a is the Avogadro’s number and M@ the molar mass of the solid.
Nevertheless, it is important to highlight that the physical meaning of the parameter nZ has to be considered with a degree of caution. This parameter was classically considered as a limiting
adsorption uptake quantity due to a monolayer filling mechanism for type I isotherms. However,
Rouquerol et al.5 and Gregg and Sing.7 discuss that in this context this value should preferentially
be considered as a saturation capacity of the adsorbent due mostly to a micropore filling
mechanism within pores that are accessible by the molecules of the adsorbate rather than the classic
monolayer filling mechanism.
To address the issue of non-ideality of the surface solution into account and evaluate the validity
of this hypothesis for the experimental data, we need a macroscopic solution model allowing the
mathematical representation of the activity coefficients of surface solution species S and SG(>?@)
in (2. When the shift from ideal behavior is not large, it is reasonable to consider the approximation
of regular solutions. Hence, the activity coefficients of each component of the surface solution can
be expressed by the second-order Margules activity model as follows4,8,9
ln γG = B(T)xGH, = B(T)θ, (8)
ln γGH = B(T)xG, = B(T)(1 − θ), (9)
where B(T) is a parameter that depends on the temperature and the intermolecular lateral interactions within the solution. Using a microscopic approach from statistical physics, the
coefficient B(T) of regular solutions is typically represented by4
B(T) =α
T (10)
Substituting (8 and (9 in (2 gives the following expression:
KfGP = θ
1 − θexp[B(T)(1 − 2θ)] (11)
where KCD was replaced by KfG (for the regular solution approximation) and the surface coverage is also given by θ = ij
ik. This equation is also known as the Fowler-Guggenheim adsorption
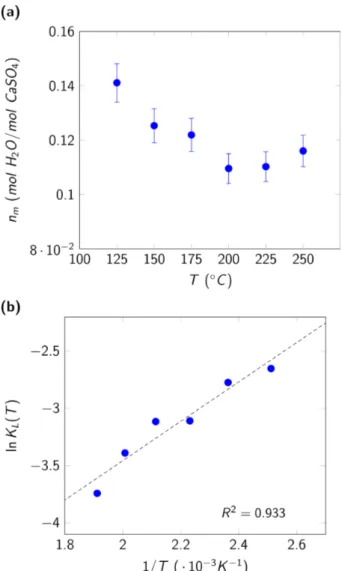
isotherm model. For this model, if B = 0, we obtain the Langmuir adsorption model. For non-ideal solutions, the parameter B needs to be less than 2, otherwise, if B ≥ 2, there is phase separation or no solution is formed at equilibrium (demixing case). Figure 2 shows a representation of adsorption
isotherms for these different values of the parameter B. For B ≥ 2 we observe that the same pressure P123 show more than one θ value. This behavior has no physical meaning and indicates the case of solution demixing, as highlighted in zones D1 and D2.8–11
Figure 2. Water adsorption isotherms showing the evolution of the isotherm profile according to
the value of the parameter B. Zones D1 and D2 indicate the cases for B > 2 in which there is demixing of the non-ideal solution.
The choice for the Margules activity coefficient model to express the non-ideality of the surface
solution came from the use of the regular solution approach. As previously mentioned, this
does not differ much from the ideal one. However, there are many other more sophisticated and
complicated activity coefficient models for liquid-vapor equilibrium (Redlich-Kister, Van Laar,
NRTL, etc.) that can be used depending on the complexity of the system.12 Activity coefficients
have also been expressed by temperature independent polynomial factors.13,14
Both models presented by (3 and (11 correspond to localized adsorption for which we consider
the hypothesis of theoretical monolayer adsorption. These models are not adapted to represent
adsorption isotherm profiles as for type II and type IV isotherms, which are normally interpreted
as being produced by a multilayer adsorption mechanism for non-porous and mesoporous
materials, respectively. For isotherms with these profiles, the Brunauer-Emmett-Teller (BET)
theory for multilayer adsorption can then be employed to fit the adsorption curve and derive the
BET area of the sample for each temperature condition.15 The BET equation is then given by the
following expression 1 n>(1/Pn− 1)= 1 nZCopq+ Copq− 1 nZCopq Pn (12)
where Pn stands for the relative pressure (or relative humidity RH) and is given by the ratio
PH⁄PH@>r(T) (PH@>r(T) stands for the saturation pressure of the adsorbing gas for the isotherm
temperature T). The coefficient Copq is the BET parameter, and it is defined as an energetic term as follows
Copq = exp s
−tE>?@,u− Evw
RT x (13)
where E>?@,u is the energy of adsorption of the first layer of adsorbed gas molecules, and Ev is the liquefaction energy for this adsorbed gas.
In rare cases, the adsorption isotherms profile is the product of only one type of adsorption
different types. For example, type II or type IV can commonly be associated with type I isotherms.
This association means mean that pores with different size ranges are present within the analyzed
sample. For instance, micropores could be present along with mesopores and macropores. For
these cases, we observe the appearance of a classic “knee” in the isotherm profile indicating the
filling of micropores (type I) before a change in concavity due to multilayer adsorption (type II or
IV). The BET theory is typically applied for purely type II or type IV isotherms for the relative
pressure range of 0.05 ≤ Pn ≤ 0.30 and normally reaches its limitations for microporous materials. This would restrain the use of this theory to estimate the BET area of association of
isotherms. However, some authors argued that this method can still give representative information
about the pores and surface of the sample. Mooney et al. argued about the use of the BET theory
to model combined type I and type II water vapor adsorption isotherms as long as the usual
requirements (relative pressure ranges) are fulfilled.16,17 According to the criteria published by
Llewellyn et al., we are still able to consider the BET area as a “BET strong retention capacity” or
“saturation capacity” of the material if two criteria are respected: (i) the value of Copq must be positive for the range of points chosen for the calculation and (ii) the term n>tP1@>r23− P
123w must
continuously increase (self-consistency criterion).18
The described methods were applied to interpret the adsorption phenomenon for AIII-CaSO% and β-CaSO%⋅ 0.5H,O. We chose isotherms for six temperature values in each bivariant zone in Figure 1 to analyze the nature of this phenomenon and have a broad description of each zone instead of
working with adsorption at only one temperature as most of the studies aiming only at calculating
specific surface areas.
3.1. Thermodynamic modeling of water adsorption on soluble anhydrite. The profiles of the
adsorption isotherms for the AIII-CaSO% corresponding to the lower bivariant zone (0 < ε < 0.15) in Figure 1 are shown in Figure 5 for six temperature values. These values were chosen to provide
a relatively broad description of this bivariant zone. The isotherm profiles are analogous to
homographic curves presenting a saturation plateau. This corresponds to type I isotherms
according to the BDDT classification. Therefore, we initially evaluated the hypothesis of localized
monolayer adsorption with ideal behavior. This case is represented by the Langmuir adsorption
model shown by (3. The quantity of water ε is considered to correspond entirely to adsorbed water because the sample is constituted of the anhydrous crystalline phase AIII-CaSO%. Therefore, we
take ε = n> for this data set.
Figure 3 shows the linear transform of the adsorbed quantity values and the fitted curves obtained
by using (6. These linear transforms were used to fit the values of nZ and KP shown in Table 1
and Figure 4. Overall, the localized monolayer ideal adsorption model represents the experimental
data points and their trends with more dispersion between experimental and fitted values for higher
temperatures. To better evaluate the overall validity of the assumptions taken into account by this
model, we analyzed the values of the fitting parameters nZ and KCD and the adsorption isotherms plotted in Figure 5.
Figure 3. Langmuir linear transformation of the adsorption isotherms compared to the
experimental points. The fitted curves represented by the dashed lines are used to calculate the
parameters nZ and KP.
Table 1. Fitting parameters for the localized monolayer ideal adsorption hypothesis (Langmuir
adsorption).
T (℃) KP nZ (mol H,O mol CaSO⁄ %) S[(H,O) (g m⁄ ,)
125 70.6 0.141 ± 0.007 78 ± 4 150 62.5 0.125 ± 0.006 69 ± 3 175 44.7 0.122 ± 0.006 68 ± 3 200 44.4 0.109 ± 0.005 60 ± 3 225 33.8 0.110 ± 0.005 61 ± 3 250 23.7 0.116 ± 0.005 64 ± 3
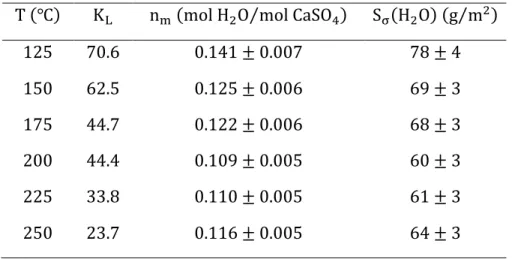
The fitting parameter nZ is listed in Table 1 and plotted in Figure 4(a) as a function of the temperature. We observe a sensible decreasing trend for this parameter with stabilization between
200℃ and 250℃. As previously mentioned, this parameter is usually assumed to be constant or independent of the temperature. Therefore, the variation observed for this parameter can perhaps
be associated with the non-ideality of the surface solution (presence of interactions between
molecules) or due to surface heterogeneities. The non-ideality effect is further evaluated. The
monolayer capacity can be used to estimate specific surface area values ranging from S[(H,O) =
(78 ± 4) m,/g to S
[(H,O) = (60 ± 3) m,/g (considering an average cross-sectional area for the
water molecule19 of σ = 0.125 nm, and molar mass of anhydrous CaSO
% as 136.14 g mol⁄ ). We
can estimate an average surface area of Sƒƒƒƒƒƒƒƒƒƒƒ = (66 ± 5) m[(H,O) ,/g. These surface area
measurements can be compared to measurements obtained by nitrogen adsorption data and
calculations performed using the BET theory. Figure S2 in the supporting information file shows
the results of nitrogen adsorption and desorption isotherms obtained at 77K for one sample after dehydration at 200℃. As the isotherm presents a type II profile with an almost negligible hysteresis loop, we calculate the nitrogen BET area of the material as corresponding to
Sopq(N,) = (14 ± 1) m,/g (Copq = 63). This value is almost 5 times inferior to the average
value obtained from water vapor adsorption data. This difference can be associated with the fact
that nitrogen might not access to the entire pore network because of its larger molecular size when
compared to water vapor. Nitrogen molecules are considered to have a cross-sectional area of
0.162 nm,, which is reasonably more significant than the water molecules cross-sectional area of
0.125 nm,. Therefore, water molecules would more easily gain access to micropores with reduced
dimensions (such as the supermicropores with a pore diameter between 2 and 0.7 nm) in contrast to nitrogen molecules.20 This different behavior of the material in the presence of water compared
to the nitrogen is also sustainable considering the t-plot curve for the nitrogen adsorption data. The
nitrogen adsorption results are indeed characteristic of non-porous materials and, as a
consequence, they do not show the same textural properties as the water vapor adsorption data,
which indicate the behavior of a microporous material. Furthermore, this kind of discrepancy in
adsorption results obtained by different gases has been observed several times in the literature.
Other authors such as Hagymassy et al.21, Mooney et al.16,17, Médout-Marère et al.22, and Salles et
al.23 have shown that porous materials such as concrete, cement, silica, and clays show more
important sorption of water vapor than nitrogen. Gregg and Willing have also shown that during
the decomposition of calcium sulfate dihydrate, different gases (oxygen, nitrogen, CCl%, water, etc.) are adsorbed to different extents for the same material.24–26 As a consequence, the analysis of
the surface area and the porosity by nitrogen adsorption at 77K, techniques that are typically employed and mastered for materials characterization, showed not to be sufficiently adapted to
understand the water adsorption capabilities of AIII-CaSO%. As a complement to the observations in this study, to verify the full porosity range water molecules have access to, it would be
interesting to perform a full adsorption isotherm for water vapor. That is, analyzing the water
adsorption capacity of the materials for a large P123 range, from almost completely dry conditions to near saturation pressure. However, this was not technically feasible using our experimental
apparatus (which is limited to water vapor partial pressures up to 60 hPa) as detailed in the first part of this study.1 Moreover, as phase transition towards CaSO
%⋅ 0.5H,O can take place as the
P123 increases, which would limit a full adsorption spectrum of the AIII-CaSO%. Other interesting
experiments to carry out to elucidate the different accessibility of gases in the pore network of
AIII-CaSO% would be performing systematic adsorption experiments with different gases showing diverse cross-sectional areas and polarity.
Other reason that could explain the observed shift between water and nitrogen uptakes by
adsorption could be that the partial pressure of water vapor can increase locally in pores and thus
induce capillary condensation of water. This phenomenon could produce local hydration reactions
near the surface of the solid and eventually locally hydrate the sample of AIII-CaSO% to CaSO%⋅ 0.5H,O at pore walls increasing the retention capacity of water of the solid. This local effect would be complicated to measure experimentally, but the estimation of pore saturating pressures (based
on pore dimensions) could be compared to the values of P123 and T for phase transition to verify
Figure 4. Fitting parameters nZ and KP for the localized monolayer ideal adsorption model. (a) The monolayer capacity nZ is shown to decrease sensibly with temperature. (b) van’t Hoff plot for the Langmuir adsorption equilibrium constant.
The second fitting parameter KP is presented in the form of a van’t Hoff plot in Figure 4(b). The energy of adsorption was estimated as E>?@ = −16.5 kJ ⋅ mol‡u. As expected for an adsorption
process, E>?@ < 0 (evidencing an exothermic process). Moreover, the low value of |E>?@| <
20 kJ ⋅ mol‡u confirms the hypothesis of a physisorption process as previously considered to
a linear trend with some dispersion. This can be caused by experimental effects combined with, as
previously mentioned, non-ideal effects within the surface solution.
Finally, we chose to use the maximum value of monolayer coverage in Table 1 (i.e., nZ=
0.141 mol H,O mol CaSO⁄ %) to plot the adsorption isotherms and compare these curves as shown in Figure 5. The calculated curves represent the overall trend for each temperature, but with some
shifts. These shifts are evidently produced by the difference between the used monolayer capacity
value and the obtained fitted values for each temperature. To improve the quality of the fit for each
curve, we evaluated the hypothesis of a non-ideal surface solution.
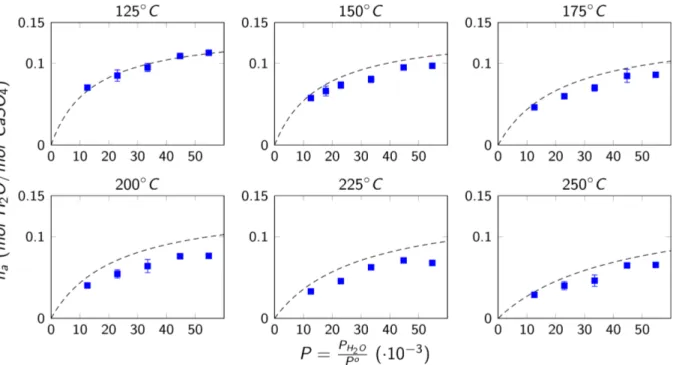
Figure 5. Isotherms for the adsorbed quantity of water n> on AIII-CaSO% for temperatures between
125℃ to 250℃. The results are presented as a function of P (the ratio between the water vapor partial pressure P123 and the reference unit pressure P‰, both in atm). The localized monolayer
ideal adsorption model (dashed lines plotted using the maximum monolayer capacity fitted value)
To address the issue of non-ideality of the surface solution into account and evaluate the validity
of this hypothesis for interpreting the experimental data, we employed a macroscopic solution
model to express the activity coefficients of its components. When the shift from ideal behavior is
not considerably large (as observed in Figure 4 and Figure 5), it is reasonable to consider the
approximation of regular solutions. We employed then the mathematical expression shown by (11,
which is based on the Margules activity model. To evaluate this model for the presented adsorption
isotherms, we considered the number of adsorption sites to be constant and took the maximum
value of monolayer coverage, nZ = 0.141 mol H,O mol CaSO⁄ %, calculated for the ideal surface
solution case. Figure 6 shows the comparison of the calculated surface coverage data plotted with
the fitted curves. Table 2 shows the fitting parameters KfG and B and also the calculated values of α according to (10. Parameters α and KfG are graphically represented in Figure 7.
Initially, we observe that the fitted curves in Figure 6 correspond more adequately to the
experimental points for each temperature value compared to the previous model. Therefore, the
consideration of an additional fitting parameter that takes account of the non-ideality of the surface
solution is suitable for the considered system. This parameter considers the interaction energies
Figure 6. Adsorption isotherms for phase AIII-CaSO% for temperatures between 125℃ to 250℃. The results are presented as a function of P (the ratio between the water vapor partial pressure P123 and the reference unit pressure P‰). The localized monolayer adsorption model combined with the
regular solution approach (dashed-line fitted curves) is compared to the experimental points (blue
squares).
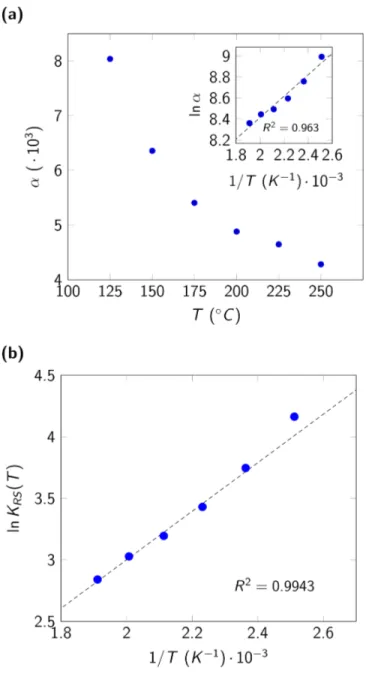
Figure 7(a) shows that the interaction parameter α decreases with increasing temperature. This would indicate that the interaction forces between sites occupied with adsorbed molecules of the
surface solution (and by consequence the shift from ideal behavior) are more important at lower
temperatures. The miniature in Figure 7(a) shows the parameter α in Arrhenius coordinates. Due to the observed linearity, we can propose the following expression for α
α = αQexp T Γ
where Γ is a thermal coefficient and αQ a pre-exponential factor. This expression can be useful if we want to propose a predictive expression for α based on empirical observation (Γ = 8.5 kJ ⋅ mol‡u and ln α
Q = 6.4).
Figure 7(b) shows the van’t Hoff plot for KfG. We observe that the experimental points show
less dispersion than for the ideal surface solution approach. We can also estimate the energy of
adsorption value as E>?@ = −18.0 kJ ⋅ mol‡u. The negative and low value of this energy is
following previous hypotheses of exothermic processes and physisorption. Besides, this value is
not very different compared to the one obtained previously evidencing the small shift in behavior
compared to the ideal surface solution hypothesis. Finally, we recall that the chosen regular
solution model implies phase separation for B(T) > 2. Hence, the fitted values of B(T) shown in Table 1 confirm the thermodynamic feasibility of the surface solution.
Figure 7. Fitting parameters α and KfG for the localized monolayer non-ideal adsorption model:
(a) α as a function of the temperature (miniature: Arrhenius coordinates) and (b) van’t Hoff plot for the fitting parameters KfG for the non-ideal surface solution model.
Overall, the hypothesis of the non-ideal surface solution represented by the regular solution
hypothesis improves the quality of the fitted curves and fitted parameters compared to the ideal
the hypothesis of monolayer adsorption where the heterogeneities within the interactions of the
surface solution components play a part in this phenomenon. Depending on the objective of the
analysis, a predictive equation giving the adsorbed quantity can be proposed to represent the
experimental data in the given range respecting the experimental errors.
Table 2. Fitting parameters for non-ideal surface solution (regular solution approach)
T (℃) KfG B α 125 64.3 2.31 ⋅ 10‡u 8040 150 42.4 9.75 ⋅ 10‡Œ 6360 175 30.9 6.13 ⋅ 10‡Œ 5410 200 24.4 8.96 ⋅ 10‡% 4880 225 20.7 3.46 ⋅ 10‡, 4650 250 17.2 9.03 ⋅ 10‡, 4280
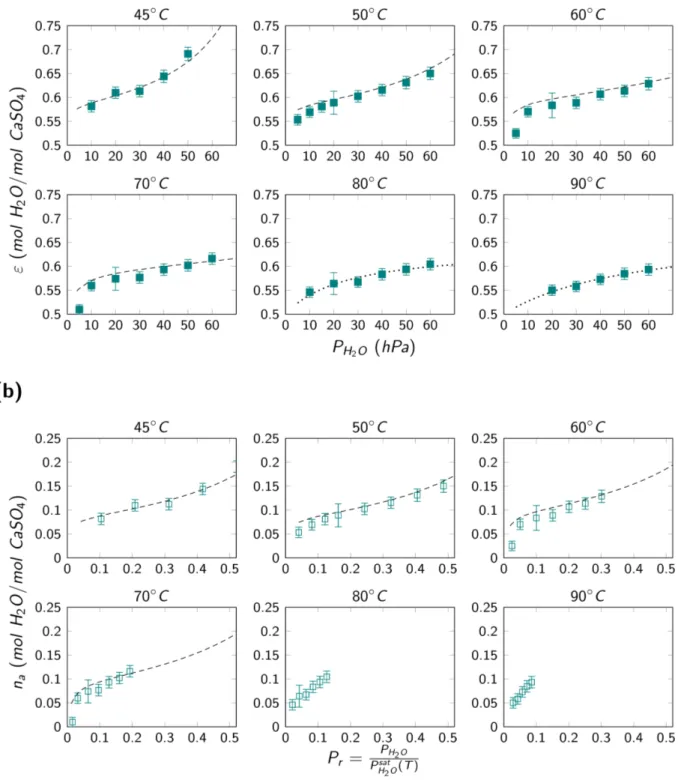
3.2. Thermodynamic modeling of water adsorption on β-hemihydrate. Figure 8(a) shows the isotherms representing the overall water contents for temperature values between 45℃ and 90℃ in the upper bivariant zone in Figure 1. Analogously as the previous section, we used six temperatures values to run through the different possible behaviors of the water vapor adsorption
within the bivariant zone for which ε ≥ 0.5. Two main kinds of profiles can be distinguished. At first, the curves observed for temperature values from 45℃ to 70℃ present a change in concavity and recall the profiles for type II or type IV isotherms according to the BDDT classification. On
the other hand, the curves for 80℃ and 90℃ do not present the same change in concavity and recall a homographic profile of type I (with a saturation plateau).
To analyze this observed behavior, we first consider the group of curves for which the profiles
experimental pressure range (5 to 60 hPa), these isotherms seem to be typical of non-porous or mesoporous materials, corresponding to type II and IV isotherms, respectively. The BET theory
for multilayer adsorption can then be employed to analyze the behavior of this material and derive
the water vapor BET area Sopq(H,O) of the sample for each temperature condition. To apply this equation, we reasoned similarly as for water vapor adsorption on AIII-CaSO%. The overall quantity of water ε measured in the upper bivariant region was considered to have two contributions: one by crystalline water content and the other by the adsorbed water content. For the CaSO%⋅ 0.5H,O,
the crystalline water content is equal to 0.5 mol H,O mol CaSO⁄ %. Therefore, the adsorbed water
content can be expressed as n> = ε − 0.5. We then plotted these experimental values of the
adsorbed water content n> as a function of the relative pressure Pn as shown in Figure 8(b). As expected, we observe that with increasing temperature we reduce the relative pressure interval for
the isotherm (because the saturation pressure value increases systematically). For this reason, for
the lower temperature values, from 45℃ to 70℃, we manage to apply the BET equation (cf. (12). However, for the higher values of temperature, 80℃ and 90℃, the relative pressure interval is too reduced to consolidate the type II or IV behavior of the isotherm and apply the BET equation
accordingly. Figure S4 in the supporting information section shows the BET plots for temperature
values from 45℃ to 70℃ from which we obtained the parameters shown in Table 3. Figure S5 shows the self-consistency plots for this same temperature interval, and they respect the criteria
recalled in the methods section.18 Using these parameters we could trace the BET adsorption
isotherms from 45℃ to 70℃ as shown in Figure 8(a) and Figure 8(b) by the dashed lines. For the temperature values of 80℃ and 90℃, the presented dotted lines in Figure 8(a) are only a guide for the eyes to evidence the different observed profile.
Figure 8. Isotherms for the (a) overall quantity of water of β- CaSO% ⋅ 0.5H,O and (b) adsorbed water contents on β- CaSO%⋅ 0.5H,O for temperatures between 45℃ to 90℃.
Overall, we observe that the BET equation represents well the experimental data for the
temperature values from 45℃ to 70℃. However, we observe a shift between the model and the experimental points for low relative pressure values. We can observe that the experimental curves
present a sharp change in concavity for these low values of Pn (or a “knee”, as usually referred to in the literature) at the beginning of the isotherm, and these profiles are normally associated with
the phenomenon of micropore filling. This effect is more evident for the temperatures from 50℃ to 70℃. This “knee” frequently represents that these isotherms are, in fact, an association of type II or type IV along with a type I isotherm. Usually, the BET theory reaches its physical limits for
microporous materials. However, as the two criteria published by Llewellyn et al.18 were verified,
the nZ parameter and the calculated BET area do present a physical meaning and are suitable to
represent the water retention capacity of the sample for each given temperature value.
We also observe that the calculated value for the monolayer capacity nZ and the BET area values increase with temperature. It ranges from Sopq(H,O) = 46 m,⁄ for 45℃ to Sg opq(H,O) =
61 m,⁄ for 70℃. This would mean that for higher temperatures, more water is required to g
completely fill the pores of the sample. This effect is may be that at higher temperatures the pores
of the material are more available to water adsorption compared to lower temperatures. We also
observed that the Copq parameter decreases with increasing temperature. This would represent that the BET theory less adequately represents the behavior of the system at these temperatures.
Finally, the non-ideality of the adsorbed layer (or surface solution) can also be compensated by
these fitting parameters.
Finally, we notice a similar effect when comparing the water vapor and nitrogen adsorption
phenomena, like the one observed for AIII-CaSO%. Figure S3 in the supporting information document shows the results for one nitrogen adsorption and desorption isotherm obtained at 77K
for one sample of β-hemihydrate. This estimated BET area of the material was Sopq(N,) = (7.3 ± 1.6) m,/g (C
opq > 100). Therefore, we observed that the values of Sopq(H,O) in Table 3
are much superior to the nitrogen BET area Sopq(N,). The t-plot for the hemihydrate shown in Figure S3 also shows the weak retention of nitrogen by micropores when compared to the water
vapor adsorption. Therefore, the nitrogen adsorption data supports a non-porous material in
contrast to water adsorption data that evidences the presence of micropores. These micropores
would be preferentially accessible by molecules smaller than nitrogen, such as water. In other
words, the water molecules seem to have access to a more extended surface than nitrogen
molecules. Therefore, similar discussions as proposed for the adsorption on AIII-CaSO% are also
convenient for the β- CaSO%⋅ 0.5H,O. For example, the broadly used nitrogen adsorption
techniques seem to be insufficient to represent the whole extent of the β- CaSO%⋅ 0.5H,O textural properties. To obtain more reliable and complete data about the surface area and the pore network
of this material, it would also be interesting to perform complete water vapor adsorption isotherms
for the given temperatures with relative water vapor pressure (or relative humidity) values up to
near saturation values. Using different adsorbing gases could also increase the comprehension of
the textural properties of β-hemihydrate.
Furthermore, we observe that the specific surface area values estimated by water adsorption for
β-hemihydrate (between 46 and 61 m,⁄ ) are sensibly inferior to the ones calculated for AIII-g
CaSO% (between 60 and 78 m,⁄ ). This difference may be produced by the fact that the hydration g
reaction decreases the number of open pores for adsorption due to the increase in the crystalline
water content. This also may be caused by the structural change taking place during the phase
The main differences between the considerations for adsorption on AIII-CaSO% compared to the lower temperature isotherms obtained for β-CaSO%⋅ 0.5H,O reside in the adsorption mechanism. Water vapor adsorption seems to proceed with a multilayer adsorption mechanism with the likely
presence of micropores.
Finally, other mathematical models for adsorption on microporous-mesoporous materials can be
found in the literature. However, they present little gain in physical interpretation compared to the
BET model. For temperatures of 80℃ and 90℃, we observe that due to restricted relative pressure range we could only obtain the beginning of their isotherms. This made it difficult to describe the
general profile of the adsorption isotherms for these conditions.
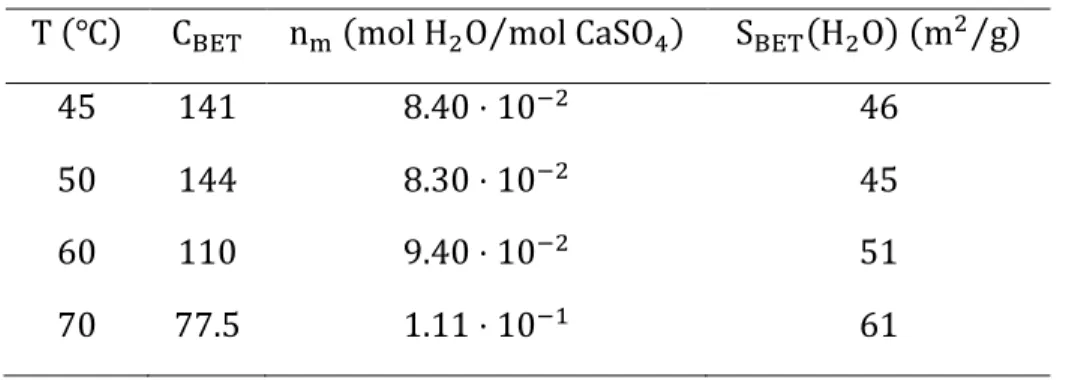
Table 3. Parameters obtained from the application of the BET model for isotherms from 45℃ to 70℃
T (℃) Copq nZ (mol H,O mol CaSO⁄ %) Sopq(H,O) (m,⁄ ) g
45 141 8.40 ⋅ 10‡, 46
50 144 8.30 ⋅ 10‡, 45
60 110 9.40 ⋅ 10‡, 51
70 77.5 1.11 ⋅ 10‡u 61
4. Conclusions
This was the second part of a two-part study about the thermodynamic aspects of the
thermodynamic equilibrium between water vapor and two calcium sulfate polymorphs,
AIII-CaSO% and β-CaSO%⋅ 0.5H,O, obtained from the dehydration of gypsum. The first part consisted in the experimental determination of the equilibrium conditions between these two compounds
physical interpretation for the observed adsorption phenomena by means of thermodynamic
modeling of the experimental adsorption isotherms.
For AIII-CaSO%, we proposed models of localized monolayer adsorption and the adsorbed layer
was considered as a solution between free and occupied adsorption sites. Initially, we assumed
ideal behavior of the surface solution and employed the Langmuir adsorption model to fit it. This
model was not sufficient to represent the integrality of the adsorption isotherms and the fitted
parameters presented some dispersion. Afterwards, the fitting was improved by the assumption of
non-ideal behavior of the surface solution and the introduction of a parameter to take account of
the interactions between the solution components. For both methods the values of the energy of
adsorption were considerably low and confirmed an initial hypothesis of physisorption.
For β-CaSO%⋅ 0.5H,O, the water adsorption was modeled assuming multilayer adsorption. The
adsorption isotherm profiles for temperature from 45℃ to 70℃ were not homographic as the ones for AIII-CaSO% and we employed the BET theory to analyze them. We observed shifts between the BET theory and the experimental points for low relative pressure ranges and attributed these
effects to the presence of micropores in the matrix of the material. Isotherms for temperatures of
80℃ and 90℃ were left out of the modeling because they did not present a sufficiently large range of relative pressure to assess their characteristics.
For both materials, we observed an important effect concerning the differences between specific
surface and profile of the adsorption isotherm for water vapor and nitrogen. The adsorption profiles
obtained for water adsorption were typical of microporous materials. However, nitrogen
adsorption data obtained at 77 K showed a profile for non-porous materials. Furthermore, the surface area values calculated from water adsorption data (either S[(H,O) for AIII-CaSO% or Sopq(H,O) for β-CaSO%⋅ 0.5H,O) were several times larger than the values Sopq(N,) obtained
by nitrogen adsorption data. This was interpreted as possibly caused by the fact that water
molecules have reduced dimensions and may access smaller pores when compared to nitrogen
molecules. Other effects of capillary condensation could also play a role in this phenomenon.
ASSOCIATED CONTENT
The following files are available free of charge.
Additional characterization data for the initial sample and for its dehydration product at 200℃ is provided in Support_Preturlan_JGD.PDF
AUTHOR INFORMATION
Corresponding Author
E-mail: favergeon@emse.fr
ACKNOWLEDGMENT
The authors acknowledge Saint-Gobain for the funding of this work.
NOMENCLATURE
T Temperature (℃)
P123 Water vapor partial pressure (hPa) S Free adsorption sites
G(;) Adsorbing gas
SG(>?@) Adsorption site occupied by a gas molecule
KCD Equilibrium constant xJ Molar fraction of species i
γJ Activity coefficient of species i
PH Partial pressure of adsorbing gas G
P° Reference pressure (normally taken as the unit pressure) R Universal gas constant (= 8.314 J ⋅ mol‡u⋅ K‡u)
θ Surface coverage fraction
KP Langmuir equilibrium constant (ideal solution)
KP,Q Pre-exponential constant for Langmuir adsorption isotherm model
E>?@ Adsorption energy (J ⋅ mol‡u⋅ K‡u)
n> Adsorbed quantity (mol H,O mol CaSO⁄ %) nZ Monolayer capacity (mol H,O mol CaSO⁄ %) S[ Specific surface area (m,⋅ g‡u)
Sopq(N,) BET area calculated from nitrogen adsorption data (m,⋅ g‡u)
Sopq(H,O) BET area calculated from water vapor adsorption data (m, ⋅ g‡u)
N`a Avogadro’s number M@ Molar mass (g ⋅ mol‡u)
B Margules interaction parameter α Interaction parameter
αQ Pre-exponential factor
Γ Thermal coefficient (kJ ⋅ mol‡u)
KfG Equilibrium constant from regular solution approximation (non-ideal adsorption) Pn Relative pressure
PH@>r(T) Saturation pressure of gas G
Copq BET constant GREEK LETTERS
ε Overall water content (mol H,O mol CaSO⁄ %)
σ Cross-sectional area of an adsorbing gas molecule (nm,)
(1) Preturlan, J. G. D.; Vieille, L.; Quiligotti, S.; Favergeon, L. Thermodynamic Equilibrium
between Calcium Sulfate and Water Vapor. Part 1: Experimental Study and Phase
Equilibria. Submitt. Artic. 2018.
(2) Everett, D. H. The Thermodynamics of Adsorption. Part II.-Thermodynamics of
Monolayers on Solids. Trans. Faraday Soc. 1950, 46, 942–957.
(3) Everett, D. H. The Thermodynamics of Adsorption. Part III.-Analysis and Discussion of
Experimental Data. Trans. Faraday Soc. 1950, 46, 957–969.
(4) Soustelle, M. Thermodynamics of Surfaces and Capillary Systems; ISTE Editions Ltd,
2016; Vol. 7.
(5) Rouquerol, F.; Rouquerol, J.; Sing, K. Adsorption by Powder and Porous Solids: Principles,
Methodology and Applications; Academic Press, 1999.
(6) Ruthven, D. M. Principles of Adsorption and Adsorption Processes; John Wiley & Sons,
1984.
(7) Gregg, S.; Sing, K. Adsorption, Specific Surface and Porosity, 2nd ed.; Academic Press,
1991.
(8) Authelin, J. Thermodynamics of Non-Stoichiometric Pharmaceutical Hydrates. Int. J.
Pharm. 2005, 303, 37–53.
(9) Okhrimenko, L.; Favergeon, L.; Johannes, K.; Kuznik, F.; Pijolat, M. Thermodynamic
Study of MgSO4–H2O System Dehydration at Low Pressure in View of Heat Storage.
(10) Butt, H.; Graf, K.; Kappl, M. Physics and Chemicstry of Interfaces; WILEY-VCH, Ed.;
2003.
(11) Soustelle, M. Thermodynamic Modeling of Solid Phases; John Wiley & Sons, Inc.:
Hoboken, NJ, USA, 2015.
(12) Prausnitz, J. M.; Lichtenthaler, R. N.; Azevedo, E. G. de. Molecular Thermodynamics of
Fluid-Phase Equilibria, 3rd ed.; Prentice Hall, 1999.
(13) Carey, J. W.; Bish, D. L. Equilibrium in the Clinoptilolite-H2O System. Am. Mineral. 1996,
81, 952–962.
(14) Fialips, C. I.; Carey, J. W.; Bish, D. L. Hydration-Dehydration Behavior and
Thermodynamics of Chabazite. Geochim. Cosmochim. Acta 2005, 69 (9), 2293–2308.
(15) Brunauer, S.; Emmett, P. H.; Teller, E. Adsorption of Gases in Multimolecular Layers. J.
Am. Chem. Soc. 1938, 60 (2), 309–319.
(16) Mooney, R. W.; Keenan, A. G.; Wood, L. A. Adsorption of Water Vapor by
Montmorillonite. I. Heat of Desorption and Application of BET Theory. J. Am. Chem. Soc.
1952, 74 (6), 1367–1371.
(17) Mooney, R. W.; Keenan, A. G.; Wood, L. A. Adsorption of Water Vapor by
Montmorillonite. II. Effect of Exchangeable Ions and Lattice Swelling as Measured by
X-Ray Diffraction. J. Am. Chem. Soc. 1952, 74 (6), 1371–1374.
(18) LLewellyn, P.; Rodriguez-Reinoso, F.; Rouquerol, J.; Seaton, N. Is the BET Equation
(19) McClellan, A. L.; Harnsberger, H. F. Cross-Sectional Areas of Molecules Adsorbed on
Solid Surfaces. J. Am. Chem. Soc. 1944, 66 (4), 569–573.
(20) Lastoskie, C.; Gubbins, K. E.; Quirke, N. Pore Size Distribution Analysis of Microporous
Carbons: A Density Functional Theory Approach. J. Phys. Chem. 1993, 97 (18), 4786–
4796.
(21) Hagymassy, J.; Brunauer, S.; Mikhail, R. S. Pore Structure Analysis by Water Vapor
Adsorption. J. Colloid Interface Sci. 1969, 29 (3), 485–491.
(22) Médout-Marère, V.; Belarbi, H.; Thomas, P.; Morato, F.; Giuntini, J. C.; Douillard, J. M.
Thermodynamic Analysis of the Immersion of a Swelling Clay. J. Colloid Interface Sci.
1998, 202 (1), 139–148.
(23) Salles, F.; Douillard, J. M.; Denoyel, R.; Bildstein, O.; Jullien, M.; Beurroies, I.; Van
Damme, H. Hydration Sequence of Swelling Clays: Evolutions of Specific Surface Area
and Hydration Energy. J. Colloid Interface Sci. 2009, 333 (2), 510–522.
(24) Gregg, S. J.; Willing, E. G. J. 525. The Dehydration of Gypsum. Part I. A Study of the
Thermal Decomposition of Gypsum by the Adsorption of Oxygen and of Nitrogen at -183°.
J. Chem. Soc. 1951, 0, 2373–2377.
(25) Gregg, S. J.; Willing, E. G. J. 526. The Dehydration of Gypsum. Part II. A Study of the
Thermal Dehydration of Qypsum by Means of the Adsorption of Carbon Tetra- Chloride
Vapour at 25°. J. Chem. Soc. 1951, 0, 2378–2380.
Process of Dehydration and Rehydration of Gypsum by Adsorption Methods. J. Chem. Soc.
1951, 0, 2916–2920.
Table of contents graphics