Research Article
Functionalized Glutathione on Chitosan-Genipin Cross-Linked
Beads Used for the Removal of Trace Metals from Water
Samira R. Akaji and David Dewez
Laboratory of Environmental & Analytical Biochemistry of Contaminants, Department of Chemistry, University of Quebec in Montreal, Montr´eal, C.P. 8888 Succursale Centre-Ville, Canada
Correspondence should be addressed to David Dewez; [email protected]
Received 25 May 2020; Revised 3 August 2020; Accepted 27 August 2020; Published 14 September 2020 Academic Editor: Carlo Galli
Copyright © 2020 Samira R. Akaji and David Dewez. This is an open access article distributed under the Creative Commons Attribution License, which permits unrestricted use, distribution, and reproduction in any medium, provided the original work is properly cited.
Functionalized glutathione on chitosan-genipin cross-linked beads (CS-GG) was synthesized and tested as an adsorbent for the removal of Fe(II) and Cu(II) from aqueous solution. The beads were characterized by several techniques, including Fourier-transform infrared spectroscopy (FTIR), thermogravimetric analysis (TGA), CNS elementary analysis, scanning electron mi-croscopy (SEM), and atomic force mimi-croscopy (AFM). The effect of several parameters such as the pH, the temperature, and the contact time was tested to optimize the condition for the adsorption reaction. The beads were incubated in aqueous solutions contaminated with different concentrations of Fe(II) and Cu(II) (under the range concentration from 10 to 400 mg·L−1), and the adsorption capacity was evaluated by inductively coupled plasma optical emission spectrometry (ICP-OES). The adsorption equilibrium was reached after 120 min of incubation under optimal pH 5 for Fe(II) and after 180 min under optimal pH 6 for Cu(II). According to the Langmuir isotherm, the maximum adsorption capacities (qmax) for Fe(II) and Cu(II) were 208 mg·g−1and 217 mg·g−1, respectively. Our results showed that the adsorption efficiency of both metals on CS-GG beads was correlated with the degree of temperature. In addition, the adsorption reaction was spontaneous and endothermic, indicated by the positive values of ΔG0and ΔH0. Therefore, the present study demonstrated that the new synthesized CS-GG beads had a strong adsorption capacity for Fe(II) and Cu(II) and were efficient to remove these trace metals from aqueous solution.
1. Introduction
The development of urbanization including industrial and agricultural activities has been the main source of metal pollution in the environment. The continuous release of trace metal elements in water reservoir may represent a risk of toxicity for natural ecosystems and human health, since these metals are nonbiodegradable and can be bio-accumulated in aquatic organisms [1–3]. Therefore, water pollution by metals is still a global problem for environ-mental quality and public health. In particular, Fe(II) and Cu(II) are both nutrients at very low concentrations in-volved in many biological functions such as cofactors for enzymatic activities but become toxic at high concentrations [4–6]. According to the WHO standards, the acceptable limits of Fe(II) and Cu(II) in drinking water are 0.3 mg·L−1
and 2.0 mg·L−1, respectively [7]. Indeed, water with high Fe(II) content can represent a substrate for the development of bacterial contamination in the ducts [8]. It was reported that chronic exposure to Fe(II) may lead to adverse health effects, such as impaired hematopoiesis [9]. In addition, Cu(II) overload can induce adverse health effects, such as keratinization, gastrointestinal, liver, or kidney disorders [10–12].
To preserve water quality, different remediation strate-gies have been developed to control the concentration of trace metal elements in a freshwater reservoir. Until now, remediation methodologies have included chemical pre-cipitation, reverse osmosis, coagulation and flocculation, oxidation, electrochemical treatment, ion exchange, solid-phase extraction, adsorption on activated carbon, and biosorbents [1, 2, 13]. In particular, the use of adsorbents
Volume 2020, Article ID 4158086, 14 pages https://doi.org/10.1155/2020/4158086
showed to be the most economical and effective method for the removal of metals from aqueous solution, without producing toxic sludge (by-products of treatment). Several types of adsorbent were studied such as clay mineral, ac-tivated carbon, porous carbon, porous carbon loaded with ZnO nanoparticles, nanomaterials, chitosan and modified chitosan, carbon nanotubes coated with alumina, zeolites, natural polymers, and mesoporous treated fish waste [14–29]. Among natural polymer adsorbents, the chitosan (CS) represented a “green” and eco-friendly compound for the adsorption of metals in solution, because of its hydro-philicity, biocompatibility, biodegradability, and bio-functionality properties [30]. The synthesis of CS is usually obtained by the alkaline deacetylation of chitin, a natural polysaccharide found in the exoskeletons of crustaceans like shrimps, crabs, prawns, and lobsters [31, 32]. To increase the stability and the capacity of CS beads, cross-linking agents are used such as glutaraldehyde, epichlorohydrin, and ethylene glycol diglycidyl ether, leading to the formation of a three-dimensional network [33–36]. However, these chemicals are known to be toxic to living organisms. In fact, the cytotoxic, mutagenic, and carcinogenic properties of glutaraldehyde were previously demonstrated [37, 38].
It is well known that the adsorbent property of CS is due to the presence of amine (–NH2) (acetamide or primary
amino) and hydroxyl (–OH) groups, providing coordination sites for the complexation of metals. To improve the max-imal adsorption capacity of CS, the design of chelating CS-based resin has been the subject of many studies [21, 30, 39]. Previously, different sulfur compounds were added to CS, such as dithiocarbamate [40], thiourea or dithiooxamide [41], and mercapto acetic acid [42]. Recently, the ligand cysteine was used for the functionalization of CS to bind more efficiently metals in aqueous solutions [43]. However, other thiol compounds were not investigated and should be tested to determine the efficiency of new complexes. In particular, phytochelatins (PCs) are well-known thiol polypeptides, consisting of a chain of 2 to 11 units of glu-tathione (c-L-glutamyl-L-cysteinylglycine, GSH). In plant cells, these compounds are chelators involved in the transport of metals into the vacuole, maintaining the ho-meostasis of intracellular concentration of metals [44]. Since the synthesis of PCs is costly, its repetitive subunit GSH can represent a more practical alternative. In addition, the GSH is composed of three amino acids as c-L-glutamyl-L-cys-teinylglycine, providing the functional groups –COOH, –SH, and–NH2for the complexation of metals [45].
The main objective of this study was to design a new complex CS-genipin by covalent cross-linking reaction and functionalized with GSH to obtain a strong adsorption property for metals in solution. It is known that genipin is a natural cross-linking agent derived from geniposide, a compound extracted from the fruit Gardenia jasminoides Ellis (Rubiaceae). This plant was traditionally used by Asian populations as a medicinal herb and food coloring, and its toxicity was demonstrated to be a thousand times (5000–10000) lower than glutaraldehyde. It was reported that genipin can make covalent bonds with amino groups of proteins and biopolymers such as CS [46–48]. For these
reasons, we used in this study the genipin as a cross-linking agent to make the beads. The new beads were characterized by Fourier-transform infrared spectroscopy (FTIR), ther-mogravimetric analysis (TGA), CNS elementary analysis, scanning electron microscopy (SEM), and atomic force microscopy (AFM). In addition, we investigated their ad-sorption capacity in aqueous solution for both Fe(II) and Cu(II) ions, and the quantification was performed by in-ductively coupled plasma optical emission spectrometry (ICP-OES). The effect of different parameters (variables) was also investigated on the adsorption rate, such as the pH, the temperature, the reaction time, and the adsorption iso-therms. Therefore, this study determined the optimal con-dition for the adsorption of Fe(II) and Cu(II) ions on these new CS-genipin cross-linked beads with functionalized GSH (CS-GG).
2. Material and Methods
2.1. Material and Reagents. The CS (Kitomer
™
, MW 1600 kDa, 85–89% D Ac) was obtained from Marinard Biotech (QC, Canada). The genipin was purchased from Challenge Bioproducts Co., Ltd. (Taiwan). The reduced form of glutathione at high purity was provided by Bio Basic Inc. (ON, Canada). The chemicals CuCl2, FeCl2.4H2O, andan-hydrous ethanol were purchased from Sigma–Aldrich Chemical Co. All chemicals were of analytical grade and used as received without any additional purification. All subsequent experiences were carried out with Nanopure water provided by a Barnstead Nanopure water purification system (ThermoFisher Scientific).
2.2. Preparation of Chitosan-Based Beads
2.2.1. Preparation of Bead-Forming Solution. A mixture of CS (5 g) and aqueous acetic acid (250 ml, 0.1 % (v/v)) was stirred at 150 rpm for 24 h at room temperature to ensure total solubility of the CS. Then, a simple ultrasound device (Fisher Scientific Model 505 Sonic Dismembrator) was used to remove air bubbles in the solution before forming the beads.
2.2.2. Gelification of Chitosan Beads under Alkaline Condition. The previous gelatinous mixture was released through a syringe needle (1 mm in diameter) into 1 M NaOH solution with 70% alcohol, in which the CS was precipitated immediately to form gelatinous spherical beads. The ob-tained CS beads were thoroughly washed with Nanopure water followed by ethanol (70%) until neutrality. The beads were kept in 0.01 M of sodium phosphate buffer (pH 7.0) at 4°C until further use. Before using them, the beads were
generously washed three times with ethanol (70%) and three times with Nanopure water.
2.2.3. Formation of Chitosan-Genipin Cross-Linked Beads. The CS beads obtained in the previous step did not have satisfactory mechanical properties. To improve them, the beads were cross-linked with genipin to reinforce the
structure of the covalent bonds between CS and genipin. An amount of 50 g of CS beads was put into a cross-linking solution containing 5.6 mg of genipin (0.05% of CS weight). The suspension was moderately stirred at room temperature during 48 h. Then, the cross-linked beads were rinsed with ethanol (70%) and Nanopure water to remove the excess of cross-linking solution.
2.2.4. Glutathione Functionalization on Chitosan-Genipin Cross-Linked Beads. An amount of 50 g of CS-genipin cross-linked beads was added to 200 mL of a solution containing 2 mg·mL−1of GSH and 0.1 mM of genipin, which were then incubated at 25°C during 24 h under a mildly stirring. Before
decantation, beads were rinsed with Nanopure water to remove the excess of by-products and other impurities. With this method, we obtained beads functionalized at their surface with a thin layer of GSH (CS-GG).
2.3. Characterization of the Beads
2.3.1. Fourier-Transform Infrared Spectroscopy Analysis. Fourier-transform infrared (FTIR) spectra were recorded using a Spectrum One spectrophotometer (Thermo Scien-tific Nicolet 4700 iTR) equipped with a universal attenuated total reflectance (UATR) device. The analysis was performed in the spectral region (4000–500 cm−1) with 32 scans recorded at a 16 cm−1resolution.
2.3.2. Thermogravimetric Analysis. Thermogravimetric analysis (TGA) was done on native CS and CS-GG beads by using a TGA/MS analyser (TGAQ5000 Discovery MS). Experiments were performed under a dynamic argon at-mosphere flowing at a rate of 15 mL·min−1and at a heating rate of 2.5°C·min−1.
2.3.3. Microscopy Measurements. Scanning electron mi-croscopy (SEM) was performed on CS and CS-GG beads to characterize their topography by using a field emission scanning electron microscope JEOL (model: JSM-7600F). In addition, atomic force microscopy (AFM) was used to an-alyze the surface topography of CS-GG beads with a Bruker MultiMode 8 AFM system.
2.3.4. CNS Elementary Analysis. The elementary analysis was carried out by using a Carlo Erba Instruments NA2500 series elemental analyser. The samples were dried, and 20 mg was put in tin capsules to measure the percentage of C, N, and S elements.
2.3.5. Adsorption Experiments. All metal adsorption studies were performed in batch experiments by using 125 mL Erlenmeyer flasks containing 50 mL of trace metal solution and 1 g of CS-GG beads. Stock solutions were prepared at 500 mg·L−1 of Fe(II) and Cu(II). The experiments were performed under the range concentration from 10 to 400 mg·L−1and different pH conditions (from 1 to 7), which
was adjusted by using HCl/NaOH solutions. The kinetics were studied at the optimum pH of 5.0 and 6.0 for Fe(II) and Cu(II), respectively, and under the constant temperature of 20°C. The analysis was carried out in triplicate at regular time
intervals (10 to 400 min). Three Erlenmeyer flasks were prepared (as mentioned before) for each time interval, from which aliquots (2 mL) were taken to determine the quantity of metal ions adsorbed on CS-GG beads.
Equilibrium isotherm studies were carried out with different concentrations of metal ions (10 to 400 ppm) at different temperatures. The thermodynamic parameters were determined by changing the temperature to 20°C, 30°C,
and 40°C in a temperature-controlled shaking incubator
(Infors HT Multitron Pro thermostatic). The flasks were agitated on a shaker at 150 rpm during 2 h. After the in-cubation, the solution was filtered and the concentration of metal ions was determined using inductively coupled plasma optical emission spectrometry (ICP-OES, Agilent model 5100, Agilent Technologies, USA). All experiments were performed in triplicate, and the average values were esti-mated. The quantity of metal ions was estimated per unit mass of the adsorbent according to the following equation:
qe� C0− Ce
m v, (1)
where qeis the adsorbed amount of metal ions per unit mass of the adsorbent (mg · g−1) at equilibrium, m (g) is the weight of the CS-GG beads, C0 is the concentration of Fe(II) and
Cu(II) before the adsorption, Ce (mg · L−1) is the concen-tration of Fe(II) and Cu(II) after equilibrium with CS-GG beads, and v (L) is the volume of the solution.
2.3.6. Adsorption Isotherms. Equilibrium adsorption iso-therms were used to determine the adsorption mechanism and capacity for metals. Some well-known ones are Lang-muir, Freundlich, Temkin, Redlich–Paterson, Dubi-nin–Radushkevich, and Sips equations [49–51]. The adsorption isotherms of Langmuir and Freundlich models were used to describe the adsorption equilibrium of Fe(II) and Cu(II) ions on CS-GG beads. The experiments were performed at different temperatures (20, 30, and 40°C).
The Langmuir isotherm assumed that the mechanism of metal ions’ adsorption process took place as a monolayer on the surface of the adsorbent (beads). The linear form of Langmuir isotherm was expressed by the following equation:
Ce qe � 1 qmaxCe+ 1 KL · qmax , (2)
where Ce is the equilibrium concentration of remaining metal ions in the solution (mg·L−1), qeis the amount of metal ions adsorbed per mass unit of adsorbent at the equilibrium (mg·g−1), qmax(constant) is the amount of metal ions for a
complete monolayer (mg·g−1), and KL is the Langmuir constant related to the affinity of binding sites (L·mg−1), representing a measure of the adsorption energy. qmaxand
KL were evaluated from the intercept and the slope of the linear plot of the experimental data of Ce/qe versus Ce, re-spectively. To determine the adsorption affinity of Fe(II) and
Cu(II) ions on CS-GG beads, the separation factor RLwas determined. This factor was calculated by the following equation:
RL� 1
1 + KL · C0
, (3)
where RLis a dimensionless separation factor, indicating the shape of the isotherm, C0is the initial concentration of metal
ions, and KLis the Langmuir constant. The tendency of the adsorption process was indicated by RLvalues. When RL> 1, the isotherm was unfavorable; for RL�1, the isotherm was linear; when RL< 1, the isotherm was favorable; for RL�0, the reaction was irreversible.
The Freundlich isotherm assumed that the mechanism of metal ions’ adsorption process did happen as a multilayer on a heterogeneous surface of the adsorbent (beads), given by the linear form of the following equation:
ln qe� 1
n ln Ce +ln KF, (4) where KFand n (or 1/n) are both a constant, indicating the adsorption capacity (mg·g−1) and the intensity (degree of surface heterogeneity), respectively. The fitting plots based on Langmuir and Freundlich models for the adsorption of Fe(II) and Cu(II) are presented in Figures S2(a) and S2(b) and Figures S3(a) and S3(b).
2.3.7. Adsorption Kinetics. The adsorption on a solid surface can be controlled by several steps such as the boundary layer (film) or external diffusion, the pore diffusion, the surface diffusion, and the adsorption on a pore surface. We in-vestigated the adsorption process of Fe(II) and Cu(II) ions on CS-GG beads by correlating our results with different kinetic models: the first-order [52], the pseudo-second-order [53], and the intraparticle diffusion [54].
The linear form of the pseudo-first-order equation was as follows:
log qe− qt �log qe− k1
2.303t, (5)
where k1is the pseudo-first-order rate constant (min−1) of
adsorption and qeand qt(mg·g−1) represent the amount of metal ions adsorbed at the equilibrium and at the time t (min), respectively. The straight-line plots of log (qe−qt) versus t were used to determine k1 and the correlation
coefficient R2, which is shown in Figures S4(a) and S4(b). Furthermore, the linear form of the pseudo-second-order equation was as follows:
t qt � 1 k2 · q2e+ 1 qe t, (6)
where k2 is the pseudo-second-order rate constant of ad-sorption (g mg−1·min−1). The value of 1/qt was calculated from the experimental results and plotted versus 1/t (min−1) to obtain the biosorption rate constant (k2), shown in
Figures S5(a) and S5(b).
Kinetics data were also fitted with the intraparticle diffusion model, which considers that if the rate-limiting
step was the intraparticle diffusion, then the amount adsorbed qt(mg·g−1) at any time t (min) should be directly proportional to the square root of the contact time t. This model was defined by Weber and Morris [54], and the equation was given as follows:
qt� ki d · t0.5+ C, (7) where qt(mg·g−1) is the amount adsorbed at the equilibrium time t (min), kid(mg · g−1·min−1) is the intraparticle diffusion rate constant, and C is the intercept of the plot of qtagainst
t0.5, providing information about the thickness of the boundary layer. The greater the value of C is, the greater the effect of the boundary layer on the adsorption is [51].
2.3.8. Thermodynamic Analysis. Thermodynamic parame-ters including the standard Gibbs energy change (ΔG°), the
enthalpy change (ΔH°), and the entropy change (ΔS°) of the
adsorption reactions of Fe(II) and Cu(II) were determined by using the following equations:
ΔG°� −RTln K c, Kc� 1000qe Ce , (8)
where R (8.314 × 10⁻³kJ·mol−1·K−1) represented the molar gas constant, T is the temperature (K), and Kc is the dis-tribution coefficient at different temperatures (20, 30°C, and
40°C). The equilibrium constant K
cwas related to the change of the Gibbs free energy process. To make Kcdimensionless,
qe was multiplied by 1000 before taking the logarithm [55–57]. In addition, the change in the Gibbs free energy was related to the change sof enthalpy and entropy at a constant temperature, according to the following equation:
ΔG°�ΔH − TΔS°. (9)
Values of ΔH°and ΔS°were calculated from the slope
and intercept of the linear plots of −ΔG°versus T (Figure S1).
The slope and intercept of the plot gave the ΔS°and the −ΔH°
values, respectively.
3. Results and Discussion
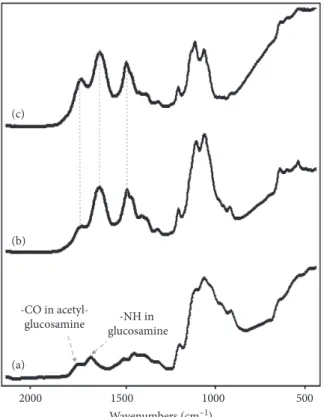
3.1. Characterization of Polymer Samples. The obtained spectra of CS, CS-genipin, and CS-GG beads determined by FTIR analysis are presented in Figure 1. The CS selected in the present study possessed a DDA of 89%, indicating 89% of glucosamine and 11% of acetyl-glucosamine. For this reason, the native CS absorption spectrum showed two specific absorption bands (Figure 1(a)), the first one located at 1650 cm−1was related to acetyl-glucosamine, and the second one at 1550 cm−1 was attributed to the primary amine (planning vibration) from glucosamine. This confirmed the presence of residual N-acetyl groups in CS, as it was pre-viously reported [58]. When CS was cross-linked with genipin, the absorption bands at 1655 and 1575 cm−1 dis-appeared (Figure 1(b)), and a new absorption band located at 1640 cm−1 was related to the carbonyl from genipin. In
addition, the comparison of CS-GG and CS-genipin spec-trum presented no significant differences (Figure 1(c)). However, the intensity of the absorption band at 1550 cm−1 appeared to be related to the carbonyl from genipin, and the absorption band from the carboxyl of GSH was significantly increased.
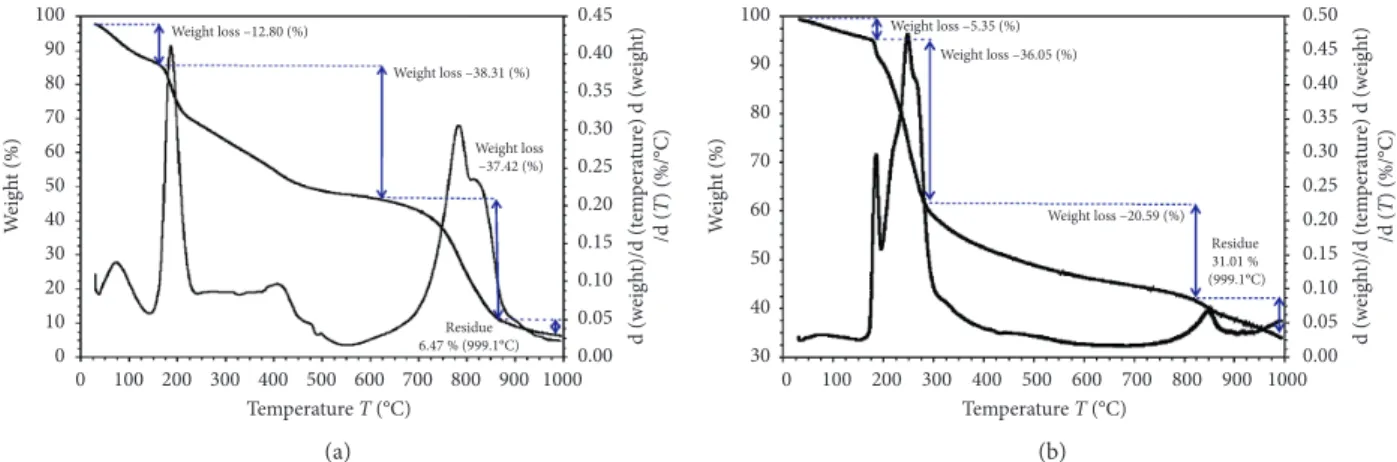
The TGA analysis showed that thermogravimetric curves (TG) displayed three important phases for CS beads (Figure 2(a)) and CS-GG beads (Figure 2(b)). The weight loss of CS beads was 12.8% under the temperature range of 30°C–170°C, and this was attributed to the moisture in the
beads. The TG curve showed a mass loss of 38.31% under 175°C–650°C, 37.42% under 675°C to 870°C, and 5.05%
under 875°C to 999.1°C. However, the CS-GG beads were
thermally more stable than CS beads, and the loss due to the moisture was 5.35% in the temperature range of 30°C–178°C.
In addition, the TG curve showed a 36.05 and 20.59% weight loss under the range of 178°C–276°C and 290°C–825°C,
respectively. These results were attributed to the splitting of the saccharide rings. Furthermore, the TG curve indicated a final weight loss for the CS beads of about 93.53%, while for CS-GG beads, it was about 68.99% at 999.1°C. These results
confirmed the modification of the native CS beads by genipin cross-linking and the functionalization of GSH, giving the property to be more thermally stable. This can be explained by the formation of a rigid polymer network, resulting in a higher thermally stable composite.
The elemental analysis of carbon, azote, and sulfur was performed on the beads, and the weight ratio of C, N, and S for CS beads was found to be 40.48, 6.76, and 0%, respec-tively. In a previous study, similar values in CS were found
for C, N, and S contents with 40.2, 7.41, and 0%, respectively [59]. Our results did suggest a high purity of the CS used. The proportions of C, N, and S contents in CS-GG beads were 68.57, 18.31, and 0.72%, respectively. In fact, the percentage of S was directly proportional to the amount of GSH functionalized into the beads.
The obtained SEM photography showed the surface morphology of CS beads (Figures 3(a) and 3(b) and CS-GG beads (Figures 3(c) and 3(d). The micrographs presented the homogeneity of the adsorbent, and the presence or not of voids and aggregates onto the surface. In fact, the surface of CS-GG beads was more uniform than the surface of CS beads, indicating a better homogenization film of cross-linked chitosan. In addition, the AFM was used on CS-GG beads to obtain a detailed observation of the nanocomposite film surface at high resolution (Figure 4). The obtained AFM image of CS-GG beads revealed the presence of voids onto the surface.
3.2. Optimization of the Adsorption Capacity for CS-GG Beads. The effects of pH, temperature, contact time, initial con-centration of metal ions in solution, and thermodynamic and adsorption kinetic parameters were investigated on the adsorption capacity of Fe(II) and Cu(II) on CS-GG beads. 3.2.1. Effect of pH. It is well known that the pH is one of the most important factors during the adsorption process, since it can affect the speciation and the solubility of metal ions, their concentration, the functional groups of the adsorbent, and the degree of ionization during the reaction [60–63]. In (a) (b) (c) -CO in acetyl-glucosamine glucosamine-NH in 2000 1500 1000 500 Wavenumbers (cm–1)
this study, adsorption experiments were conducted in the pH range of 2–6 for Fe(II) and 2–7 for Cu(II). However, Fe(II) and Cu(II) precipitated as insoluble hydroxides at pH > 6 and at pH > 7, respectively. Figure 5(a) showed that increasing the pH values of the solution from 2 to 5 induced an increase of the adsorption capacity for Fe(II) and Cu(II). According to previous studies, when the pH of the medium was low, the high concentration of proton (H+) did occupy most of the adsorption-binding sites at the surface of the adsorbent (i.e., protonation of the amino group). The H+did
compete with metal ions, causing a decrease in adsorption efficiency [60–63]. In our study, the CS-GG beads were protonated and gained electrostatic properties (–COO−, –NH3+, –SH). However, it is most likely that the binding of
divalent metal ions Fe(II) and Cu(II) was stronger than H+, since the electrostatic interaction between the pair of elec-trons on the nitrogen atom and the metal ion was stronger than H+. In addition, there was a mechanism of ion exchange or competitive adsorption between the metal ions and the H+on the amino group [62, 63]. Moreover, the increase in 985µm
(a) (b)
903µm
(c) (d)
Figure 3: SEM photography showing the surface morphology of CS beads (a, b) and CS-GG beads (c, d).
W eig ht (%) Weight loss –12.80 (%) Weight loss –38.31 (%) Weight loss –37.42 (%) Residue 6.47 % (999.1°C) d (w eig ht)/d (t em pera tur e) d (w eig ht) /d ( T ) (%/°C) Temperature T (°C) 0 100 200 300 400 500 600 700 800 900 1000 0.45 0.40 0.35 0.30 0.25 0.20 0.15 0.10 0.05 0.00 100 90 80 70 60 50 40 30 20 10 0 (a) Weight loss –20.59 (%) Residue 31.01 % (999.1°C) Temperature T (°C) d (w eig ht)/d (t em pera tur e) d (w eig ht) /d ( T ) (%/°C) Weight loss –5.35 (%) Weight loss –36.05 (%) 0 100 200 300 400 500 600 700 800 900 1000 0.50 0.45 0.40 0.35 0.30 0.25 0.20 0.15 0.10 0.05 0.00 W eig ht (%) 100 90 80 70 60 50 40 30 (b)
2.94 2.80 2.60 2.40 2.20 2.00 1.80 1.60 1.40 1.20 1.00 0.80 0.60 0.40 0.20 0.00 10µm 3 2 6 1 4 5 (µ m)
Figure 4: AFM image of CS-GG beads.
Fe(II) Cu(II) qe (m g g –1) 0 20 40 60 80 100 2 4 6 8 0 pH (a) Fe(II) Cu(II) qe (m g g –1) 0 20 40 60 80 100 120 290 310 270 Temperature (°K) (b) Fe(II) Cu(II) qt (m g g –1) 0 20 40 60 80 100 120 100 200 300 0 Time (min) (c) Fe(II) Cu(II) qe (m g g –1) 0 20 40 60 80 100 120 140 160 180 100 200 300 400 0 Initial concentration Ci (mg L–1) (d)
Figure 5: Effect of the initial pH (a), the temperature (b), the contact time (c), and the initial concentration of metal ions in solution (d) on the adsorption capacity of CS-GG beads for Fe(II) and Cu(II). The error bars represent the standard deviation of measurements for three sample runs (n � 3).
the pH value induced a decrease in the protonation of the amine groups, facilitating the deprotonation of both car-boxylic and –SH groups, and releasing more binding sites. This reaction might increase the coordination sites for metal ions on CS-GG beads and the formation of an inner-sphere complex by a surface chelation ion exchange [43, 62, 63]. This explanation agreed with our obtained results con-cerning the increase in the adsorption capacity of metal ions shown in Figure 5(a). Therefore, we found that the optimum pH for the adsorption of Fe(II) and Cu(II) onto CS-GG beads was 5 and 6, respectively.
3.2.2. Effect of Temperature. The effect of temperature on the adsorption capacity of CS-GG beads for Fe(II) and Cu(II) was investigated under the range of 20°C to 40°C
(Figure 5(b)). During these experiments, all the other pa-rameters were kept constant at their optimum values, in-cluding a pH of 5 for Fe(II) and 6 for Cu(II), an adsorbent quantity of 0.03 g, and a contact time of 120 min. The results showed that the adsorption capacity increased from 47.26 to 76.87 mg·g−1, in the temperature range tested for Fe(II). Concerning Cu(II), the adsorption capacity increased from 82.26 to 107.11 mg·g−1under the same range of temperature (Figure 5(b)). The enhancement in adsorption capacity was correlated with the increase in temperature. This can be attributed to a higher number of active surface sites available during the adsorption and to an increase in porosity and pore volume of the adsorbent [64]. Therefore, the correlation between the adsorption capacity and the temperature in-dicated that the adsorption reaction of Fe(II) and Cu(II) ions on CS-GG beads was endothermic.
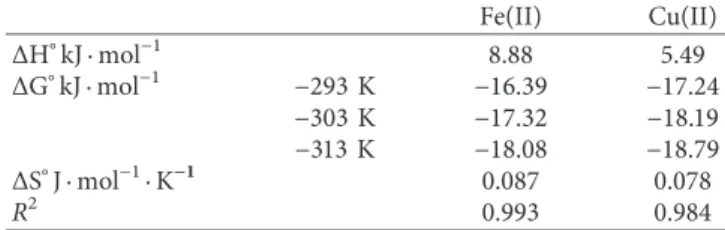
3.2.3. Thermodynamic Analysis. Thermodynamic parame-ters characterizing the adsorption reaction of Fe(II) and Cu(II) onto CS-GG beads were analyzed, such as the changes in Gibbs standard energy (ΔG°), in enthalpy (ΔH°), and in entropy (ΔS°), and the results were presented in Table 1. Based on thermodynamics, since the reaction did take place in an isolated system, the energy in the system could not be gained or lost, and the entropy change would be the only driving force [65]. Our results showed that the negative value of the Gibbs free energy (ΔG°< 0) increased in relation to the
increase in temperature, indicating the probability and spontaneity of both Fe(II) and Cu(II) adsorption reactions
onto CS-GG beads. The positive value of the enthalpy change (ΔH°> 0) of Fe(II) and Cu(II) adsorption reactions indicated
the endothermic property of these reactions. In addition, the positive value of the entropy change (ΔS°> 0) indicated that the number of species at the solid-liquid interface increased as well as the randomness at the interface. This was pre-sumably due to the release of aqua molecules when Fe(II) or Cu(II) was adsorbed at the surface of the adsorbent. 3.2.4. Effect of Fe(II) and Cu(II) Concentration. The ad-sorption experiments were carried out at different initial concentrations of Fe(II) and Cu(II) ranging from 10 to 400 mg·L−1 during 120 min and under optimal pH condi-tions of 5 and 6 for Fe(II) and Cu(II), respectively. The effect of the initial concentration of both tested metals on the adsorption capacity of CS-GG beads is presented in Figure 5(d). The results showed that the quantity of adsorbed metal ions increased gradually with the increase of the initial concentration of metal ions in the solution, until reaching a saturation plateau. The adsorption capacity was 126.35 mg·g−1 and 156.69 mg·g−1 for Fe(II) and Cu(II), re-spectively. Concerning Cu(II), the high adsorption capacity was attributed to its strong affinity for the chitosan. In fact, the increase in the initial concentration of metal ions would induce an increase in the motive force. In CS-GG beads, the sulfur, the nitrogen, and the oxygen atoms with free elec-trons would have a stronger interaction with metal ions. 3.2.5. Adsorption Isotherm. Here, we applied adsorption isotherms to better understand the mechanism of Fe(II) and Cu(II) adsorption reactions onto CS-GG beads, such as the distribution of the adsorbent molecules between the liquid and solid phases once the equilibrium state is reached. Both models of Langmuir and Freundlich isotherms were used to determine the adsorption isotherm data from the experi-ments. The Langmuir isotherm assumed that the adsorption process occurred homogeneously on a monolayer within the adsorbent until reaching a saturation level. This model considers that all adsorption sites involved are energetically identical (homogeneous) and the intermolecular force will decrease as the distance from the adsorption surface increase [66, 67]. The isotherm of Freundlich was also applied, by considering that the adsorption reaction might occur on a multilayer and an energetically heterogeneous surface. However, the empirical equation of this model is suitable for high- and middle-concentration range. Therefore, this iso-therm was not suitable in our study under low-concentra-tion range, since Henry’s law was not met. This isotherm permitted only to describe the nonideal and reversible adsorption.
The calculated Langmuir and Freundlich parameters were presented in Table 2. The maximum adsorption values for Fe(II) were 208.33, 212.77, and 243.90 mg·g−1under 293, 3033, and 313°K, respectively. The values for Cu(II) were
217.39, 263.15, and 277.77 mg·g−1 under 293, 3033, and 313°K, respectively. The values of the maximum adsorption
capacity (qmax) obtained from Langmuir isotherm were
much higher than the measured qmax for both Fe(II) and
Table 1: Thermodynamic parameters for the adsorption of Fe(II) and Cu(II) ions on CS-GG beads at different temperatures.
Fe(II) Cu(II) ΔH°kJ · mol−1 8.88 5.49 ΔG°kJ · mol−1 −293 K −16.39 −17.24 −303 K −17.32 −18.19 −313 K −18.08 −18.79 ΔS°J · mol−1·K−1 0.087 0.078 R2 0.993 0.984
Experimental condition: volume of 50 mL; pH � 5 for Fe(II) and 6 for Cu(II); [Fe(II), Cu(II)] � 100 mgL−1; adsorbent net mass � 0.030 g; tem-perature � 293, 303, and 313°K; contact time � 2 h; shaking rate � 150 rpm.
Cu(II). However, the adsorption capacity for Cu(II) was still higher than the one for Fe(II). In addition, KLin Langmuir isotherm was higher for Cu(II) compared to KLfor Fe(II). Our results are consistent with previous studies, in which the CS showed a good affinity and selectivity for Cu(II) [68, 69]. In addition, Cu complexes with ammonia were stable, in-dicating that the CS was selective for this metal ion. This indicated that our beads showed better adsorption rates for Cu(II) compared to Fe(II). In addition, the higher affinity for Cu(II) can be explained by the Jahn-Teller effect, which is known to be predominant for Cu complexes [65, 70]. All of RLvalues found were between 0 and 1 (0 < RL< 1) under the studied concentration and temperature range (Figure S2 and Table 2), indicating the adsorption affinity of Fe(II) and Cu(II) onto CS-GG beads. Based on the Freundlich iso-therm, the KFvalue obtained for Cu(II) was higher than the value for Fe(II). A previous study showed that the tested adsorbent had a more homogeneous distribution of binding sites if the parameter n (or 1/n) value was close to 1 or even to 1 [23]. Our results showed that the values of 1/n obtained for both Fe(II) and Cu(II) were 0.91 and 0.70, respectively, suggesting that the binding sites were more homogeneous for the adsorption of Fe(II) and Cu(II) at the solid-liquid interface. Moreover, our data was better correlated with the Langmuir isotherm (R2> 0.98) than the Freundlich isotherm. Therefore, our results suggested that the adsorption reac-tions of Fe(II) and Cu(II) did occur as a monolayer mechanism onto the CS-GG beads.
3.2.6. Effect of Contact Time. Since the time to reach an adsorption equilibrium represents an important parameter, we analyzed the effect of contact time on the adsorption capacity of CS-GG beads for Fe(II) and Cu(II). The removal of Fe(II) and Cu(II) from the solution in relation to the contact time is presented in Figure 5(c). The results showed that the maximum adsorption was following the order Cu(II) > Fe(II) at all time intervals. It also showed that an increase in the agitation time improved the removal of these
metal ions until reaching equilibrium after 120 min and 180 min, respectively, for Fe(II) and Cu(II). The adsorption equilibrium between the two metals was different, since Cu(II) had a greater affinity for thiol hydroxyl and amino groups [71, 72].
3.2.7. Adsorption Kinetic Analysis. The kinetic rates were analyzed to provide information on the adsorption mechanism such as the rate-limiting step including the diffusion control, the chemical reaction, and the particle diffusion. To evaluate the kinetic mechanism controlling the adsorption process, the experimental data were ana-lyzed by using the pseudo-first-order, the pseudo-second-order, and the intraparticle diffusion kinetic models. The parameters k1, k2, and kid and R2 values of the kinetic models were presented in Table 3. The data plot of the pseudo-first-order model was linear with R2< 0.99, sug-gesting that the adsorption of both Fe(II) and Cu(II) did not follow this model. The value of the linear regression coefficient R2 was higher than 0.99 and closer to 1 (0.99 < R2< 1), which suggested that the adsorption of ions followed the pseudo-second-order model describing chemisorption. Such adsorption mechanism involved the valence forces by sharing or exchanging electrons between the metals and the adsorbent without any mass transfer in solution [23, 73].
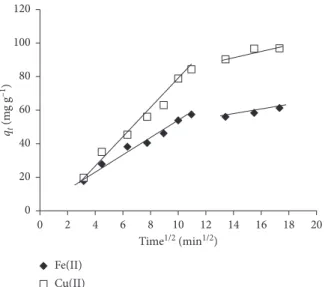
The results in Figure 6 presented the plots of Fe(II) and Cu(II) adsorbed per unit mass of CS-GG versus t0.5(min0.5). The change of qtindicated that the adsorption reaction for
both metal ions had two steps. Each linear portion of the curve of qt as a function of t0.5 corresponded to a step. It
suggested that the first step described the adsorption process at the surface of CS-GG beads. In the second step, pro-gressive adsorption did occur during which the intraparticle diffusion had control over the speed of the reaction [74]. However, the intraparticular diffusion would become the limiting step only if the curve did pass through the origin. In fact, the two curves (Figure 6) did not go through the origin, Table 2: Parameters of Langmuir and Freundlich isotherms for the adsorption reaction of Fe(II) and Cu(II) onto CS-GG beads.
Metal ions Langmuir
Temp.°K Measured qmaxmg·g−1 K
LL·mg−1 qmaxmg·g−1 RL R2 Fe(II) 293 126.4 0.0046 208.33 0.666 0.975 303 147.5 0.0071 212.77 0.530 0.988 313 152.3 0.0055 243.90 0.578 0.981 Cu(II) 293 156.4 0.0070 217.39 0.526 0.977 303 189.5 0.0076 263.15 0.522 0.995 313 199.0 0.0072 277.77 0.520 0.974 Freundlich Temp.°K Ln KF n R2 Fe(II) 293 303 0.212 1.16 0.960 313 0.332 1.03 0.969 Cu(II) 293 1.178 1.47 0.974 303 1.235 1.40 0.981 313 1.418 1.43 0.979
Experimental condition: volume 50 mL; pH5 for Fe(II) and 6 for Cu(II), [Fe(II), Cu(II)] � 10–400 mgL−1; adsorbent net mass � 0.030 g; temperature � 293, 303, and 313°K; contact time � 2 h, shaking rate � 150 rpm.
which might be due to the difference in the rate of mass transfer at the initial and final stages of the adsorption re-action. Moreover, it indicated that the internal diffusion was not the only step controlling the reaction speed in our study. A similar result was reported by Debnath et al. [57]. Therefore, the adsorption reaction of both Fe(II) and Cu(II) at the surface of CS-GG beads was correlated with the initial metal concentration.
3.2.8. Comparative Studies. The adsorption capacity of CS-GG beads was dependent on its chemical structure and the number of functional groups at the surface of the polymer. Thus, we compared the maximal adsorption capacity of different CS-modified beads with our new CS-GG beads (Table 4). The maximum adsorption capacity of Fe(II) on
CS-GG beads was the highest when compared to the other CS beads. In fact, this adsorption capacity was related to the concentration of GSH added to the formulation. As shown in Figure 7, a significant difference was noticed between the adsorption of metals on CS beads without GSH and CS-GG beads, which was correlated with the amount of function-alized GSH on CS-GG beads. In fact, it is well known that GSH can make complexes with metals due to the amino acid cysteine present in the c-Glu-Cys-Gly structure [44, 45]. Concerning the removal of Cu(II), only the CS nanofibrils had a higher adsorption capacity than our CS-GG beads. Therefore, a comparison between our study and previous reports clearly indicated that the CS-GG beads were an effective adsorbent for the removal of Cu(II) and Fe(II) from aqueous solution.
Table 3: Kinetic parameters of the pseudo-first-order, the pseudo-second-order, and the internal diffusion models. Pseudo-first-order model k1min−1 qe1mg · g−1 R2 Fe(II) 0.085 60.95 0.976 Cu(II) 0.056 82.27 0.983 Pseudo-second-order model k2g · mg−1·min−1 qe2mg · g−1 R2 Fe(II) 0.6 10−3 66.67 0.997 Cu(II) 0.12 10−3 125.00 0.994 Intraparticle diffusion Kidmg · g−1·min−1 0.5 Cmg · g−1 R2 Kid1 Kid2 R21 R22 Fe(II) 4.906 1.344 3.596 0.990 0.991 Cu(II) 6.658 2.484 2.721 0.989 0.936
Experimental condition: volume 50 mL; pH � 5 for Fe(II) and 6 for Cu(II); [Fe(II), Cu(II)] � 100 mgL−1; adsorbent net mass � 0.030 g; temperature � 293°K;
contact time � 10 min, during 5 h; shaking rate � 150 rpm.
Fe(II) Cu(II) 2 4 6 8 10 12 14 16 18 20 0 Time1/2 (min1/2) qt (m g g –1) 0 20 40 60 80 100 120
Figure 6: Internal diffusion indicated by the plot of qtof Fe(II) and Cu(II) in relation to the time.
Table 4: Maximum adsorption capacity of different modified chitosan adsorbents for Fe(II) and Cu(II) in aqueous solution.
Adsorbent qmax(mg · g−1)
Fe(II) Chitosan cross-linked with glutaraldehyde [75] 47.25 Chitosan cross-linked with epichlorohydrin [75] 57.47 Chitosan cross-linked with ethylene glycol
diglycidyl ether [75] 38.61
Mayflower seed carbon [76] 49.75
Functionalized-glutathione on chitosan-genipin
cross-linked beads (CS-GG) 126.4
Cu(II)
Chitosan nanofibrils [23] 168.7
Tannin-phenolic immobilized on cellulose [77] 55.97 Chitosan/polyvinylalcohol/polyethyleneimine
membrane [78] 86.08
Magnetic-epichlorohydrin cross-linked chitosan
[14] 123.10
Chitosan cross-linked with
epichlorohydrin-triphosphate [79] 130.72
Functionalized-glutathione on chitosan-genipin
4. Conclusions
In this study, we used the natural cross-linker genipin to successfully cross-link CS beads before to be functionalized with GSH. The newly formed CS-GG beads were charac-terized and tested as an adsorbent for the removal of Fe(II) and Cu(II) from aqueous solutions. We demonstrated that different parameters affected the adsorption reaction on the beads such as the pH, the contact time, the temperature, and the initial concentration of metals. According to the ob-tained results, the optimum pH for the adsorption of Fe(II) and Cu(II) was 5 and 6, respectively. In addition, the pseudo-second-order equation gave the best correlation coefficient, indicating that the chemical adsorption process was the rate-limiting step without a mass transfer in solution. The ad-sorption reaction of Fe(II) and Cu(II) was dependent on the temperature degree. Moreover, our results suggested that the Langmuir isotherm was the best fitting model with the acquired adsorption data for both tested metals than the Freundlich isotherm. According to the Langmuir isotherm, the maximum adsorption capacities of Fe(II) and Cu(II) evaluated on CS-GG beads were 208.33 and 217 mg·g−1, respectively. Based on the thermodynamic analysis, we showed that the adsorption process was spontaneous and endothermic. Therefore, this study demonstrated that the new synthesized CS-GG beads can be used as an efficient adsorbent for trace metals in aqueous solution. In this perspective, this new material should be further tested for the joint removal of a mixture of trace metals in solution to be applied for water decontamination.
Data Availability
The datasets analyzed in this manuscript are available on request to the corresponding author.
Conflicts of Interest
The authors declare that there are no conflicts of interest regarding the publication of this paper.
Acknowledgments
This study was financially supported by the Individual Discovery Grant awarded to Prof. David Dewez from the Natural Sciences and Engineering Research Council of Canada (NSERC, RGPIN 415572-2013).
Supplementary Materials
Figure S1: thermodynamic plots of −ΔG° in relation to
temperature (°K). Figure S2: Langmuir plots of experimental
data of Ce/qeversus Cefor Fe(II) and Cu(II) adsorption on
CS-GG beads. Figure S3: Freundlich plots of experimental data showing Ln qeversus Ln Cefor the adsorption of Fe(II)
and Cu(II) on CS-GG beads. Figure S4: pseudo-first-order of the adsorption of Fe(II) (a) and Cu(II) (b) on CS-GG beads. Figure S5: pseudo-second-order of the adsorption of Fe(II) (a) and Cu(II) (b) on CS-GG beads. (Supplementary Materials)
References
[1] J. P. Vareda, A. J. M. Valente, and L. Durães, “Assessment of heavy metal pollution from anthropogenic activities and re-mediation strategies: a review,” Journal of Environmental
Management, vol. 246, pp. 101–118, 2019.
[2] K. H. Vardhan, P. S. Kumar, and R. C. Panda, “A review on heavy metal pollution, toxicity and remedial measures: cur-rent trends and future perspectives,” Journal of Molecular
Liquids, vol. 290, p. 111197, 2019.
[3] M. A. Hassaan, A. El Nemr, and F. F. Madkour, “Environ-mental assessment of heavy metal pollution and human health risk,” American Journal of Water Science and Engineering, vol. 2, no. 3, pp. 14–19, 2016.
[4] C. Andreini, I. Bertini, G. Cavallaro, G. L. Holliday, and J. M. Thornton, “Metal ions in biological catalysis: from enzyme databases to general principles,” JBIC Journal of Biological
Inorganic Chemistry, vol. 13, no. 8, pp. 1205–1218, 2008.
[5] C. Ferousi, S. Lindhoud, F. Baymann, B. Kartal, M. S. Jetten, and J. Reimann, “Iron assimilation and utilization in anaer-obic ammonium oxidizing bacteria,” Current Opinion in
Chemical Biology, vol. 37, pp. 129–136, 2017.
[6] N. Raffa, N. Osherov, and N. P. Keller, “Copper utilization, regulation, and acquisition by Aspergillus fumigatus,”
In-ternational Journal of Molecular Sciences, vol. 20, no. 8,
p. 1980, 2019.
[7] World Health Organization, “Acceptability aspects: taste, odour and appearance,” Guidelines for Driking-Water Quality
(GDWQ), pp. 219–350, WHO Library
Cataloguing-in-Pub-lication Data, Geneva, Switzerland, 4th edition, 2011. [8] G. Michalakos, J. M. Nieva, D. Vayenas, and G. Lyberatos,
“Removal of iron from potable water using a trickling filter,”
Water Research, vol. 31, no. 5, pp. 991–996, 1997.
[9] J. Hartmann, F. Braulke, U. Sinzig et al., “Iron overload impairs proliferation of erythroid progenitors cells (BFU-E) from patients with myelodysplastic syndromes,” Leukemia
Research, vol. 37, no. 3, pp. 327–332, 2013.
[10] M. Araya, B. Chen, L. M. Klevay et al., “Confirmation of an acute no-observed-adverse-effect and low-observed-adverse-effect level for copper in bottled drinking water in a multi-site international study,” Regulatory Toxicology and
Pharmacol-ogy, vol. 38, no. 3, pp. 389–399, 2003.
0 1 2 4 6 [GSH] mg mL–1 0 20 40 60 80 100 120 Remo val ef ficienc y (%)
Figure 7: The adsorption of Fe(II) on genipin (blank) and CS-GG beads (dashes) functionalized with different concentrations of GSH. The error bars represent the standard deviation of mea-surements for three sample runs (n � 3).
[11] A. Dorsey and L. Ingerman, Toxicological Profile for Copper, ATSDR, Atlanta, GA, USA, 2004.
[12] Z. Mehrani, H. Ebrahimzadeh, A. A. Asgharinezhad, and E. Moradi, “Determination of copper in food and water sources using poly m-phenylenediamine/CNT electrospun nanofiber,” Microchemical Journal, vol. 149, p. 103975, 2019. [13] F. Fu and Q. Wang, “Removal of heavy metal ions from wastewaters: a review,” Journal of Environmental
Manage-ment, vol. 92, no. 3, pp. 407–418, 2011.
[14] Y. Gutha, Y. Zhang, W. Zhang, and X. Jiao, “Magnetic-epi-chlorohydrin crosslinked chitosan schiff’s base (m-ECCSB) as a novel adsorbent for the removal of Cu(II) ions from aqueous environment,” International Journal of Biological
Macro-molecules, vol. 97, pp. 85–98, 2017.
[15] G. K. Sarma, S. Sen Gupta, and K. G. Bhattacharyya, “Nanomaterials as versatile adsorbents for heavy metal ions in water: a review,” Environmental Science and Pollution
Re-search, vol. 26, no. 7, pp. 6245–6278, 2019.
[16] N. G. Kandile and A. S. Nasr, “New hydrogels based on modified chitosan as metal biosorbent agents,” International
Journal of Biological Macromolecules, vol. 64, pp. 328–333,
2014.
[17] A. K. Rathoure, J. Anuradha, R. Sanjeevi, D. S. Chauhan, and S. Tripathi, “Effective removal of heavy metals from aqueous solution by nano-composites: bioremediation using nano technology,” in Biostimulation Remediation Technologies for
Groundwater Contaminants, pp. 249–258, IGI Global,
Her-shey, PA, USA, 2018.
[18] B. Wang, Z. Bai, H. Jiang et al., “Selective heavy metal removal and water purification by microfluidically-generated chitosan microspheres: characteristics, modeling and application,”
Journal of Hazardous Materials, vol. 364, pp. 192–205, 2019.
[19] V. Alimohammadi, M. Sedighi, and E. Jabbari, “Experimental study on efficient removal of total iron from wastewater using magnetic-modified multi-walled carbon nanotubes,”
Ecolog-ical Engineering, vol. 102, pp. 90–97, 2017.
[20] R. El Haouti, Z. Anfar, A. Chennah et al., “Synthesis of sustainable mesoporous treated fish waste as adsorbent for copper removal,” Groundwater for Sustainable Development, vol. 8, pp. 1–9, 2019.
[21] Y. Sun, K. J. Shah, W. Sun, and H. Zheng, “Performance evaluation of chitosan-based flocculants with good pH re-sistance and high heavy metals removal capacity,” Separation
and Purification Technology, vol. 215, pp. 208–216, 2019.
[22] G. Z. Kyzas, G. Bomis, R. I. Kosheleva et al., “Nanobubbles effect on heavy metal ions adsorption by activated carbon,”
Chemical Engineering Journal, vol. 356, pp. 91–97, 2019.
[23] D. Liu, Z. Li, Y. Zhu, Z. Li, and R. Kumar, “Recycled chitosan nanofibril as an effective Cu(II), Pb(II) and Cd(II) ionic chelating agent: adsorption and desorption performance,”
Carbohydrate Polymers, vol. 111, pp. 469–476, 2014.
[24] H. L. Vasconcelos, V. T. F´avere, N. S. Gonçalves, and M. C. M. Laranjeira, “Chitosan modified with Reactive Blue 2 dye on adsorption equilibrium of Cu(II) and Ni(II) ions,”
Reactive and Functional Polymers, vol. 67, no. 10, pp. 1052–
1060, 2007.
[25] S. Gu, X. Kang, L. Wang, E. Lichtfouse, and C. Wang, “Clay mineral adsorbents for heavy metal removal from wastewater: a review,” Environmental Chemistry Letters, vol. 17, no. 2, pp. 629–654, 2019.
[26] Z. Anfar, A. Amedlous, A. Ait El Fakir et al., “Combined methane energy recovery and toxic dye removal by porous carbon derived from anaerobically modified digestate,” ACS
Omega, vol. 4, no. 5, pp. 9434–9445, 2019.
[27] Z. Anfar, M. Zbair, H. A. Ahsaine et al., “Preparation and characterization of porous carbon@ZnO-NPs for organic compounds removal: classical adsorption versus ultrasound assisted adsorption,” ChemistrySelect, vol. 4, no. 17, pp. 4981–4994, 2019.
[28] H. Haffad, M. Zbair, Z. Anfar, H. Ait Ahsaine, H. Bouhlal, and K. Hamza, “Removal of reactive red-198 dye using chitosan as an adsorbent: optimization by central composite design coupled with response surface methodology,” Toxin Reviews, vol. 1-13, 2019.
[29] K. Manzoor, M. Ahmad, S. Ahmad, and S. Ikram, “Removal of Pb(ii) and Cd(ii) from wastewater using arginine cross-linked chitosan-carboxymethyl cellulose beads as green adsorbent,”
RSC Advances, vol. 9, no. 14, pp. 7890–7902, 2019.
[30] L. Zhang, Y. Zeng, and Z. Cheng, “Removal of heavy metal ions using chitosan and modified chitosan: a review,” Journal
of Molecular Liquids, vol. 214, pp. 175–191, 2016.
[31] A. S. Pedro, E. Cabral-Albuquerque, D. Ferreira, and B. Sarmento, “Chitosan: an option for development of es-sential oil delivery systems for oral cavity care?” Carbohydrate
Polymers, vol. 76, no. 4, pp. 501–508, 2009.
[32] S. Pap, C. Kirk, B. Bremner et al., “Synthesis optimisation and characterisation of chitosan-calcite adsorbent from fishery-food waste for phosphorus removal,” Environmental Science
and Pollution Research, vol. 27, no. 9, 2020.
[33] E. Igberase, A. Ofomaja, and P. O. Osifo, “Enhanced heavy metal ions adsorption by 4‑aminobenzoic acid grafted on chitosan/epichlorohydrin composite: kinetics, isotherms, thermodynamics and desorption studies,” International Journal
of Biological Macromolecules, vol. 123, pp. 664–676, 2019.
[34] G. Mart´ınez-Mej´ıa, N. A. V´azquez-Torres, A. Castell-Rodr´ıguez, J. M. del R´ıo, M. Corea, and R. Jim´enez-Ju´arez, “Synthesis of new chitosan-glutaraldehyde scaffolds for tissue engineering using Schiff reactions,” Colloids and Surfaces A:
Physicochemical and Engineering Aspects, vol. 579, p. 123658,
2019.
[35] E. Guibal, “Interactions of metal ions with chitosan-based sorbents: a review,” Separation and Purification Technology, vol. 38, no. 1, pp. 43–74, 2004.
[36] N. Li and R. Bai, “Copper adsorption on chitosan-cellulose hydrogel beads: behaviors and mechanisms,” Separation and
Purification Technology, vol. 42, no. 3, pp. 237–247, 2005.
[37] Q. Jiang, N. Reddy, S. Zhang, N. Roscioli, and Y. Yang, “Water-stable electrospun collagen fibers from a non-toxic solvent and crosslinking system,” Journal of Biomedical Materials Research
Part A, vol. 101A, no. 5, pp. 1237–1247, 2013.
[38] L. Rachmawati and M. Udkhiyati, “Toxicity test of chromium and glutaraldehyde to determine greener chemical in tannery industry,” Materials Science Forum, vol. 901, pp. 160–165, 2017.
[39] Y. Sun, C. Zhu, W. Sun et al., “Plasma-initiated polymeri-zation of chitosan-based CS-g-P(AM-DMDAAC) flocculant for the enhanced flocculation of low-algal-turbidity water,”
Carbohydrate Polymers, vol. 164, pp. 222–232, 2017.
[40] R. A. A. Muzzarelli, F. Tanfani, S. Mariotti, and M. Emanuelli, “Preparation and characteristic properties of dithiocarbamate chitosan, a chelating polymer,” Carbohydrate Research, vol. 104, no. 2, pp. 235–243, 1982.
[41] E. Guibal, N. Von Offenberg Sweeney, T. Vincent, and J. M. Tobin, “Sulfur derivatives of chitosan for palladium sorption,” Reactive and Functional Polymers, vol. 50, no. 2, pp. 149–163, 2002.
[42] G. C´ardenas, P. Orlando, and T. Edelio, “Synthesis and ap-plications of chitosan mercaptanes as heavy metal retention
agent,” International Journal of Biological Macromolecules, vol. 28, no. 2, pp. 167–174, 2001.
[43] Y. G. Abou El-Reash, “Magnetic chitosan modified with cysteine-glutaraldehyde as adsorbent for removal of heavy metals from water,” Journal of Environmental Chemical
En-gineering, vol. 4, no. 4, pp. 3835–3847, 2016.
[44] H. C. Park, J. E. Hwang, Y. Jiang et al., “Functional charac-terisation of two phytochelatin synthases in rice ( Oryza sativa cv. Milyang 117) that respond to cadmium stress,” Plant
Biology, vol. 21, no. 5, pp. 854–861, 2019.
[45] M. A. Younes, L. A. Nicaise, and M. B. Bertrand, “Poly-merization degree of phytochelatin in contaminated soil phytoremediation of manganese in Hibiscus sabdariffa linn var sabdariffa,” European Scientific Journal, ESJ, vol. 12, no. 33, pp. 482–492, 2016.
[46] F.-L. Mi, H.-W. Sung, S.-S. Shyu, C.-C. Su, and C.-K. Peng, “Synthesis and characterization of biodegradable TPP/genipin co-crosslinked chitosan gel beads,” Polymer, vol. 44, no. 21, pp. 6521–6530, 2003.
[47] A. Khan, S. Salmieri, C. Fraschini, J. Bouchard, B. Riedl, and M. Lacroix, “Genipin cross-linked nanocomposite films for the immobilization of antimicrobial agent,” ACS Applied
Materials & Interfaces, vol. 6, no. 17, pp. 15232–15242, 2014.
[48] J. Roether, C. Oelschlaeger, and N. Willenbacher, “Hyaluronic acid cryogels with non-cytotoxic crosslinker genipin,”
Ma-terials Letters: X, vol. 4, p. 100027, 2019.
[49] Z. Aksu, “Determination of the equilibrium, kinetic and thermodynamic parameters of the batch biosorption of nickel(II) ions onto Chlorella vulgaris,” Process Biochemistry, vol. 38, no. 1, pp. 89–99, 2002.
[50] E. Osagie and C. N. Owabor, “Adsorption of benzene in batch system in natural clay and sandy soil,” Advances in Chemical
Engineering and Science, vol. 5, no. 3, pp. 352–361, 2015.
[51] L. Largitte and R. Pasquier, “A review of the kinetics ad-sorption models and their application to the adad-sorption of lead by an activated carbon,” Chemical Engineering Research
and Design, vol. 109, pp. 495–504, 2016.
[52] S. K. Lagergren, “About the theory of so-called adsorption of soluble substances,” Sven Vetenskapsakad Handingarl, vol. 24, pp. 1–39, 1898.
[53] Y. S. Ho and G. McKay, “Pseudo-second order model for sorption processes,” Process Biochemistry, vol. 34, no. 5, pp. 451–465, 1999.
[54] W. J. Weber and J. C. Morris, “Kinetics of adsorption on carbon from solution,” Journal of the Sanitary Engineering
Division, vol. 89, pp. 31–60, 1963.
[55] S. Canzano, P. Iovino, S. Salvestrini, and S. Capasso, “Comment on “Removal of anionic dye Congo red from aqueous solution by raw pine and acid-treated pine cone powder as adsorbent: equilibrium, thermodynamic, kinetics, mechanism and process design,” Water Research, vol. 46, no. 13, pp. 4314-4315, 2012.
[56] S. Dawood and T. K. Sen, “Removal of anionic dye Congo red from aqueous solution by raw pine and acid-treated pine cone powder as adsorbent: equilibrium, thermodynamic, kinetics, mechanism and process design,” Water Research, vol. 46, no. 6, pp. 1933–1946, 2012.
[57] S. Debnath, A. Maity, and K. Pillay, “Magnetic chitosan-GO nanocomposite: synthesis, characterization and batch ad-sorber design for Cr(VI) removal,” Journal of Environmental
Chemical Engineering, vol. 2, no. 2, pp. 963–973, 2014.
[58] M. Fernandes Queiroz, K. Melo, D. Sabry, G. Sassaki, and H. Rocha, “Does the use of chitosan contribute to oxalate
kidney stone formation?” Marine Drugs, vol. 13, no. 1, pp. 141–158, 2014.
[59] Z. M. Dos Santos, A. L. P. F. Caroni, M. R. Pereira, D. R. da Silva, and J. L. C. Fonseca, “Determination of deacetylation degree of chitosan: a comparison between conductometric titration and CHN elemental analysis,” Carbohydrate
Re-search, vol. 344, no. 18, pp. 2591–2595, 2009.
[60] M. N. Saifuddin and P. Kumaran, “Removal of heavy metal from industrial wastewater using chitosan coated oil palm shell charcoal,” Electronic Journal of Biotechnology, vol. 8, pp. 43–53, 2005.
[61] G. A. Mahmoud, “Adsorption of copper(II), lead(II), and cadmium(II) ions from aqueous solution by using hydrogel with magnetic properties,” Monatshefte f¨ur Chem-ie—Chemical Monthly, vol. 144, no. 8, pp. 1097–1106, 2013.
[62] Z. Cheng, X. Liu, M. Han, and W. Ma, “Adsorption kinetic character of copper ions onto a modified chitosan transparent thin membrane from aqueous solution,” Journal of Hazardous
Materials, vol. 182, no. 1-3, pp. 408–415, 2010.
[63] Y.-M. Hao, C. Man, and Z.-B. Hu, “Effective removal of Cu (II) ions from aqueous solution by amino-functionalized magnetic nanoparticles,” Journal of Hazardous Materials, vol. 184, no. 1-3, pp. 392–399, 2010.
[64] X. Jiao, Y. Gutha, and W. Zhang, “Application of chitosan/ poly(vinyl alcohol)/CuO (CS/PVA/CuO) beads as an adsor-bent material for the removal of Pb(II) from aqueous envi-ronment,” Colloids and Surfaces B: Biointerfaces, vol. 149, pp. 184–195, 2017.
[65] M. Monier, D. M. Ayad, and D. A. Abdel-Latif, “Adsorption of Cu(II), Cd(II) and Ni(II) ions by cross-linked magnetic chitosan-2-aminopyridine glyoxal Schiff’s base,” Colloids and
Surfaces B: Biointerfaces, vol. 94, pp. 250–258, 2012.
[66] N. ¨Unl¨u and M. Ersoz, “Adsorption characteristics of heavy metal ions onto a low cost biopolymeric sorbent from aqueous solutions,” Journal of Hazardous Materials, vol. 136, no. 2, pp. 272–280, 2006.
[67] M. Uysal and I. Ar, “Removal of Cr(VI) from industrial wastewaters by adsorption,” Journal of Hazardous Materials, vol. 149, no. 2, pp. 482–491, 2007.
[68] I. M. N. Vold, K. M. V˚arum, E. Guibal, and O. Smidsrød, “Binding of ions to chitosan-selectivity studies,” Carbohydrate
Polymers, vol. 54, no. 4, pp. 471–477, 2003.
[69] A. J. Varma, S. V. Deshpande, and J. F. Kennedy, “Metal complexation by chitosan and its derivatives: a review,”
Carbohydrate Polymers, vol. 55, no. 1, pp. 77–93, 2004.
[70] L. Zhou, Y. Wang, Z. Liu, and Q. Huang, “Characteristics of equilibrium, kinetics studies for adsorption of Hg(II), Cu(II), and Ni(II) ions by thiourea-modified magnetic chitosan microspheres,” Journal of Hazardous Materials, vol. 161, no. 2-3, pp. 995–1002, 2009.
[71] V. W. D. Chui, K. W. Mok, C. Y. Ng, B. P. Luong, and K. K. Ma, “Removal and recovery of copper(II), chromiu-m(III), and nickel(II) from solutions using crude shrimp chitin packed in small columns,” Environment International, vol. 22, no. 4, pp. 463–468, 1996.
[72] B. Hultberg, A. Andersson, and A. Isaksson, “Copper ions differ from other thiol reactive metal ions in their effects on the concentration and redox status of thiols in HeLa cell cultures,” Toxicology, vol. 117, no. 2-3, pp. 89–97, 1997. [73] M. Hasan, A. L. Ahmad, and B. H. Hameed, “Adsorption of
reactive dye onto cross-linked chitosan/oil palm ash com-posite beads,” Chemical Engineering Journal, vol. 136, no. 2-3, pp. 164–172, 2008.
[74] S. J. Allen, G. McKay, and K. Y. H. Khader, “Intraparticle diffusion of a basic dye during adsorption onto sphagnum peat,” Environmental Pollution, vol. 56, no. 1, pp. 39–50, 1989. [75] W. S. W. Ngah, S. Ab Ghani, and A. Kamari, “Adsorption behaviour of Fe(II) and Fe(III) ions in aqueous solution on chitosan and cross-linked chitosan beads,” Bioresource
Technology, vol. 96, no. 4, pp. 443–450, 2005.
[76] P. Shanmughaprabha, S. Sasireka, S. Sabarathinam, and G. Selvakumari, “Efficiency of may flower seed carbon to uptake Fe(II) from aqueous solution: kinetic and isotherm studies,” Environmental Progress & Sustainable Energy, vol. 38, pp. S243–S249, 2018.
[77] P. Zhou, H. Yuan, L. Ou, and P. Zhiyuan, “Removal of Cd(II) and Cu(II) ions from aqueous solutions using tannin-phe-nolic polymer immobilized on cellulose,” Journal of
Macro-molecular Science, Part A, vol. 56, no. 7, pp. 717–722, 2019.
[78] N. Sahebjamee, M. Soltanieh, S. M. Mousavi, and A. Heydarinasab, “Removal of Cu2+, Cd2+ and Ni2+ ions from aqueous solution using a novel chitosan/polyvinyl al-cohol adsorptive membrane,” Carbohydrate Polymers, vol. 210, pp. 264–273, 2019.
[79] R. Laus, T. G. Costa, B. Szpoganicz, and V. T. F´avere, “Ad-sorption and de“Ad-sorption of Cu(II), Cd(II) and Pb(II) ions using chitosan crosslinked with epichlorohydrin-triphosphate as the adsorbent,” Journal of Hazardous Materials, vol. 183, no. 1-3, pp. 233–241, 2010.