UMR 225 IRD - Paris-Dauphine
UMR DIAL 225
Place du Maréchal de Lattre de Tassigny 75775 • Paris Cedex 16 •Tél. (33) 01 44 05 45 42 • Fax (33) 01 44 05 45 45 • 4, rue d’Enghien • 75010 Paris • Tél. (33) 01 53 24 14 50 • Fax (33) 01 53 24 14 51
E-mail : [email protected] • Site : www.dial.prd.fr
D
OCUMENT DE
T
RAVAIL
DT/2014-14
Segmentation and informality in
Vietnam: A survey of the literature
Jean-Pierre CLING
Mireille RAZAFINDRAKOTO
François ROUBAUD
SEGMENTATION AND INFORMALITY IN VIETNAM: A SURVEY OF THE LITERATURE
Jean-Pierre Cling
CEPN, Université Paris Nord-CNRS PSL, Université Paris-Dauphine, LEDa, IRD UMR DIAL, 75016 Paris, France
Mireille Razafindrakoto IRD, UMR DIAL, 75010 Paris PSL, Université Paris-Dauphine, LEDa, UMR DIAL, 75016 Paris, France
François Roubaud IRD, UMR DIAL, 75010 Paris PSL, Université Paris-Dauphine, LEDa, UMR DIAL, 75016 Paris, France
Document de travail UMR DIAL
Novembre 2014
Abstract
Labour market segmentation is usually defined as the division of the labour markets into separate sub-markets or segments, distinguished by different characteristics and behavioural rules (incomes, contracts, etc.). The economic debate on the segmentation issue has been focusing in developed countries, and especially in Europe, on contractual segmentation and dualism. However, in developing countries such as Vietnam which is the focus of this study, wage work is marginal and the approach to labour market segmentation is necessarily slightly different. Indeed, most workers are engaged in the informal economy and many of them are self-employed in their own household business. Starting with an analysis of the main characteristics of the national labour market, this paper presents a survey of the literature on informality and labour market segmentation in Vietnam (section 2). Section 3 describes the institutional background related to firm registration and social protection in Vietnam, and analyses the reasons for informality in relationship with the institutional framework. Section 4 describes the reforms being put in place and employment strategies related to the informal economy. Policy recommendations are proposed in the last section.
Key words: Informality, Labour market, segmentation, Vietnam Résumé
La segmentation sur le marché du travail est usuellement définie comme la coexistence de deux segments ou secteurs qui se distinguent par leurs caractéristiques et les comportements qui y prévalent (niveau de revenus, contrats, etc.). Le débat économique sur la segmentation s’est focalisé dans les pays développés, et en particulier en Europe, sur le dualisme résultant des contrats. Cependant, dans les pays en développement comme le Vietnam, les emplois salariés étant marginaux, la segmentation sur le marché du travail doit nécessairement être appréhendée de manière différente. La majorité des emplois relève de l’économie informelle et une grande partie est constituée d’auto-emploi dans des entreprises individuelles. Partant d’une analyse des principales caractéristiques du marché du travail national, ce document présente ensuite une revue de la littérature sur l’informalité et la segmentation sur le marché du travail au Vietnam (section 2). La section 3 décrit le cadre institutionnel en matière d’enregistrement et de protection sociale au Vietnam, et analyse les raisons de l’informalité. La section 4 examine les réformes qui ont été mises en place et les stratégies en termes d’emploi touchant l’économie informelle. Enfin, des recommandations politiques sont proposées dans la dernière section.
1.
Introduction
Labour market segmentation is usually defined as the division of the labour markets into separate sub-markets or segments, distinguished by different characteristics and behavioural rules (incomes, contracts, etc.). The economic debate on the segmentation issue has been focusing in developed countries, and especially in Europe, on contractual segmentation and dualism. However, in developing countries such as Vietnam which is the focus of this study, wage work (even more so formal wage work) is marginal and the approach to labour market segmentation is necessarily slightly different. Indeed, most workers are engaged in the informal economy and many of them are self-employed in their own household business.
These specificities make the analysis of labour segmentation more complex: segmentation does not refer to labour contracts only (as they are marginal) but it must take into account more generally the degree of enforcement of labour market institutions according to different employment modalities. This means especially analysing potential discriminations (in terms of income and labour conditions) as well as their determinants, in order to detect dualism on the labour market between coexisting formal and informal segments, the latter representing a predominant share of employment (see especially Lewis (1954) on duality).
Given the blurred contours of this concept in academic work, it is important to start with giving it the precise definition of informality adopted in Vietnam and used in this study. In keeping with international definitions (ILO 1993, 2003), the informal sector is defined as the whole of non-agricultural individual enterprises which produce at least in part for the market and are not registered (no business license), and this stands for wherever the activity is carried out (on professional premises, in the street, or at home). The non-registration of certain activities does in no way suppose that they are illegal, to the extent that when operating within a certain level of activity, individual enterprises are not obliged to be registered nor to pay taxes. Informal employment is, for its part, defined as work without any social protection. On account of these definitions, 2 informal employment is comprised of two distinct principal components, namely employment in the informal sector, as well as unprotected employment in the formal sector. In conformity with the definitions of the ILO (2003), the informal sector and employment together make up what is designated as the informal economy. According to Cling et al. (2012a), the informal sector represents 24 per cent of total employment (that is nearly half of non-agricultural employment) and informal employment 81 per cent of total employment in Vietnam in 2009.
Following Fields (2007), the concept of income segmentation is used here to refer to labour income differentials that are not explained by the workers’ individual attributes. That is to say, income gaps associated with certain characteristics of the job. In particular, the question addressed in this report is whether two workers with equal personal attributes obtain different remunerations because one works in the formal sector and the other in the informal sector. The same way of reasoning is applied to labour income differentials between informal and formal employment (for the study of South
2
These operational definitions have been adopted by the GSO and used in the Labour force surveys since 2007 (ILO, 2010, p. 16).
America, see Maurizio, 2012). Segmentation is also related to a lack of connection between sectors, as indicated by low mobility from one segment to another.
To our knowledge, there are only two econometric studies on this subject in Vietnam, both concluding that there is indeed income segmentation between the informal/formal economy (Nguyen et al., 2011; Rand and Torm, 2012a). However, Nguyen et al. (ibid), consider that labour market segmentation is close to Latin American countries (which are middle income countries like Vietnam since 2010) and much less pronounced than in Sub-Saharan Africa where segmentation is very high.
As underlined by Maurizio (2012), informality defined according to any of the two approaches (informal sector or employment) is consistent with both situations – with and without income segmentation. For example, informality without segmentation could take place in at least two cases: were there no restrictions, the excess of labour that cannot enter the formal sector and thus goes to the informal sector with its lower levels of productivity, would cause a global fall in wages, both in the formal and informal sectors; or if formal and informal wage earners ended up receiving equal net remunerations even when in the second case the employers face additional costs related to labour regulations. In the latter case, workers might voluntarily choose informality because of their (often non-monetary) preferences (see the case of women discussed here below).
The labour market segmentation issue therefore raises the question of the determinants of informality, knowing that two competing theories have traditionally been debated by development economists. The “dualist” approach is based on the model of a dual labour market (Lewis, 1954; Harris and Todaro, 1970), where the informal sector is considered as a subsistence economy which only exists because the formal economy is incapable of offering a sufficient number of jobs (“rationing out of workers”). The alternative view is proposed by the “legalist” approach, which considers that the informal sector is constituted of micro-entrepreneurs who prefer to operate informally in order to escape from economic regulations (de Soto, 1989); this liberal approach contrasts sharply with the two preceding ones in so much as the choice of informality is voluntary and linked to the excessive costs of the legalization process associated with registering and obtaining a formal status. Combining these two contrasting views leads to a multi-segmented approach of the informal economy, composed of a competitive voluntary upper-tier (« exit hypothesis ») coexisting with a lower-tier segment of individuals who do not have access to the formal market (“exclusion hypothesis”) (Rand and Torm, 2012a).
The remainder of this report is organized as follows. Starting with an analysis of the main characteristics of the national labour market, this report presents a survey of the literature on informality and labour market segmentation in Vietnam (section 2). Section 3 describes the institutional background related to firm registration and social protection in Vietnam, and analyses the reasons for informality in relationship with the institutional framework. Section 4 describes the reforms being put in place and employment strategies related to the informal economy. Policy recommendations are proposed in section 5. Five main messages come out from our study:
(1) The analysis of employment in Vietnam conducted in this report confirms that the informal economy provides low earnings and precarious working conditions, without any protection (contract, social protection, etc.) and with a low level of satisfaction. Indicators and econometric estimates available evidence labour market segmentation between the informal and formal economy: one can observe both significant income gaps, especially to the detriment of women, and low mobility from one sector to another. In spite of high economic growth in Vietnam, we do not foresee any decreasing trend of the share of the informal sector in total employment.
(2) The rules for registration of household businesses in Vietnam are vague and not transparent, creating a “grey zone”; not all household businesses have to register, and those earning less than a certain amount set at district level are exempt; however, up to 78 per cent of businesses in the informal sector could be operating illegally, as they are above the threshold and should therefore register. This partly explains the lack of formalization of informal household businesses, knowing that staying informal reduces growth perspectives and productivity, hence increasing segmentation.
(3) Turning now to informal employment (employment without social protection), there is a specific issue concerning formal enterprises where this kind of employment is widely used; although the exact numbers are not precisely known, the majority of informal employment in formal enterprises seems to be related to short term contracts (under 3 months), which do not include social protection. For other employees, social protection is compulsory by law. Direct fraud is not so much on non-declaration as on to the amount to be paid. Under-declaration of wages by enterprises benefits workers who get higher wages, but this above all reflects a lack of knowledge of (or trust in) the advantage of pension systems.
(4) The good news is that employment policies are starting to acknowledge informality in Vietnam, which is a substantial progress (see `New Law focuses on young workers, disadvantaged groups’, 2013). However, public policy measures have still to be defined and implemented. Moreover, they are confronted to the usual dilemma on this subject: if they focus on high productivity sectors in order to speed up economic development, they abandon the majority of the population which is still involved in traditional low productivity activities; the alternative strategy might increase welfare in the short term but to the detriment of long term development.
(5) Our own list of recommendations suggests to fully recognize the role of the informal economy which is here to stay, encourage the formalisation of the informal sector through increased rule transparency, and support the informal sector through targeted policies and an extension of social protection discussed between enterprises and employees. By reducing earning gaps and increasing mobility towards the formal sector, these policies would reduce segmentation on the labour market.
2.
Main characteristics of the labour market in Vietnam
This section analyses the main characteristics of the labour market in Vietnam in terms of quantity and quality of jobs, underlines the predominant weight of the informal sector and informal employment in Vietnam, and analyses the segmentation of the labour market related to informality. It relies principally on data from the official Labour Force Survey (LFS), carried out annually by the General Statistics Office of Vietnam (GSO) since 2007 (see box 1 here below). We also base our analysis on the Vietnam Household Labour Standard Survey (VHLSS), which has been conducted by the GSO every other year since the 1990s. Although it is not an employment survey, it is the only one providing panel data used to measure segmentation.
2.1. Structure of employment by industry and by institutional sector
In Vietnam, as in most developing countries, no time series providing detailed employment data are available, so it is impossible to conduct a reliable in-depth study on employment past trends. Indeed, the first reliable employment survey was conducted by the General Statistics Office (GSO) in 2007 only (LFS2007). There is a large consensus over this diagnostic, which is the reason why the ILO/MOLISA Vietnam Employment Trends report is constrained to study employment dynamics over a very short period going back to 2007 (ILO, 2010).
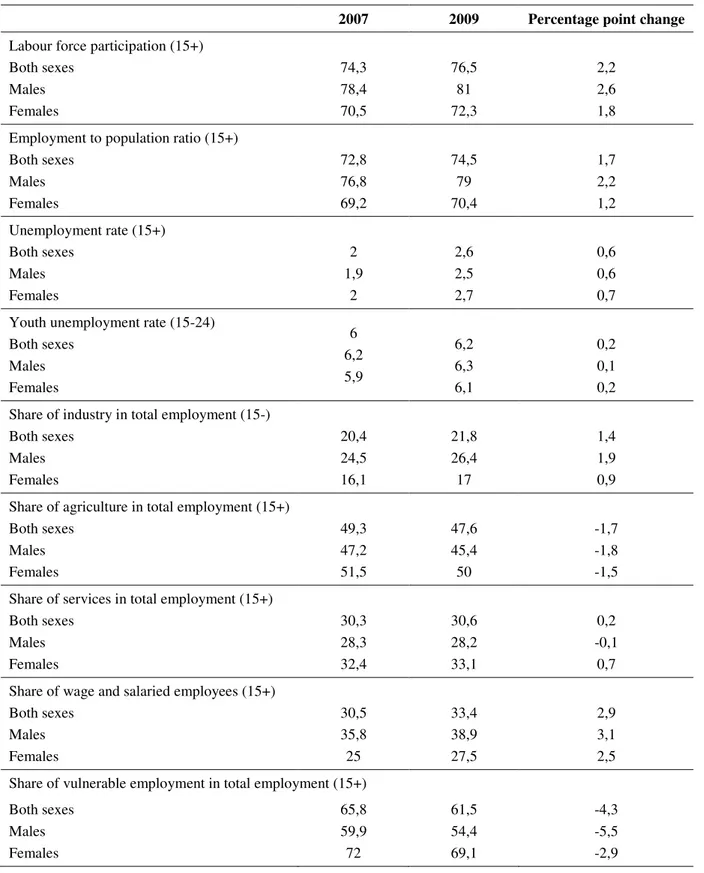
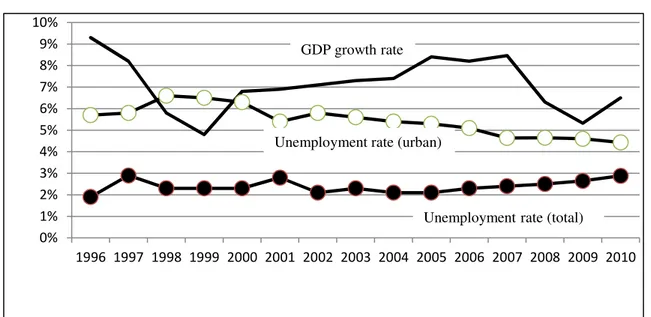
Some selected key indicators drawn for the Vietnam Employment Trends report report are presented in table 1 for 2007-2009. The labour force participation rate, defined as the ratio of the labour force to the working-age population (aged 15 years and above) stands at 76.5 per cent in 2009 (+2.1 percentage points compared to 2007), which is considered to be high if considered from an international perspective, and among the highest in South-East Asia (ILO, 2010; World Bank, 2008). As in other developing countries, because there are almost no public transfers (pensions, unemployment allocations, family allowances, etc.) participation in the labour market is essential to survive. This is also the reason why the unemployment rate is marginal (2.6 per cent at the national level in 2009). The share of wage and salaried employees is still very low (33.9per cent in 2009) but increasing. This latter characteristic is due to the high share of self-employment in agriculture and the informal sector (see below).
Table 1. Selected key indicators of the labour market (2007-2009)
2007 2009 Percentage point change
Labour force participation (15+) Both sexes Males Females 74,3 78,4 70,5 76,5 81 72,3 2,2 2,6 1,8 Employment to population ratio (15+)
Both sexes Males Females 72,8 76,8 69,2 74,5 79 70,4 1,7 2,2 1,2 Unemployment rate (15+) Both sexes Males Females 2 1,9 2 2,6 2,5 2,7 0,6 0,6 0,7 Youth unemployment rate (15-24)
Both sexes Males Females 6 6,2 5,9 6,2 6,3 6,1 0,2 0,1 0,2 Share of industry in total employment (15-)
Both sexes Males Females 20,4 24,5 16,1 21,8 26,4 17 1,4 1,9 0,9 Share of agriculture in total employment (15+)
Both sexes Males Females 49,3 47,2 51,5 47,6 45,4 50 -1,7 -1,8 -1,5 Share of services in total employment (15+)
Both sexes Males Females 30,3 28,3 32,4 30,6 28,2 33,1 0,2 -0,1 0,7 Share of wage and salaried employees (15+)
Both sexes Males Females 30,5 35,8 25 33,4 38,9 27,5 2,9 3,1 2,5 Share of vulnerable employment in total employment (15+)
Both sexes Males Females 65,8 59,9 72 61,5 54,4 69,1 -4,3 -5,5 -2,9 Source: ILO (2010)
Box 1: Measuring informality and job quality/satisfaction in Vietnam
The LFS2009 is a survey carried out among households which follows the plan of a classical survey stratified in two tiers (GSO, 2010). It is representative at the national level, as well as for each of the 16 domains of stratification, by zone (rural and urban) and by region (the 6 official regions, plus Hanoi and Ho Chi Minh City). 66 185 individuals belonging to 17 884 households were interviewed. Among them, 35 528 were aged 15 and over (the lower age limit to be part of the labour force in Vietnam), and hold a job.
Outside the standard indicators on the labour market (activity, unemployment, under-employment, work status, branch of activity, multi-activities, etc.) two sets of questions, essential for this study, have been introduced into the questionnaire, at the instigation of a joint research project between the GSO and the French Institute for Research and Development (IRD). [The author of this report
was a member of this project between 2007 and 2010].
First of all, the survey was especially conceived to measure employment in the informal sector and more widely informal employment. A battery of questions put to each member of the working population allows us to identify those working in the informal sector. These questions cover the whole spectrum of internationally recommended criteria (ILO, 1993): the number of employees in the enterprise, the type of administrative registering and accountancy. This information has been collected not only for the principal job but also for secondary ones. It provides a great flexibility as to the operational definition of the informal sector (for more details, see Cling et al., 2010a). In accordance with the terminology in use in Vietnam, we shall call these production units:
• “informal household businesses” (IHBs), for those which are not registered and compose the informal sector;
• those which are registered are called “formal household businesses” (FHBs).
The exclusion of agricultural activities is justified by their profound differences to non- agricultural activities (in terms of their seasonal nature, of their organization of production, salary levels, etc.). This definition of the informal sector has the advantage of falling within the larger context of institutional sectors, which constitute the preferred point of departure for our analysis. The LFS2009 also provides a measure of informal employment, defined in conformity with international recommendations as the whole of jobs not covered by a system of social protection, whatever the sector of activity (formal or informal sector).
Secondly, a specific question about job satisfaction has been introduced into the questionnaire. The question which has been inspired by international experience in the subject is posed thus: “All things considered, to what extent are you satisfied with your job?” Five different types of ordered answer are proposed: “Very dissatisfied”, “Rather dissatisfied”, “Neither satisfied nor dissatisfied”, “Rather satisfied”, “Very satisfied”. The question was asked to all employed workers over the age of 15 and refers to their principal job. A question formulated in such a way, the most general of the existing possibilities, does not allow us to precisely identify the reasons which lead a worker to prefer such or such a job. On the other hand, it presents three principal advantages: it has the merit of remaining simple in a context where the size of the questionnaire was a major constraint; it can be considered as a synthetic indicator of the different advantages and disadvantages linked to each type of job, finally, it leads the way to analytical comparative perspectives.
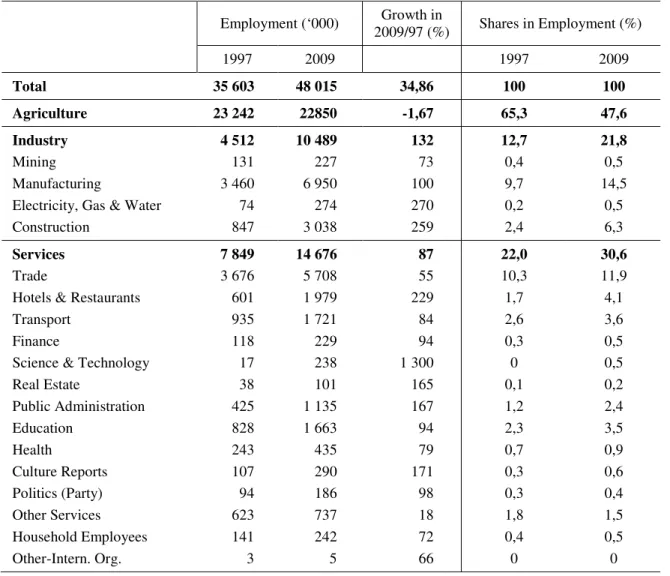
Although as mentioned before no reliable employment time series are available, a comparison of the sector structure of employment between 1997 and 2009 has been made by Papola (2010) using two different sources (MOLISA survey for 1997; LFS survey for 2009). According to the comparison presented in table 2, the share of agriculture has declined drastically over this period (from 65.3 to 47.6 per cent). The share of industry has nearly doubled (from 12.7 to 21.8 per cent). The share of services has increased by nearly 10 points (from 22 to 30.6 per cent). Whereas the share of trade has remained constant (10.3 to 11.9 per cent), the one of public services (education, etc.) has increased as well as of hotel-restaurants (1.7 to 4.1 per cent).
Table 2. Breakdown of employment by sector of activity
Employment (‘000) Growth in 2009/97 (%) Shares in Employment (%) 1997 2009 1997 2009 Total 35 603 48 015 34,86 100 100 Agriculture 23 242 22850 -1,67 65,3 47,6 Industry Mining Manufacturing
Electricity, Gas & Water Construction 4 512 131 3 460 74 847 10 489 227 6 950 274 3 038 132 73 100 270 259 12,7 0,4 9,7 0,2 2,4 21,8 0,5 14,5 0,5 6,3 Services Trade
Hotels & Restaurants Transport
Finance
Science & Technology Real Estate Public Administration Education Health Culture Reports Politics (Party) Other Services Household Employees Other-Intern. Org. 7 849 3 676 601 935 118 17 38 425 828 243 107 94 623 141 3 14 676 5 708 1 979 1 721 229 238 101 1 135 1 663 435 290 186 737 242 5 87 55 229 84 94 1 300 165 167 94 79 171 98 18 72 66 22,0 10,3 1,7 2,6 0,3 0 0,1 1,2 2,3 0,7 0,3 0,3 1,8 0,4 0 30,6 11,9 4,1 3,6 0,5 0,5 0,2 2,4 3,5 0,9 0,6 0,4 1,5 0,5 0 Source: Papola (2011)
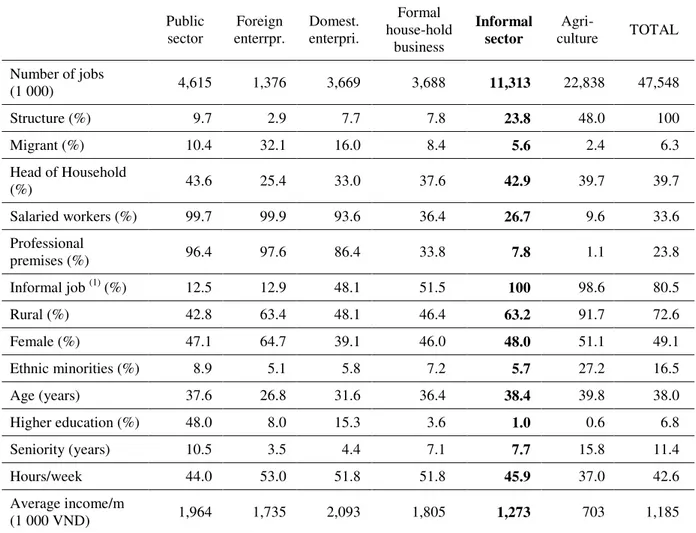
Table 3 presents the principal characteristics of employment in Vietnam by institutional sector in 2009, as well as the main characteristics of the workforce, based on the LFS2009. We distinguish six institutional sectors according to the nature of the capital of the enterprises, forming a partition of enterprises within which all types of job are done: the public sector (government and public enterprises), enterprises with foreign capital, domestic enterprises, formal and informal individual household businesses (also called formal/informal individual enterprises) and agriculture (overwhelmingly dominated by family smallholdings). This approach according to institutional sector allows us to go beyond the binary and over simplified contrast of the situation of the informal sector which only distinguishes formal/informal.
As mentioned before, agriculture continues to count for nearly half (48 per cent) of employment with 22.8 million people working in this sector out of an employed population totalling almost 50 million. With more than 11 million jobs, the informal sector represents nearly a quarter (24 per cent) of total employment and is the first source of non-agricultural jobs (half of jobs outside agriculture). Outside these two predominant sectors, the weight of the other sectors is relatively minor, given that domestic enterprises and formal household businesses represent an equal share of employment (each less than 10 per cent).
Table 3. Characteristics of the workforce and of employment by institutional sector in Vietnam (2009) Public sector Foreign enterrpr. Domest. enterpri. Formal house-hold business Informal sector Agri-culture TOTAL Number of jobs (1 000) 4,615 1,376 3,669 3,688 11,313 22,838 47,548 Structure (%) 9.7 2.9 7.7 7.8 23.8 48.0 100 Migrant (%) 10.4 32.1 16.0 8.4 5.6 2.4 6.3 Head of Household (%) 43.6 25.4 33.0 37.6 42.9 39.7 39.7 Salaried workers (%) 99.7 99.9 93.6 36.4 26.7 9.6 33.6 Professional premises (%) 96.4 97.6 86.4 33.8 7.8 1.1 23.8 Informal job (1) (%) 12.5 12.9 48.1 51.5 100 98.6 80.5 Rural (%) 42.8 63.4 48.1 46.4 63.2 91.7 72.6 Female (%) 47.1 64.7 39.1 46.0 48.0 51.1 49.1 Ethnic minorities (%) 8.9 5.1 5.8 7.2 5.7 27.2 16.5 Age (years) 37.6 26.8 31.6 36.4 38.4 39.8 38.0 Higher education (%) 48.0 8.0 15.3 3.6 1.0 0.6 6.8 Seniority (years) 10.5 3.5 4.4 7.1 7.7 15.8 11.4 Hours/week 44.0 53.0 51.8 51.8 45.9 37.0 42.6 Average income/m (1 000 VND) 1,964 1,735 2,093 1,805 1,273 703 1,185
Source: Cling, Lagrée, Razafindrakoto and Roubaud (2012); based on LFS2009, authors’ calculations.
(1) No social protection
Job composition by gender is globally balanced in the different sectors of activity, with the exception of employment in foreign enterprises which is dominated by females. The same is true for age where workers in the informal sector have an average age (38.4 years) very near to that of the general working population (38 years), whereas there again foreign enterprises distinguish themselves by the young age of their workers. Furthermore, the population usually composing the most precarious population groups (women, children, migrants) is not over-represented in the informal sector workforce, as testified by the high proportion of heads of household and the low proportion of migrants working there: the former is among the highest of all the sectors together (after the public sector), while the latter is among the lowest of all the sectors (before agriculture).
Although the socio-economic characteristics of the workforce employed in the informal sector are near to the national average (with the exception of levels of education), the attributes of the posts occupied are indeed very different and generally of worse quality than those in other sectors (except for agriculture). The rate of salaried employment is low (27 per cent) and the forms of salaried work clearly more precarious: more than 99 per cent have at best a verbal contract (25 per cent have no contract at all), compared with only 3 per cent in the public sector; 10 per cent are paid on a monthly basis (which constitutes the norm in the other sectors), the majority being remunerated on a daily basis, on an hourly basis, by piecework or on commission. For the whole of the workers in this sector, the rate of social protection is negligible (0.1 per cent), whereas it reaches 87 per cent in the public sector and in foreign enterprises, and nearly one in two workers in domestic enterprises. Workers in the informal sector earn the lowest salaries outside agriculture, which is linked to their low level of education (also the lowest outside agriculture). One can also add that almost all of the jobs in the informal sector are carried out without specific professional premises (at home or in the street), which constitutes another indicator of the precariousness of jobs in this sector.
The informal sector is not an exclusively urban phenomenon: there are more workers in the informal sector in rural and peri-urban zones (63 per cent). This characteristic is in part an artefact due to the administrative definition of rural zones in Vietnam, of which a high number would have been classed as urban in other countries. Nevertheless, it is also largely linked to the diversification of revenues strategy implemented by farmers.
Contrary to the theory of the compensating salary (for bad working conditions), the disadvantages of jobs in the informal sector seem to be cumulative. Thus, in spite of long working hours (46 hours a week compared to an average of 43), and long average length of service (almost 8 years), remuneration is low. The average monthly salary is 1.7 million dong (about 75 Euros), the formal sector (private or public) pays salaries which are 50 per cent higher. The informal sector thus occupies an intermediary position between the non-agricultural formal sector (at the top of the distribution) and agriculture (at the bottom).
The survey also provides a measure of informal employment, defined in conformity with international recommendations as the whole of jobs not covered by a system of social protection, whatever the sector of activity (Cling et al., 2012b). On a national level, informal employment represented 80.5 per cent of total employment in 2009, which signifies that only 9 million workers are covered by social security (mandatory or voluntary; Castel, 2012) The totality of jobs in the informal sector are of an informal nature, as well as most jobs in agriculture (98.6 per cent). However, informal jobs are of very diverse importance in all sectors of activity: they represent nearly half of jobs in domestic enterprises and individual formal enterprises and more than 10 per cent in the public sector and in foreign enterprises (Razafindrakoto et al., 2011).
2.2. Segmentation and incomes
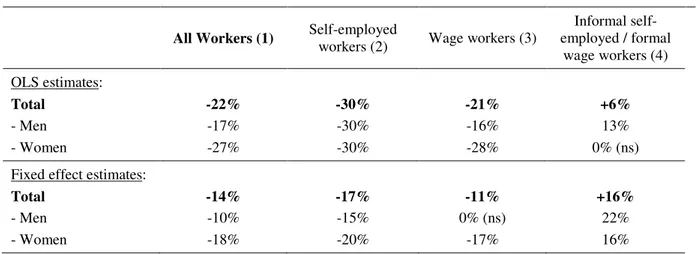
The study by Nguyen et al. (2013) is the first to measure informal-formal earning gaps in Vietnam on panel data drawn from a nationally statistically representative household survey. Their estimates use OLS (ordinary least squares), fixed effects and quantile regressions (QR) econometric methods. They use a worker level definition of informality, drawn from the VHLSS 2002, 2004 and 2006. Their results suggest that the informal earnings gap highly depends on the workers’ job status (wage employment vs. self-employment) and on their relative position in the earnings distribution, as well as gender (Table 4).
Table 4. Informal/Formal Workers Earnings Gaps
Informal/formal workers
All Workers (1) Self-employed
workers (2) Wage workers (3)
Informal self-employed / formal wage workers (4) OLS estimates: Total - Men - Women -22% -17% -27% -30% -30% -30% -21% -16% -28% +6% 13% 0% (ns) Fixed effect estimates:
Total - Men - Women -14% -10% -18% -17% -15% -20% -11% 0% (ns) -17% +16% 22% 16%
Source : Nguyen et al. (2011)
Their main conclusion is that informal workers earn less than formal workers, all other things being equal (that is to say, for the same qualifications, experience, sex, industry and other observable characteristics); on average (OLS estimates), the earning gap is -22 per cent (column 1). Once unobserved individual characteristics (such as entrepreneurial skills) are controlled for, the penalty for being informal is smaller (-14 per cent globally). The earnings gaps look more like those observed in emerging countries, not characterized by considerable segmentation between formal and informal jobs, compared to the standard dualistic Sub-Saharan labour markets (Dimova et al., 2010; Bocquier et al., 2010).
Females always financially suffer more (or benefit less) when they are informally employed. At the aggregate level, the OLS gap is -17 per cent for male and -27 per cent for female (respectively -10 per cent and -18 per cent with fixed effects); according to the authors, this feature suggests that women might accept lower wages in the informal sector because it provides other non-pecuniary advantages, relatively more valuable to them; this result opens space for specific policies to align the functioning of labour market for women with that of men (reduction in entry barriers to formal jobs, improvement of access to physical capital, etc.).
The systematic premium at all points of the distribution of formal self-employed workers over their informal counterparts (column 2 presents global results only) suggests that formalization of non-farm household businesses seems to be beneficial. Policies aiming at easing administrative procedures to register informal firms should be encouraged. The same holds for formal vs. informal wage workers (column 3).
However, this study also obtains some puzzling results. At odds with the “exclusion” hypothesis and what would show the observed raw earnings gaps, some informal jobs are more rewarding (self-employment) or as rewarding (male wage workers) as formal wage jobs. Once unobserved individual characteristics are controlled for, the penalty for being informal is no longer significant for male wage workers: for them working informally is at least financially as rewarding as having a formal wage job. This feature is due to the relatively low wages of formal wage jobs. The reason for such a specificity should be investigated further (international competition pressure? wage repression policy?).
To sum it up, although they tend to globally nuance the segmentation of the labour market in Vietnam, Nguyen et al. emphasize that it is especially strong for women, and that there is also a multi-segmentation phenomenon within the informal sector, as already suggested by Cling et al. (2010) based on an principal component analysis: there is a clear distinction within the informal sector between “survivors” which are constrained to work there and are the poorest and the most vulnerable (also called the “free entry” informal sector) and the “professionals” at the high-end (the “upper tier” informal sector), which have often chosen to work there and are better off.
The results obtained by Rand and Torm (2012a) are consistent with those by Nguyen et al. (ibid). Their study is based on (non-representative) survey data on 1,098 manufacturing small and medium firms (SMEs) collected in 2009. Using the traditional Blinder-Oaxaca decomposition method, they show that average wages are about 10 to 20 per cent higher in formal firms compared with informal ones and that the gap remains when standard earnings determinants are added. According to the results, most of the wage gap is attributed to differences in characteristics between firms in the formal and informal sectors (the survey does not provide information on individual worker characteristics). The authors consider that the fact that the wage gap remains when firm level workforce characteristics are included could be an indication that formal firms pay higher wages so as to attract more productive workers (efficiency wages). Rand and Torm (2012b) also show (based on the same survey data) that formal firms have higher profits and investments and a lower share of casual workers, but find no evidence of a higher share of wages in total value added.
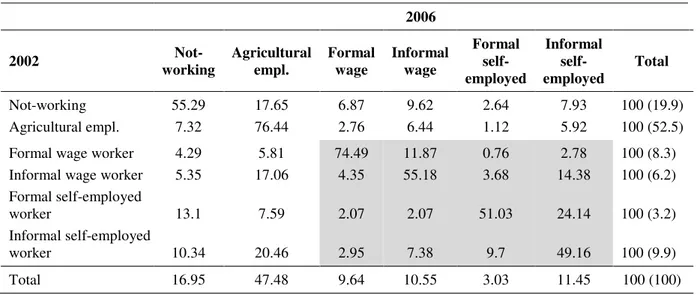
The mobility between sectors is measured by Nguyen et al. (ibid.) by constructing transition matrixes based on panel data. The mobility from the informal to the formal sector appears to be limited: between 2002 and 2006, only 8 per cent of informal wage workers became employed in the formal sector (either as formal wage workers of formally self-employed); 12.7 per cent of informal self-employed workers joined the formal sector; among them, 3 per cent became formal wage workers and 9.7 per cent formally self-employed (Table 5).
Table 5. Transition matrix of employment status between 2002 and 2006 (per cent) 2006 2002 Not-working Agricultural empl. Formal wage Informal wage Formal self-employed Informal self-employed Total Not-working Agricultural empl. 55.29 7.32 17.65 76.44 6.87 2.76 9.62 6.44 2.64 1.12 7.93 5.92 100 (19.9) 100 (52.5) Formal wage worker
Informal wage worker Formal self-employed worker Informal self-employed worker 4.29 5.35 13.1 10.34 5.81 17.06 7.59 20.46 74.49 4.35 2.07 2.95 11.87 55.18 2.07 7.38 0.76 3.68 51.03 9.7 2.78 14.38 24.14 49.16 100 (8.3) 100 (6.2) 100 (3.2) 100 (9.9) Total 16.95 47.48 9.64 10.55 3.03 11.45 100 (100)
Source: Nguyen et al. (2011), based on VHLSS, 2002 and 2006 (GSO).
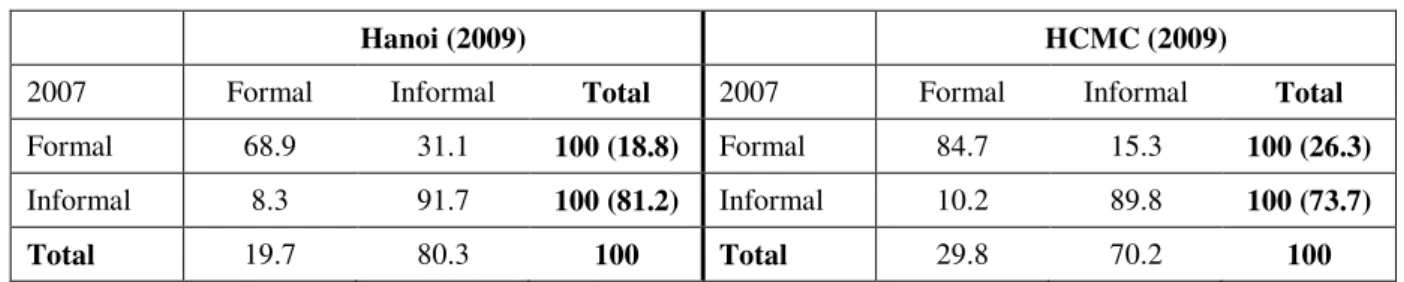
Some more recent results on mobility have been presented by Demenet et al. (2010) who built the same kind of transition matrixes based on panel data for Hanoi and Ho Chi Minh City covering the 2007-2009 period. The data was drawn from the Household
Business and Informal Sector surveys (HBand IS) conducted in these two hubs by GSO in partnership with the French Institut de Recherche pour le Développement (IRD/DIAL team). According to their results, which are consistent with those of Nguyen et al., around one informal household business (IHB) out of ten got formalized between 2007 and 2009; respectively 31 per cent and 15 per cent got informal in Hanoi and HCMC during the same period (Table 6). This important informalisation process has probably a lot to do with the economic crisis.
Table 6. Transition matrix of employment status between 2007 and 2009 Hanoi and HCMC (per cent)
Hanoi (2009) HCMC (2009)
2007 Formal Informal Total 2007 Formal Informal Total
Formal 68.9 31.1 100 (18.8) Formal 84.7 15.3 100 (26.3)
Informal 8.3 91.7 100 (81.2) Informal 10.2 89.8 100 (73.7)
Total 19.7 80.3 100 Total 29.8 70.2 100
Source : HB&IS surveys, Hanoi and HCMC, 2007 ; 2009, OGS / IRD-DIAL.
Not surprisingly, the IHBs which became formal were on average bigger, more productive and less precarious than their counterparts which remained in the informal sector. Demenet et al. (2013) evaluate rigorously, using data matching techniques, the impact of formalization on household businesses performances and mode of operation in Hanoi and HCMC. The results are drawn from a panel of representative data (2007-2009) which allows measuring the performance and intermediate incomes of household businesses with great precision. They come to similar conclusions as Rand and Torm (2012b) mentioned here above. According to the authors, leaving the informal sector increases annual value added by 22 per cent on average. More importantly, this improvement is made possible by associated changes in operating conditions, such as better access to equipment, size, type of premises and type of accounts. Formalization thus allows household businesses to have better equipment and increase their scale of operation. As pointed out by the authors, “These findings raise important questions concerning the types of businesses likely to formalize and the potential incentive policies targeted towards the informal sector” (see section 5 below).
A last source of segmentation is due to the public/private sector segmentation. According to Imbert (2011) who limits his comparison to wage workers, not only public sector employees are more skilled than private sector ones, but they also benefit from higher returns on their skills. The author also puts in evidence the low mobility of workers from the private to the public sector, which is another indicator of the public/private sector segmentation. The analysis in terms of job satisfaction conducted here below confirms this highest status of the public sector.
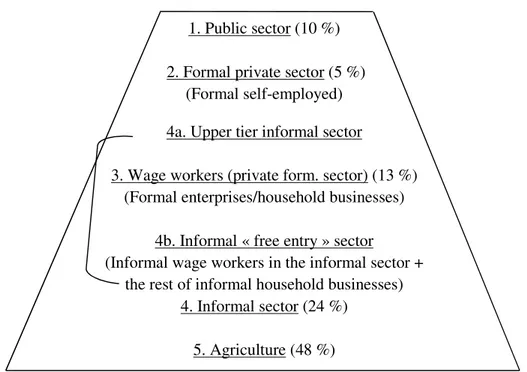
To sum it up, there is a double duality in the labour market between sectors and also within the (multi-segmented) informal sector, as underlined by Fields (2007). Adapting the typology proposed by Fields to the case of Vietnam, we build a “pyramid” of the labour market, by analogy with population pyramids widely used in demographic studies. This pyramid consists of 5 main segments (or “labour market states”): 1/public sector; 2/formal private sector (formally self-employed, excluding formal wage workers); 3/ wage workers employed in the private formal sector; 4/informal sector (broken down between “upper tier” and “free entry” part); 5/and agriculture (Figure 1). The bottom of
the pyramid represents the biggest share (nearly half) of total employment and the share of each segment tends to decrease (with some exceptions) going upward.
In this pyramid, the wage workers in formal enterprises and household businesses are squeezed between the two categories of informal sector: their income is inferior to the “upper tier” of informal household businesses (which is also found by World Bank, 2008); but it is superior to the “free entry” section of the informal sector, composed of informal wage workers in the informal sector and other informal household businesses.3
Figure 1: The “Pyramid” of the labour market in Vietnam
1. Public sector (10 %) 2. Formal private sector (5 %)
(Formal self-employed) 4a. Upper tier informal sector
3. Wage workers (private form. sector) (13 %) (Formal enterprises/household businesses)
4b. Informal « free entry » sector (Informal wage workers in the informal sector +
the rest of informal household businesses) 4. Informal sector (24 %)
5. Agriculture (48 %)
Note: the numbers in brackets represent the share of each sector in total employment in 2009 Source: LFS2009.
2.3. Job satisfaction
If we now examine job satisfaction, we shall comment the balance of satisfaction indicator (percentage of satisfied workers minus percentage of unsatisfied workers). This “balance of opinion” technique is widely used in the analysis of opinion surveys. This sub-section presents the results of a study by Razafindrakoto et al. (2012) using this methodology.
First of all, the extreme values (very satisfied and very unsatisfied) only represent a very marginal part of the distribution of replies. For the whole workforce only 2.4 per
3
The econometric estimates conducted by Nguyen et al. (2013) put informal household businesses above formal wage workers (see the sign of the earning gap) and formal wage workers above informal wage workers. But we also know from other studies that some informal household businesses (“free entry”) are below formal wage workers. We also make the hypothesis that informal wage workers in the private formal sector are above the same kind of workers employed in the informal sector.
cent declared that they were very satisfied with their job, while the proportion of those who affirm that they are very unsatisfied is negligible (0.2 per cent). Regardless of anything else, these results show that working conditions in Vietnam are more or less satisfactory or they at least correspond globally to the expectations of Vietnamese workers. But we may also evoke a cultural (or political) characteristic linked to the Vietnamese context: citizens are not very willing to express attitudes or opinions which are too clear-cut, either because they do wish to provoke feelings of envy or stigmatization in others or because they fear some sort of “punitive” reaction from the authorities for having formulated implicit criticisms about working conditions in force in Vietnam. This behaviour is observed in many cases, especially in surveys with household businesses: for example, the percentage who declare they meet difficulties is very low compared to other developing countries, in spite of similar difficult operating conditions (Cling et al., 2010).
Next, the results highlight a very clear hierarchy depending on institutional sector, which can be broken down into three big categories.
• The public sector is found at the top of the ladder: nearly three quarters (72 per cent) of employees in the public sector (civil servants or salaried workers in public or para-public enterprises) declare themselves to be satisfied or very satisfied with their job (70 per cent for the balance of opinion).
• Then come workers from the private formal sector, of which a little more than half show themselves to be at least satisfied, without any significant difference between those who work in foreign, domestic or individual enterprises (with a balance of opinion of respectively 49 per cent, 45 per cent and 47 per cent).
• Finally, workers in the informal sector and in agriculture are the most critical, the proportion of those declaring themselves satisfied being around one third, with an advantage to the former (38 per cent and 29 per cent respectively, and a balance of opinion of 30 per cent and 19 per cent in agriculture, the lowest of all sectors). The hierarchy of job satisfaction according to institutional sector partially respects working conditions and average remuneration offered in each sector, commented here above. As they benefit from higher salaries, shorter working hours and better welfare protection (social security, long-term contracts, paid holidays, etc.), public service employees are by far the best treated; and this in spite of the adjustment policies which aim to control salaries and the public/private remuneration differential.
Less trivial is the far from favourable position of informal sector workers, the principal centre of interest of this study, at least with regards to supporters of the theory that workers freely choose the informal sector. It can be supposed that vulnerability and precariousness of everyday life exercises some pressure on the fall in the level of satisfaction. Finally, the stylized facts taken from this first descriptive analysis of job satisfaction seem to validate the hypothesis of the queue before the gates leading to the formal sector, based on the inferior status of jobs in the informal sector. Overall, it is quite consistent with our “pyramid” presented in Figure 1 here above.
2.4. Long term trends
In the long term, it is expected that a country’s development is accompanied by a progressive reduction of the weight of its informal sector, in conformity with the observation of the marginal weight of this sector in developed countries (La Porta and Schleifer, 2008; Bacchetta et al., 2009). Indeed, these countries possess systems of
regulation and fiscal control which are relatively efficient and from which it is difficult to escape for small entrepreneurs. However, this mechanism only works in the long term, as Bacchetta et al. stated (2009): “it has been shown that informality rates evolve very little with the passage of time and only have a very weak reaction to the acceleration of economic growth or to the opening up of commercial exchanges”. Given the rapid rates of growth of the Vietnamese economy since the 1980s and the launch of Doi Moi, one would thus think that the informal sector’s weight on the job market would have tended to diminish somewhat.
When one attempts to verify if this hypothesis is valid, one does not have at hand the precise, coherent data with the job survey commented upon here concerning employment in the informal sector before 2007. The VHLSS survey (Vietnam Household Living Standards Survey), which has been carried out with the support of the World Bank by the GSO since the 1990s, allows us however to measure approximately the evolution of employment in this sector over the last years. According to Nguyen (2012), while the share of agriculture declined progressively (it is now less than 50 per cent of total employment), the share of the informal sector in total employment rose from 23.2 to 26.6 per cent between 1998 and 2008. What’s more, it is in the two most industrialized regions in the country, the Red river Delta (Hanoi region) and the South-East (HCMC region) that this share is the biggest. In spite of the rise in the rate of salaried workers and the expansion of the private formal sector, the informal sector will thus continue to grow in Vietnam, the consequence of a phenomenon of rapid agrarian, urban and demographic transition4.
What’s more, forecasts for employment in 2015 that we made using past trends - before the arrival of the crisis - show that employment in the informal sector and its relative weight in total employment are going to continue growing over the next few years (Cling et al., 2012a). As far as workforce supply is concerned, firstly Vietnam has found itself in a period of “demographic dividend” when there is a huge number of young people arriving on the labour market (more than one million per year) and the situation is going to remain so until 2015. At the same time, the growth of the formal private sector (if it continues), which is nevertheless rapid, is not high enough to absorb all the new arrivals on the labour market given that agricultural employment (which represents nearly half of total employment) is following a falling trend. Even if a return to strong growth scenario is envisaged for the Vietnamese economy, once the effects of the crisis are in the past, these forecasts suggest that the informal sector will continue to represent a considerable share of employment in the years to come.
3. Links between institutional setting and informality
In order to understand the institutional background of the informal economy, we need to describe two main kinds of legislation in this section: first, the rules for registration of household businesses, which determine the legality or not of the informal sector businesses; second, laws on social protection, which establish who should benefit from social protection and who should not (the latter having informal employment by definition). After presenting the institutional setting, this section analyses the possible
4
This conclusion is not shared by McCaig and Pavcnik (2011) who, on the contrary, conclude there was a fall in the number of jobs in the informal sector at the beginning of the 2000s, which they attributed to an increased opening up to international markets.
links between institutional setting that lead to current segmentation and quantity and quality of jobs. More specifically, it presents survey data on the reasons why household businesses do not register and are therefore sometimes illegal. The impact of the international crisis on the informal sector, which is the most vulnerable segment of the economy, is also studied.
3.1. Registration of business households
5The Ministry of Planning and Investment (MPI) is in charge of fixing the rules for registration of household businesses. Provincial directorates of the MPI are in charge of registration, which is conducted in practice by the districts. Decision N°88/2006/ND-CP dated 29 August 2006 of the government on business registration fixes general rules on this subject (see Box 2). The decree is relatively vague on the exceptions for specific businesses and the threshold which is fixed at district level (it cannot be higher than the threshold at which income tax is payable). In fact, one can consider that almost all household businesses should theoretically be registered. As the thresholds are very low, there are almost no household businesses below them which are therefore exempted from registration. But this is far from being the case as is shown by the results of surveys described in this study. Around three quarters of household businesses are not registered at the national level. Interviews conducted at MPI show that this Ministry is aware of this situation but does not seem to consider that addressing this issue should be a priority (especially because of the lack of human resources needed to increase controls).
The Ministry of Finance (MoF) is in charge of household business’s taxation. Three kinds of taxes are collected: the registration tax, the VAT and the income tax. From our interviews with MoF’s experts, it appears that the poorest HBs are exempt for social purposes. The key question is how to identify these low income HBs. MoF’s interlocutors are quite confident tax evasion is not an issue in Vietnam. Concretely in the field, the exhaustive list of HBs (whether registered or not) is established at the local level by the tax administration in collaboration with the local People’s Committee. HB’s heads are supposed to self-declare their activity (industry, turn-over, income for example), according to the HB’s books. Then, this information is cross-checked by the local administration, which decides who should pay and for which amount. Furthermore, the list of tax payers and the nominative tax amount is publicly posted to the scrutiny of the neighbourhood.
This process of peer review is supposed to equalize the tax burden, as each HB can claim for unfair treatment, if it considers it is paying more than it should compared to others operating with the same conditions. Nevertheless, we are less sure whether these procedures really ensure horizontal equity among the HBs. The empirical evidence suggests that the correlation between taxation and the true level of activity is quite fuzzy, the most visible ones being taxed more often, whatever their income. The huge discrepancy between the number of HBs controlled for tax purposes (around 1.2 million) and the total number of HBs captured through the statistical surveys (8.4 million) is compatible with a substantial phenomenon of tax evasion.
The government’s approach towards household businesses seems to be changing progressively, with an increased interest towards them. In June 2009, the government adopted Decree N°56/2009/ND-CP on Support to Development of Small and
5
sized Enterprises, (SMEs). SMEs are defined according to different thresholds. The employment threshold is of 300 employees in general and 100 employees in trade and services. SMEs employing less than ten employees are considered no longer as household businesses, but as enterprises. This could mean that in the future micro-enterprises will fall under the Law of Enterprise and not be considered apart anymore.
Box 2: Business registration of household businesses
1. A household business as owned by one Vietnamese citizen, by one group of persons or one individual household may be registered for business at one location only, may employ only up to ten (10) employees, shall not have a seal, and shall be liable for its business activities to the full extent of its assets.
2. Household businesses which engage in agricultural, forestry, fishery or salt production or which are street hawkers, nosh vendors, long-distance traders, itinerant traders or service providers earning low income shall not be required to register their businesses, unless they conduct business in conditional lines of business. People’s committees of cities and provinces under central authority shall stipulate the applicable level of low income within their locality. The stipulated level of low income may not be higher than the stipulated threshold at which personal income tax is payable in accordance with the law on tax.
3. Any household business which employs regularly more than ten (10) employees must register business as an enterprise.
Source: Decree N°88 on Business Registration, Article 36, dated 29 August 2006.
Decree N°56 considers three main kinds of support policies towards SMEs, especially for micro-enterprises: financial support (legitimate credits), training and technical assistance. As it is the case for policies conducted by MoLISA, the informal sector is not specifically targeted by MPI’s policies. One might even consider that it is excluded from them, as all SMEs are supposed to be registered according to this decree, (which is not the case for household businesses). Indeed, whereas micro-enterprises (FHBs) have largely benefitted from legitimate credits granted within the Stimulus Package launched by the Vietnamese government in 2009, IHBs have not benefitted at all from this assistance according to our surveys.
3.2. Law enforcement and the informal sector
In Vietnam, not all household businesses have to register. Two kinds of households are exempt: those earning less than a certain amount set at district level (which cannot be below the minimum wage), and street vendors and xe ôm (motorbike taxis).
Below a certain level of business done, household businesses are not required to get a business licence and can operate freely. Household businesses are exempt from business tax (and now from personal income tax) if their turnover is too small. The empirical evidence suggests that the informal sector as a whole is unknown to the State registration services. Nevertheless, the absence of registration (business licence) does not mean that the informal sector is not taxed; more than one-third of IHBs pay one sort of tax in Hanoi (mostly local taxes), although this proportion is much lower in HCMC.
The Ministry of Planning and Investment (MPI) is in charge of fixing the rules for registration of household businesses. Provincial MPI directorates are in charge of registration, which is conducted in practice by the districts. The problem is that the conditions are vague: there are numerous criteria, exceptions and different thresholds. Almost no IHBs (less than 1 per cent) know the threshold above which HBs have to register. Even among the formal HBs, only a minority claim that they know the registration legislation (10 per cent of FHBs in Hanoi and 20 per cent in HCMC), and their knowledge appears to be limited since the magnitude of the registration threshold that they put forward varies substantially (from 2 million to 15 million per month).
We can compute the proportion of IHBs that should be registered by law and, conversely, the proportion of FHBs that need not. These calculations should be viewed with caution, as the law itself is not very clear about which HBs should legally have a business licence and we do not know exactly what the actual locally adopted threshold is above which HBs have to register. Excluding the sectors exempt from registration, the proportion of IHB heads earning more than the minimum wage then provides an indicator of the percentage of ‘illegal’ IHBs (upper bound estimator). In fact, one can consider that almost all household businesses (HBs) should theoretically be registered: as the thresholds are very low, there are almost no household businesses below them that are therefore exempted from registration, with haziness subsisting as to the legal need for roving HBs to register (Cling et al., 2012c).
Our calculations have been undertaken using the HB&IS surveys conducted in Hanoi and Ho Chi Minh City (see here above). The selected income variable is the operating surplus taken from the HB&IS Surveys (we prefer not to use earnings as the declarations are notoriously underestimated). We consider three legislative hypothesises: a) all HBs should have a business licence when they earn more than the minimum wage (450,000 VND/month; b) this income criterion does not apply to mobile HBs or HBs with improvised street pitches (it applies only to businesses working at home or with professional premises); c) this income criterion applies only to “located” HBs (with professional premises).
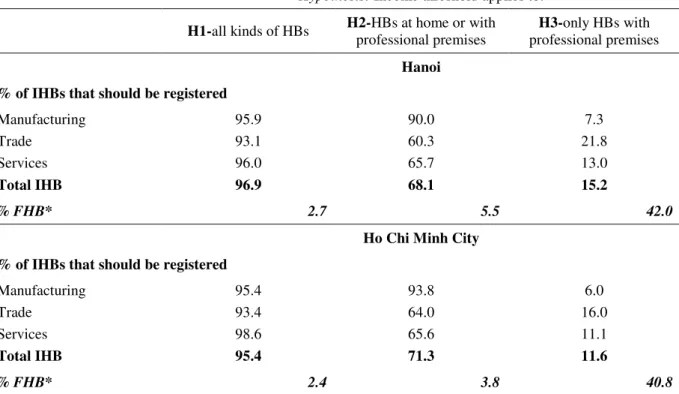
Under the first hypothesis, 95 per cent of IHBs should be registered in both cities (Table 7). If we relax the hypothesis by considering that only those with fixed premises fulfilling the income threshold should register, the share of ‘illegally’ operating IHBs drops significantly to around 70 per cent under the loose definition of ‘premises’ (including homes), and dramatically to 10 per cent-15 per cent in the more restrictive case (considering only HBs with professional premises). These results merely reflect the fact that IHBs rarely operate on premises. ‘Manufacturing’ IHBs are the most advantaged in this respect (followed by ‘services’ and lastly ‘trade’, the most precarious). The figures are extremely close in the two cities. The only clear-cut conclusion to be drawn from this exercise is that HB registration legislation is unclear and all the more confusing for HB heads. This lack of transparency forms a breeding ground for discretionary decisions and for potential harassment and corruption by public officials.
Table 7. Registration and ‘legality’ in the informal sector (percentage)
Hypothesis: Income threshold applies to:
H1-all kinds of HBs H2-HBs at home or with
professional premises
H3-only HBs with
professional premises
Hanoi % of IHBs that should be registered
Manufacturing Trade Services Total IHB 95.9 93.1 96.0 96.9 90.0 60.3 65.7 68.1 7.3 21.8 13.0 15.2 % FHB* 2.7 5.5 42.0
Ho Chi Minh City % of IHBs that should be registered
Manufacturing Trade Services Total IHB 95.4 93.4 98.6 95.4 93.8 64.0 65.6 71.3 6.0 16.0 11.1 11.6 % FHB* 2.4 3.8 40.8
Note: *: for FHBs, the reported figures are the % of HBs that are registered while it is not compulsory for them to be so. Source: Cling et al. (2012c) based on HB&IS Survey, Hanoi (2007), Ho Chi Minh City (2008), GSO-ISS/IRD-DIAL; authors’ calculations.
Turning to the FHBs, we ask why some HBs get a business licence when they do not have to. Based on the first hypothesis, less than 3 per cent of FHBs earn less than the minimum wage, which means that they are complying with the legislation. However, if we consider that the income condition applies only to HBs with premises (or, in particular, industries), the diagnosis is quite different. For instance, under Hypothesis 3, more than 40 per cent in both cities are registered when they need not be. In this case, one interpretation could be that the cost/benefit analysis of registering leads HB heads to register in order to benefit from the expected advantages of operating in the formal sector.
Lastly, whatever the “true” scope of the registration formalities, legislation and procedures should be clarified to eradicate the grey area between formality/informality and legality/illegality. Indeed, this is a source of both economic inefficiencies and inequities, and therefore of increased segmentation on the labour market through reduced efficiency and then earnings in the informal sector.
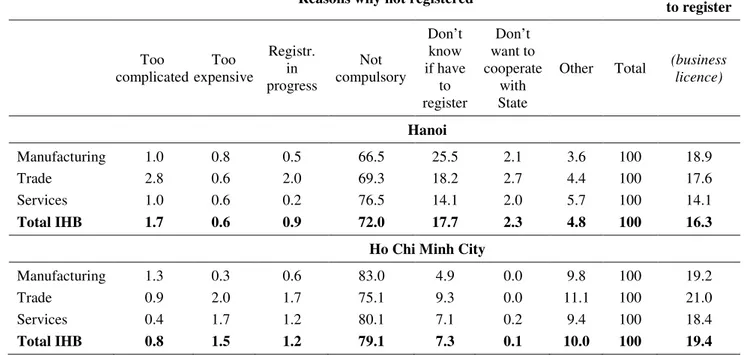
In terms of business registration, there are two distinct situations that are, by definition, opposite: the situation of the IHBs, which are not registered, and the situation of the FHBs, which are registered. The vast majority of IHBs (72 per cent in Hanoi and 79 per cent in HCMC) believe that registration is not compulsory (Table 8). In addition to this huge proportion, 18 per cent do not know whether they need to register in the capital city (7 per cent in HCMC). All in all, regardless of the type of register considered (business, tax and social security registration), from 85 per cent to 90 per cent of IHBs are not aware of the regulations. It is therefore essentially ignorance of their legal obligations that leads the heads of IHBs to fail to register.
Neither the complexity nor the cost of the registration procedures appears to be a problem and there is no overt reluctance to cooperate with the public services. Only a tiny minority of less than 2 per cent of IHBs openly refuse all cooperation with the State. Again, less than 2 per cent of IHBs feel that the formalities are too complicated. Lastly, the monetary cost of registration is only raised by a maximum of 2 per cent of those who have not registered. A not-inconsiderable proportion of IHBs (16 per cent in Hanoi and 19 per cent in HCMC) even say that they are willing to get a business licence.
Table 8. Reasons for not being registered (per cent)
Reasons why not registered Prepared
to register Too complicated Too expensive Registr. in progress Not compulsory Don’t know if have to register Don’t want to cooperate with State
Other Total (business
licence) Hanoi Manufacturing Trade Services Total IHB 1.0 2.8 1.0 1.7 0.8 0.6 0.6 0.6 0.5 2.0 0.2 0.9 66.5 69.3 76.5 72.0 25.5 18.2 14.1 17.7 2.1 2.7 2.0 2.3 3.6 4.4 5.7 4.8 100 100 100 100 18.9 17.6 14.1 16.3 Ho Chi Minh City
Manufacturing Trade Services Total IHB 1.3 0.9 0.4 0.8 0.3 2.0 1.7 1.5 0.6 1.7 1.2 1.2 83.0 75.1 80.1 79.1 4.9 9.3 7.1 7.3 0.0 0.0 0.2 0.1 9.8 11.1 9.4 10.0 100 100 100 100 19.2 21.0 18.4 19.4 Source: Cling et al. (2012c) based on HB&IS Survey, Hanoi (2007), Ho Chi Minh City (2008), GSO-ISS/IRD-DIAL; authors’ calculations.
The qualitative survey conducted by Razafindrakoto and Nguyen (2010) with HBs in Hanoi and Ho Chi Minh city assesses and illustrates the findings of the quantitative
HB&IS survey (see Box 1). The analysis made before showed that, if legislation were strictly enforced, almost all the interviewed HBs would have to register. However, most of the informal HBs argue that their business is too small, claim that registration is not compulsory for them, and assert that nobody has asked them to register. Most of the informal HBs put forward the case of the small scale of their activity. The heads of HBs argue that they do not really run a business, just a ‘household activity’. So, according to them, registration is not compulsory, though they acknowledge their limited knowledge of the legislation, which is clearly illustrated by their declaration.
The case of street vendors and service providers conducting their business in a public place like pavements and small lanes in the middle of a crowded neighbourhood merits special attention. Normally, they are not obliged to be registered, but they are banned in some streets. Due to both their personal circumstances and business conditions, those micro-entrepreneurs are not in a position to learn about and familiarize themselves with the laws concerning business registration. Not surprisingly, their limited knowledge of the regulations puts them in a difficult situation and is more problematic.
On the whole, IHBs stress the fact that they have never been controlled by the authorities: they have had no contact with public officials or no one has asked them to