Corporate Social Responsibility related management practices
and Firm Performance:
An Empirical Analysis of the Quantity-Quality Trade-off on
French Data*
Patrica Crifo a Marc-Arthur Diaye b Sanja Pekovic c
April, 2013
Abstract
This paper studies how different combinations of CRS dimensions affect corporate economic performance. We use various indicators of CSR to examine whether firms rely on different combinations of CSR, in terms of quality versus quantity of CSR practices. Our empirical analysis, based on an original database including more than 4000 French firms, shows that CSR dimensions in isolation impact differently on a firm’s profit. The interaction among various CSR dimensions exerts different influences on firm performance in term of profit, producing both substitutability and complementarity effects.
Keywords: Corporate social responsibility, firms’ performance, complementarity, trade-off, simultaneous equations models, selection.
* Acknowledgements: Support of the Chair for Sustainable Finance and Responsible Investment (Chaire FDIR, Toulouse-IDEI and Ecole Polytechnique) is gratefully acknowledged by Patricia Crifo. Marc-Arthur Diaye and Sanja Pekovic gratefully acknowledge the financial support for this work from the AFNOR “Performance des Organisations” endowment in collaboration with the Paris-Dauphine Foundation. Marc-Arthur Diaye acknowledges the support of the Rennes Metropole “Allocation Scientifique d’Installation”.
a
University of Paris West, Ecole Polytechnique (Palaiseau, France) and CIRANO (Montreal, Canada). [email protected].
b
University Evry Val d’Essonne (EPEE). [email protected]. c
University of Paris-Dauphine (DRM-DMSP-CNRS UMR 7088). [email protected].
INTRODUCTION
In all OECD countries, firms are making a lot of effort to be, or at least to appear, socially responsible. In 2005, for instance, 52% of the top 100 corporations in the 16 more industrialized countries published a report on their corporate and socially responsible activities. In fact, since the late 1990s, many industrialized countries have adopted laws requiring firms (listed and/or non listed) to publish reports detailing their exposure to environmental, social and governance risks and how they address these risks.1
Nevertheless, Corporate Social Responsibility (CSR) means socially and environmentally friendly actions not only required by law, but going beyond compliance, privately providing public goods or voluntarily internalizing externalities. According to the European Commission (2007), being socially responsible in fact means that, beyond legal requirements, firms accept to bear the cost of more ethical behavior by voluntarily committing, for instance, to improving employment conditions, banning child labor and not working with countries that do not respect human rights, protecting the environment and investing in equipment to reduce the carbon footprint, developing partnerships with NGOs, providing funds to charity, etc. CSR strategies would in fact allow firms to maximize value and to minimize risk in the long run, to respond to increased competitive pressure and market differentiation, and such strategies would more generally take into account the growing demands of their stakeholders (customers, consumers, employees, investors). As suggested in the report on “Green growth” for the Economic Council on Sustainable Development, the complementarity and synergies between environmental, social and governance factors inherent in CSR strategies might be
1
Laws NRE in France, Sarbanes-Oxley in the US, Green account Act in Denmark, Combined Code and Turnbull Report in the UK, etc.
determinant for the emergence of green economic growth (see Crifo, Grandjean and Debonneuil, 2009).
But do firms actually benefit from CSR strategies? Can it be profitable to invest in responsible practices beyond legal obligations? In other words, what are the links between CSR and firm economic performance? In turn, what is the value of CSR strategies, in particular with respect to social, environmental or market behavior?
The impact of Corporate Social Responsibility on economic performance has received considerable attention in the literature over the past three decades (see e.g. Margolis, Elfenbein and Walsh, 2009 for comprehensive reviews). However, no consensus has emerged so far. Social responsibility rather seems to have an ambiguous and complex impact on firm performance though no true causality has been proved yet. While some research argues that investment in social responsibility raises a firm’s costs, which makes it less competitive (Friedman, 1970; Brummer, 1991; McWilliams and Siegel, 1997), other research has suggested that by investing in social performance, a firm can achieve competitive advantage by attracting resources and quality employees more easily, differentiating its products and services, reducing its exposure to risk, etc (Cochran and Wood, 1984; Turban and Greening, 1996; Waddock and Graves, 1997; McWilliams and Siegel, 2001; Godfrey, 2004). In this paper, we argue that one reason for this absence of consensus lies in the possibility of a quantity-quality trade-off between the various dimensions of corporate responsibility, where quantity in our paper refers to the effect of the CSR dimensions in isolation and taken together and quality corresponds to interactions among various CSR dimensions. A firm’s CSR policy is multi-dimensional and includes environmental, social and business behaviors factors. Consequently, using a single item as a proxy for generic CSR could cause fundamental uncertainty about the relationship between CSR and firm performance (e.g. Surroca, Tribò and Waddock, 2010). In this sense, Mackey, Mackey and Barney (2007) and Brammer and
Milligton (2008) suggest that some forms of socially responsible behavior are positively associated with firm performance while other are not. Barnett and Solomon (2006) show that CSR investments vary by the intensity of a firm’s social screening and also in the types of social screens that a firm employs. Yet, how those various dimensions interact as inputs of firm performance is important. Moreover, in a context of limited resources, firms may well face a quantity (specific practices or number of practices employed) or quality (interactions among practices employed) trade-off effect, suggesting a complex and ambiguous impact of various CSR combinations on business performance. Thus, we test whether such a quantity-quality trade-off emerges using data on French firms from the Organizational Change and Computerization survey (COI, 2006).
To measure CSR, exisiting studies often focus on CSR scores or ratings provided by extra-financial rating agencies like KLD in the US, or Vigeo in Europe. The interest of the COI survey is that it provides quantitative metrics of CSR related management practices rather than financial evaluation. As emphasized by Chatterji, Levine and Toffel (2009), extra-financial ratings are rarely evaluated and have been criticized for their own lack of transparency. Our measures of CSR related management practices offer a different but complementary approach to such social and environmental ratings as they rely on actual practices implemented by the firms, rather than evaluations (scores or ratings) based on past and/or expected future CSR behaviors. The limitation of our variables is that we do not cover CSR management practices related to human rights, community involvement or corporate governance. Yet, our database relies on a representative sample of several thousands French firms, whereas extra-financial agencies cover only several hundreds of (multinational) firms. Our results indicate that CSR management related practices in isolation impact differently on corporate performance measured by a firm’s profit, while an aggregate CSR indicator (measuring a purely quantitative strategy) is positively associated with firm profit only when
all dimensions are implemented. Moreover, the qualitative CSR measure based on interaction among its dimensions shows that the substitutability or complementarity of these dimensions is highly significant for firm performance. Additionally, different interactions of CSR dimensions have different effects on firm performance.
We believe that these results contribute to the CSR literature in several ways. First, rather than simply investigating the impact of one CSR dimension on firm performance, we analyze how different combinations of CSR dimensions affect firm performance measured by profit. Second, we use data on a representative sample of French firms, which permits us to construct two types of variables from the aforementioned questions. Additionally, employing this data allows us to control for a very detailed set of firm characteristics and features in order to properly isolate the effect of the quantity-quality trade-off between CSR dimensions on firm performance, to address the reverse-causality issues and to properly correct for the endogeneity of CSR variables. Finally, using a French database is appealing since empirical studies on CSR and firm business performance refer mainly to experience in the US.
This paper is organized as follows. Section 2 recalls the core of our analysis while section 3 builds testable hypotheses. Section 4 presents the data and method. Section 5 derives our empirical results and discusses the findings, and section 6 concludes the paper.
HYPOTHESES
It is becoming conventional wisdom today to define corporate social responsibility through the lenses of three main dimensions: environmental, social and governance (the so-called ESG factors). For instance, the United Nations Principles for Responsible Investment (UNPRI) was created in 2005 to provide a framework for ESG considerations in mainstream
investment, on the basis of the following types of indicators : energy efficiency and greenhouse gas emissions (Environmental component); staff turnover; training and qualification; and absenteeism rate (Social component) and litigation risks; corruption; revenues from new products (Governance and business behaviors towards customers and suppliers). Parallel to this phenomenon, legislation starting in the late 1990s has played an important role in the development of CSR in many OECD countries (see de Brito et al., 2001).
In turn, and drawing on previous research (e.g. Waddock and Graves, 1997; Cavaco and Crifo, 2010), we define CSR relying on four main categories: environmental performance, social performance, relationships with customers and suppliers and overall quality and safety management. It is worth noting that the choice of quality & safety dimension is based on the fact that CSR typically relies on implementing a culture of safety versus the cost of disaster, while quality management relates to the use of-or lack of-a robust failure mode and effects analysis (FMEA) to address process shortcomings. Corporate failures may often be associated with failed management systems and governance. So, such a dimension of CSR represents a specific governance form for quality & safety management. Many scholars find that quality management can act as a foundation and key catalyst for developing corporate social responsibility within organizations (see e.g. Mc Adam and Leonard, 2003; Zwetsloot, 2003).
Isolated and Aggregated Effect of CSR Dimensions on Firm Performance
Previous studies underline the differential effects of CSR dimensions on firm performance (e.g. Brammer and Pavelin, 2006). Therefore, it is likely that the impact of CSR on firm performance is contingent upon which dimension of social responsiveness is taken into consideration. Furthermore, the issue of whether each of our four dimensions of CSR (environmental performance, social performance, relationships with customers & suppliers,
and overall quality & safety management) are related to firm performance is far from resolved. For instance, several studies find a positive relationship between environmental practices or performance and economic performance (see e.g. Delmas and Pekovic, 2012; Konar and Cohen, 2001), but other results appear to be negative or non-significant (Barla, 2007; Filbeck and Gorman, 2004). The same types of results may be found for social and business behavior performance measures. Applying social screens may appear to affect performance positively (Statman, 2006) or negatively or insignificantly (Geczy, Stambaugh and Levin, 2005). For the customer & supplier dimension, many scholars note its importance for firms and an increasing number of recent studies now examine whether investment in customers & suppliers policies makes business sense. Results appear mixed as well (Zhu and Nakata, 2007; Hult, Ketchen and Arrfelt, 2007; Reitzig and Wagner, 2010). For instance, investment in better relations with suppliers may improve a firm’s knowledge about what can be transformed into improved performance outcomes (Hult et al., 2007). On the other side, investment in better relations with suppliers may create for a firm the opportunity costs of non-learning what could negatively affect its performance (Reitzig and Wagner, 2010). Regarding the impact of quality and safety management, previous literature confirms that quality practices may have different impacts on firm performance (see e.g. Grolleau, Mzoughi and Pekovic, 2012a, 2012b for comprehensive reviews). Inherently a multi-dimension construct, there is no reason to believe that one dimension (say the social dimension) affects firm performance in the same direction as another one (say environmental). In fact, different costs and revenues characterize management practices, affecting firm performance differently. Even if creating an aggregated measure of CSR hides the individual effects of each CSR dimension, using an aggregated construct of CSR may facilitate inter-firm comparison on the level of CSR established inside firms. However, previous research using aggregated CSR
constructs presents inconsistency in findings concerning the relationship between CSR and firm performance (e.g. Waddock and Graves, 1997; Surroca et al., 2010).
Thus, the first step in order to understand better the relationship between CSR and firm performance is to open the black box by examining how CSR dimensions in isolation and together influence firm performance.
Although the literature argues that the relationship between different dimensions of CSR and firm performance is not straightforward, extensive research conducted over the past 30 years tends to show a positive relationship, at least not a negative one between CSR and financial performance (Margolis et al. 2009; Margolis and Walsh, 2003; Orlitzky et al., 2003), and we therefore formulate the following hypothesis:
Hypothesis 1A: Isolated CSR dimensions exert a positive impact on firm performance.
Moreover, given the importance of each dimension of CSR, we expect that overall the firm’s tendency to demonstrate its social responsibility is positively associated with firm performance, and propose the following hypothesis:
Hypothesis 1B: Aggregate measure of CSR exerts a positive impact on firm performance.
The Complementarity or Substitutability Effect of CSR Dimensions
The contradictory results or the absence of consensus concerning relationship between CSR and firm performance may be explained by the role of interactions among the various components of CSR. Taking into account the interaction among various CSR dimensions reveals that complex mechanisms are at work in terms of responsible management practices,
with combinations exhibiting both complementarity and substitutability (see Cavaco and Crifo, 2010). It is important to point that the definitions of complementarity and substitutability that we use are borrowed from Athey and Stern (1998), and they are actually closed to the notions of supermodularity and submodularity in game theory. The definitions of complementarity and substitutability by Athey and Stern (1998) might seem counterintuitive with respect to conventional wisdom (at least concerning complementarity between goods) which associates complementarity with positive correlation and substitutability with negative correlation. Following Athey and Stern (1998), two CSR practices can both be positively correlated and substitutable. More precisely, having more than one CSR practice creates a complementary effect if the magnitude of the performance effect of these management practices altogether is strictly larger than the sum of the marginal effects from adopting only one practice (Ichniowski et al., 1997). In this sense, complementarity indicates that firms are likely to combine a set of practices since the benefits of such a complete pattern of practices are superior to the sum of the individual benefits (Whittington et al., 1999). A reason could be the existence of a synergistic effects of bundling practices together. What type of CSR practices can we expect to be complementary ? The Stakeholder theory of the firm argues that managing relationships between primary stakeholders (suppliers of capital, labor and other resources, customers an suppliers) can result in much more than just their continued participation in the firm, and yield long term competitive advantage (Hillman and Keim, 2001). Hence, we may expect complementarities between CSR related management practices towards primary stakeholders like employees, customers and suppliers, including quality management schemes which are essential when maintaining close relationships with customers (Pekovic, 2010).
A substitutability effect between CSR practices means here exactly the opposite. On can explain substitutability by the fact that although CSR dimensions have the same final
objective, individually they act differently. For instance, one firm can have great relations with its customers but also has a reputation for polluting the environment. The good relations with customers could not compensate for the environmental degradation. In this sense, Berens et al. (2007), examining the effect on product preferences, find that a poor corporate ability could not be compensated for by good CSR. Moreover, based on decision-making theory, it is argued that in forming general evaluation, negative attributes tend to outweigh positive attributes (e.g. Baumeister et al., 2001). Thus, we may argue that existing CSR dimensions inside a firm cannot compensate for missing CSR dimensions. Additionally, according to decision-making theory (see the so-called Choquet integral, Grabisch 1997), when two dimensions share some similar “substantial” attributes, then the interaction between these dimensions leads to substitutability. On the contrary, if two dimensions do not share similar “substantial” attributes, then the interaction between these dimensions leads to complementarity or additivity. For instance, green and social dimensions share some similar “substantial” attributes in the sense that it is difficult to implement a green dimension within a firm without implementing some attributes of the social dimension (Lehtonen, 2004; OCDE, 20062). As a consequence, when implementing both dimensions, the effect on the firm’s performance is equal to the sum (and is not higher than the sum, as in the case of complementary practices) of the effect of the green dimension and the effect of the attributes of the social dimension that are not included in the green dimension (or equivalently, it could be equal to the sum of the effect of the social dimension and the effect of the attributes of the green dimension that are not included in the social dimension). In the same sense, we argue also that green and customer & supplier dimensions share similar “substantial” attributes. Indeed environmental practices have become critical to a firm’s relationships with different stakeholder groups such as customers and suppliers (Barnett and Salomon, 2006; Grolleau,
Mzoughi and Pekovic, 2007). Moreover, substitutability between green and quality & safety dimensions is based on the fact that the principles of quality management apply equally to environmental performance improvements (Corbett and Klassen, 2006). According to the Stakeholder theory of the firm, using corporate resources to pursue issues that are not directly related to the relationship with primary stakeholders may not lead to sustained competitive advantage (Hillman and Keim, 2001). Here, this would mean that there should exist some trade-offs (substitutability) between primary and non-primary stakeholders (Cavaco and Crifo, 2010), that is between CSR practices towards employees, customers and suppliers, and quality and safety on the one hand; and towards the environment on the other hand. In fact, though the environment may be quoted as a stakeholder, it is often difficult to identify a direct spokesperson and therefore to embed it into the firm’s primary stakeholder category.
To conclude we expect a complementarity effect between social and customer & supplier dimensions3, customer & supplier and quality & safety dimensions, social and quality & safety dimensions; and substitutability effects between green and social dimensions; green and customer & supplier dimensions; green and quality & safety dimensions;.
Moreover, from a decision-making theory standpoint, the reasoning is the same when considering three or four dimensions. We simply have to count the number of non-trivial (i.e. non-empty or non-singleton) subsets of the considered set of dimensions whose components are complements and the number of subsets whose components are substitutes. If the former is higher than the latter, then the dimensions (included in the considered set of dimensions) are complements. Let us take, for instance, the case of the interaction between three
3
Even though one could argue that firm’s customer & supplier orientation strategy is based on some social attributes, we consider that they are not strong enough to produce the substitutability effect between social and customer & supplier dimensions. For instance, as argued by Ferrell (2004), in a highly competitive market, a firm could both have anti-social behavior and be strongly customer oriented.
dimensions: green, social and customer & supplier. They are three non-trivial subsets included in this set of dimensions: green and social; green and customer & supplier; and social and customer & supplier. As we indicated above, we expect that green and social and green and customer & supplier to be substitutes, while social and customer & supplier are complements. As a consequence the green, social, customer & supplier dimensions are substitutes. We formulate the following hypothesis:
Hypothesis 2: The interaction among different CSR dimensions generates:
♦
complementarity effects between social and customer & supplier; customer & supplier and quality & safety; social and quality & safety; social, customer & supplier and quality & safety.♦ substitutability effects between green and social; green and customer & supplier; green
and quality & safety green, social and customer & supplier; green, social and quality & safety; green, customer & supplier and quality & safety; green, social, customer & supplier, quality & safety.
DATA AND METHOD
Data
The data is extracted from the French Organizational Changes and Computerization’s (COI) 2006 survey.4 The COI survey is a matched employer-employee dataset on organizational change and computerization. Researchers and statisticians from the National Institute for Statistics and Economic Studies (INSEE), the Ministry of Labor, and the Center for Labor
4More details about the design and scope of this survey are available on www.enquetecoi.net: Survey COI-TIC 2006-INSEE-CEE/Treatments CEE.
Studies (CEE) created this survey. The survey contains 7,700 private sector firms with at least 20 employees each. It is a representative population of French firms from all business sectors except agriculture, forestry and fishing. Each firm filled in a self-administered questionnaire concerning the utilization of information technologies and work organizational practices in 2006, and changes that had occurred in those areas since 2003. Firms were also interviewed on the economic goals driving the decision to implement organizational changes and the economic context in which those decisions were made.
Within each surveyed firm, employees were randomly selected and asked about their personal socio-economic characteristics, as well as information about their job and position within the organization. The original dataset includes 14,369 employees. In order to obtain information on export volumes and profitability, the COI survey was merged with another database called
the Annual Business Survey (Enquête EAE, see
http://www.insee.fr/en/methodes/default.asp?page=definitions/enquete-annuelle-entreprises.htm). We use two editions of the EAE survey from 2003 (to obtain information on exports volumes and sales) and from 2006 (to obtain information on profit). As a result, our sample includes 4, 416 firms.
Dependent and Main independent Variables
We use as dependent variable, firms profit per employee. Existing studies often rely on accounting measures of financial performance (e.g. return on asset, return on equity, return on capital employed, return on sales) or market-based measures of financial performance (e.g. Tobin’s q), mainly because of data availability. Yet, a few papers rely on firm’s profitability indicators. For instance, Brammer and Pavelin (2006) use the ratio of pre-tax profits to total assets and Fernandez-Kranz and Santalo (2010) use average profits (in dollars) to control for firm profitability in their empirical estimations.
Our analysis provides a different but complementary approach to papers focusing on accounting or market measures. In fact, accounting measures are backward looking and capture past financial performance, but are subject to bias from managerial manipulation and differences in accounting procedures. Market measures are forward looking and are less dependent on accounting procedures but only represent the investor's valuation of the ability of a firm to generate future economic earnings. Basically, profitability indicators (like profit margins or ratio, and profits per employee) are usually considered as reflecting productivity whereas economic profitability would be captured by accounting measures and market value would be captured by market-based measures.
Concerning the main independent variables, the COI survey allows reliance on direct indicators of CSR related management practices grouped under four dimensions: green, social, business behavior towards customers and suppliers, and quality and safety practices. This approach is consistent with existing studies, which measure CSR with extra-financial ratings either through scores (e.g. continuous variable over the 0-100 interval) or through relative rankings, represented by a dummy variable that takes the value of 1 (respectively 0) if the firm is ranked above (respectively below) the sectoral average on the corresponding CSR dimension (see Cavaco and Crifo, 2010).
Our approach offers a perspective on CSR related management practices different than studies based on extra-financial scores or ratings provided by agencies like KLD in the US or Vigeo in Europe.
As emphasized in Chatterji, Levine and Toffel (2009) extra-financial rating examine firms’ environmental and social management activities and past performance, as well as future outlook. Such ratings aim to provide socially responsible investors accurate information that
makes transparent the extent to which firms’ behaviors are socially responsible. They usually rely on a variety of domains of corporate social responsibility. For instance, the European extra-financial agency Vigeo produces scores and ratings relying on six CSR dimensions: environment, human rights, human resources, governance, business behaviors towards customers and suppliers and societal commitment towards local community. Similarly, the American extra-financial agency KLD produces “strengths” and “concerns” relying on seven CSR dimensions: community, corporate governance, diversity, employee relations, environment, human rights, and product and business behaviors. For each dimension, there is a subset of criteria describing how the firm manages a particular aspect of the CSR dimension considered.
Here, our variables may seem less complete than those based on extra-financial scores or ratings as ratings. our approach in particular does not include the human rights, governance and societal commitment dimensions. The reason is simply that we do not have such information in our data base. However the advantages of the COI survey are to allow 1) the measuring of CSR directly through a CSR performance measure, 2) a CSR performance measure for 4416 firms which are representative of French firms. As a consequence, we expect more precise estimates.
Note in addition that our four CSR related dimensions gives a precise content to the conventional definition of CSR by the European Commission as “a concept whereby companies integrate social and environmental concerns in their business operations and in their interaction with their stakeholders by voluntarily taking on commitments which go beyond common regulatory and conventional requirements” (European Commission 2001).
Green. We use, in the survey, the variable denoted Green, which is a binary variable, coded 1 if the firm was registered according to one of the following standards i.e., ISO 14001 standard, organic labeling, fair trade, etc., in 2003.
Social. We construct a social indicator which presents the sum of the following six components: (1) the firm had undergone financial restructuring in the form of, for instance, merger, acquisition, transfer or buyback since 2003; (2) the firm had relocated an office or plant abroad since 2003; (3) the firm had central databases for human resources, training in 2003; (4) the firm had had internal and (5) external departments focused on human resources, training since 2003; (6) the firm used the internet for employees' learning or training in 2003. Moreover, in order to test our hypothesis concerning the complementarity and trade-off effects between CSR dimensions, we must harmonize the values of each CSR dimension. We solve this problem by converting the social dimension into a binary variable that takes the value of 1 if the social component is equal or superior to 2.19 (the mean of the sum of the previously mentioned components).
Customer & Supplier. We construct a customer & supplier indicator as the sum of twelve following items: (1) the firm used labeling tools for goods and services in 2003; (2) the firm was engaged in the delivery or supply of goods or services to a fixed deadline in 2003; (3) the firm was engaged in responding to claims or supplying after-sales service to a fixed deadline in 2003; (4) the firm had a contact or call center for customers in 2003; (5) the firm adopted integrated IT-CRM in 2003; (6) the main customer demanded that the firm comply with a quality standard or quality control procedure in 2003; (7) the firm signed contracts or was engaged with some suppliers in long term relationships in 2003; (8) on the firm’s demand, the main supplier complied with a quality standard or quality control procedure in 2003; (9) the main supplier had an IT system (for orders, invoices, etc.) linked to that of the firm’s in 2003; (10) the firm used tools to study customer expectations, behavior or satisfaction in 2003; (11)
the firm had had internal and (12) external departments focused on improving customer relations management since 2003. As for social dimension, to create a binary variable we calculate the mean of the sum of these 12 components and create a binary variable that takes the value of 1 if the customer and supplier component is equal or superior to 5.70 (the mean of the sum).
Quality & Safety management. We use the variable Quality & Safety, which is consistent with the three following items: (1) the firm was registered according to ISO 9000 standard (quality management); (2) the firm had had internal and (3) external departments focused on improving safety and environmental issues since 2003. Once again, we convert this variable into a binary one which equals 1 if the quality component’s mean is equal or superior to 1.58 (the mean of the sum).
From these four binary CSR dimensions, we constructed two types of variables:
CSR. In order to test the effect of aggregate measure of Corporate Social Responsibility on firm performance we create the variable CSR, which sums pu the four (binary) dimensions: (1) green; (2) social; (3) customer and supplier; (4) quality & safety management. From this CSR variable which varies from 0 to 4, we create four binary variables:
• CSR_1_0 = 1 if the firm has invested in only one CSR dimension (frequency= ? observations); and = 0 if the firm did not invest in any CSR dimensions (frequency= ? observations);
• CSR_2_0 = 1 if the firm has invested in two CSR dimensions (frequency= ? observations); and = 0 if the firm did not invest in any CSR dimensions;
• CSR_3_0 = 1 if the firm has invested in three CSR dimensions (frequency= ? observations); and = 0 if the firm did not invest in any CSR dimensions;
• CSR_4_0 = 1 if the firm has invested in all CSR dimensions (frequency= ? observations); and = 0 if the firm did not invest in any CSR dimension.
Interaction. To investigate the effect of complementarity and synergies between CSR dimensions, we create 15 variables, namely:
• Interaction1_0 = 1 if the firm invested only in green practices (frequency=161
observations); and = 0 if the firm did not invest in any CSR dimensions (frequency=2424 observations);
• Interaction2_0 = 1 if the firm invested only in social practices (frequency=379
observations); and = 0 if the firm did not invest in any CSR dimensions;
• Interaction3_0 = 1 if the firm invested only in customer & supplier practices
(frequency=893 observations); and = 0 if the firm did not invest in any CSR dimensions;
• Interaction4_0 = 1 if the firm invested only in quality & safety practices
(frequency=732 observations); and = 0 if the firm did not invest in any CSR dimensions;
• Interaction5_0 = 1 if the firm invested in both green and social practices
(frequency=32 observations) ; and = 0 if the firm did not invest in any CSR dimensions;
• Interaction6_0 = 1 if the firm invested in both green and customer & supplier
practices (frequency=253 observations); and = 0 if the firm did not invest in any CSR dimensions;
• Interaction7_0 = 1 if the firm invested in both green and quality & safety practices
(frequency=93 observations) ; and = 0 if the firm did not invest in any CSR dimensions;
• Interaction8_0 = 1 if the firm invested in both social and customer & supplier
practices (frequency=468 observations); and = 0 if the firm did not invest in any CSR dimensions;
• Interaction9_0 = 1 if the firm invested in both social and quality & safety practices
(frequency=481 observations); and = 0 if the firm did not invest in any CSR dimensions;
• Interaction10_0 =1 if the firm invested in both customer & supplier and quality &
safety practices (frequency=784 observations); and = 0 if the firm did not invest in any CSR dimensions;
• Interaction11_0 =1 if the firm invested in green, social and customer & supplier
practices (frequency=105 observations); and = 0 if the firm did not invest in any CSR dimensions;
• Interaction12_0 = 1 if the firm invested in green, social and quality & safety practices
(frequency=87 observations) ; and = 0 if the firm did not invest in any CSR dimensions;
• Interaction13_0= 1 if the firm invested in green, customer & supplier and quality &
safety practices (frequency=337 observations); and = 0 if the firm did not invest in any CSR dimensions;
• Interaction14_0 = 1 if the firm invested in social, customer & supplier and quality &
safety practices (frequency=1517 observations) ; and = 0 if the firm did not invest in any CSR dimensions;
• Interaction15_0 = 1 if the firm invested in all practices: green, social, customer &
supplier and quality & safety practices (frequency=1072 observations); and = 0 if the firm did not invest in any CSR dimensions;
Controls
In order to control for firm-level heterogeneity, our analysis includes variables representing firm characteristics and features based on previous studies, specifically those relating to Corporate Social Responsibility and firm performance (e.g. Capon et al., 1990; Waddock and Graves, 1997; Russo and Fouts, 1997; McWilliams and Siegel, 2000; Brammer and Milligton, 2008).
Size. In general, a positive relationship between Corporate Social Responsibility and size is found (e.g. Waddock and Graves, 1997; McWilliams and Siegel, 2000; Brammer and Milligton, 2008). Substantial research has also demonstrated that firm size significantly influences firm performance (e.g. Waddock and Graves, 1997), although the direction of its effect is not consistent (Russo and Fouts, 1997). So we introduce firm size, which is measured by a continuous variable representing the number of employees within the firm.
Holding. Being part of a holding company could play a considerable role in a firm’s decision to invest in Corporate Social Responsibility since those firms might have more financial resources available to them for investment in new practices (Pekovic, 2010). Concerning the relation between holding and firm performance, it is argued that being part of a holding company could improve firm performance through economies of scope (Delmas and Pekovic, 2012). Hence, we include a dummy variable that takes a value of 1 when the firm belonged to a holding company in 2003.
Market Uncertainty. A firm that is socially responsible may be able to increase interpersonal trust between and among internal and external stakeholders, build social capital, lower transaction costs, and, therefore ultimately reduce uncertainty (Orlitzky and Benjamin, 2001). Miller and Bromiley (1990) argue that uncertainty negatively influences firm performance. Therefore, we include a binary variable representing whether the firm had been affected strongly or very strongly by market uncertainty since 2003.
Market Conditions. Market expansion is expected to have positive influence on a firm’s probability of investing in Corporate Social Responsibility practices (Russo and Fouts, 1997). Drawing on Capon, Farley and Hoenig (1990), we may suppose that market growth positively influences firm performance. In order to control for market conditions effects we use three binary variables indicating different market conditions since 2003: down market, steady market and growing market.
Export. Previous empirical studies have confirmed that export activities positively influence a firm’s probability of investing in Corporate Social Responsibility practices (Grolleau et al., 2007: Delmas and Montiel 2009; Pekovic, 2010). Export activities lead to firm performance improvements that have been identified as “learning by exporting” (Bernard et al., 2003). We use a continuous variable representing the firm’s volume of exports divided by the firm’s sales in 2003.
R&D. McWilliams and Siegel (2000) argue that R&D and CSR are positively correlated, since many aspects of CSR create either product innovation or process innovation, or both. An important literature links investment in R&D to improvements in long-term economic performance (Griliches, 1979; Capon et al., 1990). In this study, R&D is based on two variables that indicate if a firm collaborated on its R&D activities in 2003 with private businesses or laboratories, or with the Centre for National Scientific Research, universities or other public bodies.
Advertising Intensity. A firm’s CSR orientation might not be evident to the buyer directly, so advertising playing an important role in raising the awareness of those individuals who are interested in buying goods with CSR attributes (McWilliams and Siegel, 2000, 2001; Brammer and Pavelin, 2006; Brammer and Milligton, 2008). Capon et al. (1990), Russo and Fouts (1997) and McWilliams and Siegel (2000) consider advertising intensity as an important determinant of firm performance. To control for this effect, we create a variable
denoted Advertising Intensity, which is based on two variables that indicate whether the firm reported its financial or planned actions activities in 2003.
Sector of Activity. The characteristics of a firm’s sector of activity have been considered to be a key influence on its corporate social orientation (e.g. McWilliams and Siegel, 2000). The inclusion of the firm’s sector is essential since it has been shown to explain variation in firm performance across industries, such as economies of scale and competitive intensity (McWilliams and Siegel, 2000). In order to control for sector differences, we include ten sector dummy variables based on the N36 sector classification created by the French National Institute for Statistics and Economic Studies: agri-food; consumer goods; cars and equipment; intermediate goods and energy; construction; sales; transport; financial and real-estate activities; and business services and individual services.
The variables used in estimation, their definitions and sample statistics are presented in Table 1.
[Insert Table 1 about here]
Estimation Strategy
Explaining the strategy
We will run two kinds of estimates. a. The first type of estimates
In the first type of estimates that we called Quantity estimates, we run four regressions with respectively CSR_1_0, CSR_2_0, CSR_3_0 and CSR_4_0 as independent variable. Let us
remark that since the variables CSR_1_0, CSR_2_0, CSR_3_0 and CSR_4_0 have the
same reference (which is CSR = 0), then we can compare the results of the four
b. The second type of estimates
In the second type of estimates that we called Quality estimates, we use run fifteen regressions with respectively Intercation_1_0 to Interaction_15_0 as independent variable.
Let us remark that since Interaction_1_0 to Interaction_15_0 have the same reference
(the case where no CSR dimension is implemented), then we can compare the results of
the fifteen regressions. Moreover since the case where no CSR dimension is
implemented corresponds exactly to CSR=0, then we can compare the results of the
quantity and the quality estimates.
Tackling with the endogeneity issue
It should be noted that the same factors (e.g. size, sector of activity, firm’s strategy, etc.) may have an impact on firm performance and the firm’s likelihood to invest in Corporate Social Responsibility, environmental standards, social practices, customer & supplier practices, quality & safety practices. Thus, in order to correct for possible endogeneity, we rely on the Simultaneous Equations Model (SEM), which considers environmental standards, social practices, customer and supplier practices, quality and safety practices, aggregations and interactions of CSR dimensions as endogenous variables.5 This model relies on a simultaneous estimation approach in which the factors that determine CSR dimensions, aggregation and its interactions (a) are estimated simultaneously with those defining the firm’s profit (b). The two equations are jointly estimated using maximum likelihood.
5 Let us remark that in our case, the explanatory variables that are supposed to be endogenous are dummy variables like the environmental standards, social practices, customer and supplier practices, or regulation practices. We use the Roodman (2009) cmp command in Stata in order to estimate our model. The advantage of this command is that it allows for different formats (e.g. binary, censored and continuous) of the dependent variables in the system of equations.
In the following SEM, * * 1and 2
Y Y are latent variables that respectively, influence the probability that firms invest in different combinations of CSR dimensions and improve their profitability:
∗ = + + +
∗= + + + (1)
where X1 and X2 are here the same and include some exogenous variables such as
characteristics and features of the firm as size, being a part of a holding group, market uncertainty, market conditions, exporting activities, R&D strategy, advertising and sector activity.
In our case, Y2* is fully observed, however Y1* is observed (and then writes Y1) if it is higher than a threshold. The variable Z1 represents the vector of instrumental variables that guarantee the identification of the model and facilitate the estimation of correlation coefficients (Maddala 1983). A SEM circumvents the problem of interdependence by using instrument variables to obtain predicted values of endogenous variables (in our case, CSR dimensions, aggregation form of CSR and its intersections). Since we take X1 and X2 as
identical, then in order to to identify the model, we need only one additional variable that explains the probability of the firm investing in CSR or its dimensions but is not correlated with the error term of firm performance equation. In order to secure our estimates, Z1 includes three variables: (1) firm’s distance from main customer in 2003 (located in within 30 kilometers of the customer), (2) firm’s distance from main supplier in 2003 (within 30 kilometers of the supplier), (3) firm used workgroup tools in 2003. Several rationales can explain why these variables affect Corporate Social Responsibility. Concerning a firm’s distance from customers and suppliers, in a signaling or screening rationale, firms that have
distant customers or suppliers are more likely to prove their commitment to social responsibility (Grolleau et al., 2007) in order to satisfy their customers and to give an example to their suppliers. Certain elements of Corporate Social Responsibility such as ISO 9000 standards, ISO 14000 standards, CRM, are considered as institutional devices that may prove a firm’s commitment to Corporate Social Responsibility. King et al. (2005) showed that the distance to customers had a significant positive impact on firms’ decisions to adopt the ISO 14000 standard. On the other hand, firms belonging to certain sectors could pay more attention only to customers and suppliers in their near vicinity (Grolleau et al., 2007). Therefore, we expect both positive and negative effect on CSR and its dimensions of two variables representing the distance between a firm and its stakeholders. Furthermore, workgroup tools are considered as an important instrument of a firm’s social responsiveness toward employees (Surocca et al., 2010). Using group work tools could help employees to enhance their knowledge and motivation to understand the problems, identify solutions and implement improved practices related to social responsibility (Hart, 1995). In our SEM,β1,β2 ,γ1,γ2,δ1 andδ2 are the slope coefficients to be estimated; α1,α2, µ1 and µ2 are the intercepts and the disturbance terms for the two equations, respectively. To address reverse-causality issues, given that strong profitability will allow a firm to invest time and effort in CSR and its dimensions, we modeled lagged effects by estimating the impact of investment in CSR in 2003 on profit in 2006.
How to check the hypotheses 1A, 1B and 2?
- In order to test the hypothesis 1A (i.e. isolated CSR dimensions exert a positive impact on firm performance), we take as the reference the case where no CSR dimension is implemented and we look at the effect of (1) Greene practices only (2) Social practices only (3) Customer & Supplier only and (4) Quality & Safety practices only, on firm’s profit.
- In order to test the hypothesis 1B (i.e. aggregate measure of CSR exerts a positive impact on firm performance), we take as the reference the case where no CSR dimension is implemented and we look at the effect of (1) having one CSR dimension (2) having two CSR dimensions (3) having three CSR dimensions (4) having all four CSR dimensions, on firm’s profit.
- In order to test the hypothesis 2 concerning complementarity and substitutability (in the sense of Athey and Stern 19986). Remind that complementarity among some CSR dimensions means that the impact of interaction among different these CSR dimensions on firm performance is greater than the sum of the impacts of each dimension involved in the interaction. Therefore, complementarity is tested by looking at the coefficient associated with the interaction variables when examining their impact on profit.
For instance, Interaction7_0 presents the interaction between Green and Quality & Safety practices. Let α7 be the associated coefficient. If α7 > α1 + α4, where α1 + α4 are respectively the coefficient associated with Interaction1_0 (having only Green practices) and Interaction4_0 (having only Quality & Safety practices), then we conclude that there is a complementarity between the Green and the Quality & Safety dimensions of CSR.
It may not be immediate for some readers why this method permits to catch up complementarity or substitutability. Let us take the example of the Green and Quality & Safety practices. Let us neglect the endogeneity problem, then the obvious way to test complementarity is to estimate over the whole sample the model (A1): Y = α + β1Green + β2QS + γGreen.QS, and to compare β1+β2 and γ. One can obtain the same results by running three estimates over three sub-samples:
6
We use the definition by Athey and Stern (1998), when the choice is binary and the interaction effects are fixed across firms.
1) Over the sub-sample which includes both firms having no green and no QS and firms having green but no QS, estimates the model (A2) : Y = α + β1Green_Alone;
2) Over the sub-sample which includes both firms having no green and no QS and firms having QS but no green, estimates the model (A3) : Y = α + β2QS_Alone;
3) Over the sub-sample which includes both firms having no green and no QS and firms having both green and QS, estimates the model (A4) : Y = α + γGreen&QS.
It is easy to see that the α in the four models (A1), (A2), (A3) and (A4) are the same and represent the average profit per head of firms having no green and no QS. Likewise, the β1 in models (A1) and (A2) are the same and represent the difference between the average profit per head of firms having green but no QS and firms having no green and no QS. In the same vein, the β2 in models (A1) and (A3) are the same and represent the difference between the average profit per head of firms having QS but no green and firms having no green and no QS. Finally the γ in models (A1) and (A4) are the same and represent the difference between the average profit per head of firms having both green and QS and firms having no green and no QS. As a consequence we can test complementarity between green and QS by comparing β1+β2 and γ.
Some readers might wonder why we choose to work over sub-samples having the same reference, instead of over the whole sample. The reason is that in order to take into account the endogeneity issue, if we work over the whole sample then Y1 the dependent variable in the equation (a) of model (1) is multinomial. However if we works over subsamples, Y1 is binomial, making it easier to estimate model (1) by maximum likelihood.
The main results of the SEM estimation are presented in Table 2 and Table 3. Note that our analysis also provides information about determinants of CSR dimensions in different forms and firm profitability. Even though we will not discuss them in detail, we may conclude that the obtained results generally confirm the findings of previous studies (e.g. Capon et al., 1990; Waddock and Graves, 1997; Russo and Fouts, 1997; McWilliams and Siegel, 2000; Brammer and Milligton, 2008).7
[Insert Tables 2 and 3 about here]
Isolated Effect of CSR Dimensions
From Table 2 we observe that compared to the case where no dimension is implemented, having a green practice has a positive effect on profit per employee. The findings are consistent with previous studies (e.g. Konar and Cohen, 2001) showing that improvement of a firm’s performance is one of the main triggers of a firm’s decision to invest in environmental practices. Moreover, we obtain similar results concerning the effect of social practices on a firm’s profitability, which confirms findings from previous studies (e.g. Statman, 2006). However, the customer & supplier dimension has a negative effect on a firm’s profit, which suggests that highly demanding practices implemented in isolation and not as part of coherent management practices bundle may be detrimental to profit opportunities. The obtained result is consistent with a study by Bozarth et al. (2009) showing that an increase in supply chain complexity resulting from such types of innovative customer-supplier practices investment has a negative impact on plant performance. Intuitively, the results suggest that investment in customer & supplier practices imposes constraints on a firm that result in profitability decrease probably due to an increase of costs. How is it possible that a firm implements
practices which have a negative effect on its profit? This result could be due to the fact that the implementation of customer & supplier practices produces only a short-term negative effect on a firm’s profit. Actually, adoption of those practices is positively associated with several benefits, such as improved firm reputation, better customer and supplier’s loyalty, trust and commitment, knowledge of market trends, which help a firm to enhance its performance in the long-term. In this sense, Deshpandé, Farley and Webster (1993) argue that customer orientation helps a firm to develop profits long-term. Furthermore, the coefficient of quality & safety practices on profit is positive and statistically significant. This is consistent with studies showing a positive impact of quality practices on firm performance (e.g. Corbett, Montes-Sancho and Kirsch, 2005). Therefore, we may conclude that our Hypothesis 1A is partly confirmed since green, social and quality & safety dimensions of CSR in isolation exert a positive impact on a firm’s profit. However, the customer & supplier dimension exerts negative impact. In other words, the different dimensions of CSR influence a firm’s profitability differently, which is in the line with previous studies (e.g. Mackey et al., 2007; Brammer and Milligton, 2008). Our results confirm those of Barnett and Salomon (2006) which indicate that the effect of CSR varies not only in the intensity, but also in the types of social dimensions employed. Therefore, using a single specific dimension of CSR when examining its relationship with firm performance does not show the “complete” effect. Our results are also consistent with studies showing that firms with better ESG performance tend to face significant lower capital constraints, and that the relation is primarily driven by social and environmental performance (El Ghoul et al. 2011; Cheng, Ioannou and Serafeim, 2011).
The Complementarity or Substitutability effect of CSR Dimensions
Let us turn now to the interaction between each CSR dimension. One can note that the interactions are either positive or neutral but are never negative. Table 2 shows that six types
of interactions are associated with positive and significant coefficients: Green and Social; Green and Quality & Safety; Social and Quality & Safety; Green, Social and Quality & Safety; Green, Customer & Supplier and Quality & Safety; Green, Social, Customer & Supplier and Quality & Safety. Five interactions are associated with non-significant coefficients: Green and Customer & Supplier; Social and Customer & Supplier; Customer & Supplier and Quality & Safety; Green, Social and Customer & Supplier; Social, Customer & Supplier and Quality & Safety.
Of course, a neutral or positive interaction between some dimensions does not necessarily lead to a complementarity between these dimensions. Indeed, when testing for complementarity and substitutability effects, we observe five patterns where the dimensions involved are substitutes (Green and Social; Green and Quality & Safety; Social and Quality & Safety; Green, Social and Quality & Safety; Green, Social, Customer & Supplier and Quality & Safety) and six where the involved dimensions are complements (Green and Customer & Supplier; Social and Customer & Supplier; Customer & Supplier and Quality & Safety; Green, Social and Customer & Supplier; Green, Customer & Supplier and Quality & Safety; Social, Customer & Supplier and Quality & Safety). Therefore, we partly confirm Hypothesis 2. However, there are three points of divergence. Hypothesis 2 predicts the substitution effect between green and customer & supplier dimensions; green, social and customer & supplier dimensions; green, customer & supplier and quality & safety dimensions, while the empirical results indicate a complementary effect. Based on the results, we may notice that, generally, the interaction with customer & supplier dimension produces substitutability effects rather than complementarity. Thus, we may conclude that even if green and quality & safety dimensions have some common characteristics with the customer & supplier dimension, these common features are not enough to produce substitution between those dimensions. The Stakeholder theory is only partially confirmed here, in the sense that some primary
stakeholders are relative complements in terms of CSR practices (employees and customers, suppliers; customers and suppliers and quality and safety associates) but other are relative substitutes (employees and quality and safety associates). The environment appears as non-primary stakeholder relatively substitutable to non-primary stakeholders (except customers and suppliers) from a CSR perspective, with a similar kind of results that was found in Cavaco and Crifo (2010).
The Magnitudinal Effect for Moving from one Configuration to Another
Let us now analyze the magnitudinal effect for moving from one configuration of dimension(s) to another. We ask whether a firm starting with some configurations cannot perform better (in terms of profit) by adding or removing some dimension(s). Only two configurations fulfill this requirement: Green and Social; Green and Quality & Safety. The interpretation is that when a firm starts with one of these two configurations then it is better not to move to another configuration. In all other configurations, firms can always improve their profits either by adding or removing some dimensions. So from the point of view of their effects on firm performance, the Green and Social; Green and Quality & Safety can be considered as “optimal”. Three remarks can be made from these results. Firstly, they point to the pivotal role of the Green dimension since it is included in the two “optimal” solutions. Secondly, they show that substitutability does not necessarily lead to overall inefficiency. In our cases, the green and social dimensions are clearly substitutes, as are the Green and Quality & Safety dimensions. Thirdly, our results suggest that the implementation of CSR dimensions by firms is a path-dependent process. That is, the CSR configuration that is in place within firms is the result of their successive past choices of CSR dimensions, in particular at the starting point. In other words, most firms seem to use an adaptative
implementation process instead of a purely rational calculus of the best configurations. Indeed, the two “optimal” solutions are not used by all firms.
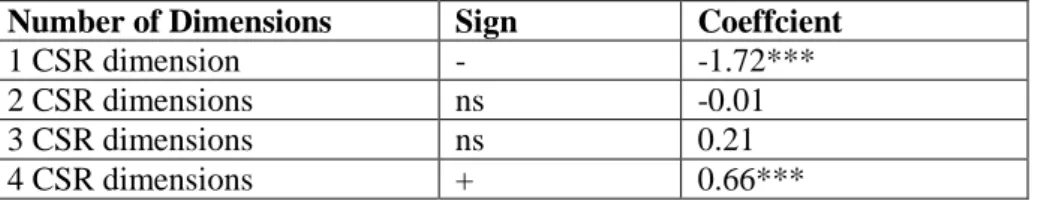
Aggregated Effect of CSR Dimensions and the Quality-Quantity Trade-off
From Table 3, we observe that our aggregate measure of CSR, which counts quantitatively the number of practices adopted in terms of environmental, social, customers & suppliers, and quality & safety practices, affects positively and significantly firm performance only when a firm implements all four dimensions of CSR. On the contrary, investing in only one CSR dimension influences negatively a firm’s profitability, while investing in two or three dimensions does not impact on a firm’s profit. In other words, the findings suggest that investment in only one CSR dimension creates only cost for a firm, which is negatively reflected in profit, while investing in two or three dimensions is not sufficient to improve a firm’s profit. The estimates suggest that a purely quantitative strategy consisting of accumulating CSR dimensions works only when all four practices are implemented inside the firm. This last result is consistent with the few studies that also consider several categories of CSR tasks in their theoretical and empirical analyses and show that the overall effect of CSR on financial performance (either accounting or market based measures) is positive (see e.g. Waddock and Graves, 1997; Hull and Rothenberg, 2008; Margolis et al., 2009). Therefore, the findings only partly support Hypothesis 1B, indicating that an aggregate measure of CSR is positively associated with firm performance. The choice of interaction of CSR dimensions matter for a firm’s profit. In this sense, firms that want to achieve business performance improvement through investment in CSR dimensions need to achieve a “fit” between the types of CSR dimensions that they implement (e.g. Brammer and Pavelin, 2006). Additionally, as suggested by Mackey et al. (2007) and Brammer and Milligton (2008), our findings confirm that at least some (specific) forms of CSR improve firm profitability. In
particular a “quantitative” strategy- based on accumulating environmental, social, customers & suppliers, and quality & safety practices- is important for firm performance provided that all four dimensions of CSR are effectively implemented altogether. However, relying on one, two or three practices in isolation turns out to be unprofitable. On the other hand, a “qualitative” strategy based on implementing a specific consistent set of CSR practices proves partially profitable (five combinations have no significant effect on profit, while six others have a positive significant effect). To conclude, the profitability of CSR investments in French firms seems to rely on a specific qualitative mix of the CSR dimensions rather than a pure quantitative approach accumulating practices without designing a consistent set of interactions among them.
CONCLUSION
To date, the extant and ever-growing theoretical and empirical research has identified no clear pattern in the relationship between CSR and firm performance (Brummer, 1991; McWilliams and Siegel, 1997; Waddock and Graves, 1997; McWilliams and Siegel, 2001). Generally, the literature argues that one of the main reasons for this absence of consensus is associated with measurement problems (e.g. Surocca et al., 2010). Given this concern, we perform a quantity-quality trade-off analysis between the various dimensions of Corporate Social Responsibility in order to provide a richer conceptualization and understanding concerning the relationship between CSR and firm performance. For this purpose, we first examine the impact of each determinant of CSR separately (environmental performance, social performance, customer & supplier approach, and quality & safety practices), which permits to us to understand how CSR measures in isolation impact on firm’s profitability. Our results are not the same across the different dimensions, indicating the differential effects of CSR dimensions on firm profit.
More precisely, comparing to the case where no dimension is implemented, having a green, social or quality & safety dimension has a positive effect on profit per employee. However, the customer & supplier dimension has a negative effect. Second, we create an aggregate measure of CSR indicator based on our four CSR dimensions. We observe that the aggregate measure of CSR positively and significantly affects firm performance only when all dimensions are used. Third, we study how the interactions between different CSR dimensions affect corporate economic performance. We identified the forms of CSR that are associated with a positive significant coefficient. When testing for complementarity or substitutability of the dimensions, we observe both patterns. More precisely, we observe five interactions in which the dimensions are substitutes and six interactions in which the dimensions are complements.
In sum, while our findings are consistent with those supporting a positive relation between CSR and firm profitability (e.g. Cochran and Wood, 1984; Turban and Greening; 1996; Waddock and Graves, 1997; McWilliams and Siegel, 2001; Godfrey, 2004), additional analysis confirms McWilliams and Siegel’s argument (2000) indicating that their relationship is very complex. Our findings suggest two sources of this complexity: (1) the CSR and firm performance relationship is not homogeneous when examining different dimensions of CSR; (2) the interaction among different CSR dimensions produces different effects on firm performance.
Our findings have important implications for policy-makers. They suggest that managers need to be careful in choosing appropriate CSR tasks since those dimensions need to be compatible with each other and with a firm’s overall strategy. Therefore, the question for managers is not simply whether to invest in social responsibility; it is rather what form of social responsibility is suitable for a specific firm’s strategy. Additionally, the results suggest that different forms