UNIVERSITE PARIS-DAUPHINE
ECOLE DOCTORALE DE DAUPHINE
Centre de Géopolitique de l'énergie et des matières premières (CGEMP-LEDa)
INTEGRER L’AGRICULTURE DANS LES POLITIQUES
D’ATTENUATION CHINOISES
***
INTEGRATING AGRICULTURE INTO THE CHINESE
MITIGATION POLICIES
Thèse pour l’obtention du titre de
DOCTEUR EN SCIENCES ECONOMIQUES
Présentée et soutenue par
Wen WANG
le 15 janvier 2015
devant le jury composé de :
M. Christian de Perthuis Professeur associé à l'Université Paris-Dauphine Directeur de thèse
M. Dominic Moran Professeur à Scotland's Rural College Rapporteur
M. Philippe Delacote Chargé de recherche à l’Institut National de la Recherche Agronomique
Rapporteur
M. Erda Lin Professeur à Chinese Academy of Agricultural Examinateur
M. Patrice Geoffron Professeur à l'Université Paris-Dauphine Examinateur
M. Pierre-André Jouvet Professeur à l'Université Paris Ouest-Nanterre Examinateur
2
L’Université Paris-Dauphine n’entend donner aucune approbation ni improbation aux opinions émises dans les thèses: ces opinions doivent être considérées comme propres à leurs auteurs.
3
Acknowledgement/ Remerciement
First and foremost, I would like to express my deepest and sincere gratitude to my PhD advisors Prof. Christian de Perthuis and Prof. Lin Erda. It has been an honor to be their PhD student. This dissertation is the fruit of an international cooperation between the two research centers in France and China. My PhD studies would not be possible without their continuous supports, insightful guidance, and encouragement during the past four years from the two countries. I appreciate all their contributions of time, ideas and funding to make my research experience productive and simulating. Their observations and suggestions helped me to establish the overall orientation of the research and to move forward to achieve my goal. I’m deeply inspired by and benefit a lot from their solid expertise as well as passionate working attitudes.
I am especially grateful for Prof. Dominic Moran at Scotland's Rural College who devoted a lot of time and energy to help me on the MACC research, offered opportunities to have access to required information, and engaged me in exciting research projects. My sincere thanks also go to Prof. Ju Xiaotang at the Chinese Agricultural University who provided insightful opinions on the research directions and gave continuous supports to my research work.
I thank all the colleagues at the Climate Economics Chair in France and the Climate Change and Agriculture research group of Chinese Academy of Agricultural Sciences. Both groups have been a source of friendships as well as good advice and collaboration. I am grateful for Prof. Patrice Geoffron and Prof. Pierre-André Jouvet for their academic advices as well as their help in administrative procedure. It is my honor to be able to contribute to the research initiative “Agriculture, Food, Forestry and Climate Change” of the Chair and thanks Philippe Delacote, Benjamin Dequiedt, Gabriela Simonet and other members of the team. I wish to express my sincere appreciation to Preety Nadarasapillay, Raphaël Trotignon, Boris Solier, Simon Quemin, Stephane Buttigieg and other colleagues at the Chair. It has been such a joy to be able to work with you and thanks for your help on both my work and daily life. In regards to the CAAS research team, I would like to acknowledge Prof. Ju Hui and Prof. Guo Liping for their scientific assistance and Li Yingchun, Gao Ji, Han Xue, Hu Wei for their kindest help and those who gave me the possibility to complete this thesis. I appreciated the collaboration with Dali Rani Nayak at University of Aberdeen and Frank Koslowski at Scotland’s Rural College via the MACCs and other research.
I would like to take this opportunity to extend my gratitude to my colleagues in BlueNext S.A who has financed the first three year of my research work. I would like to thank the Business Development Team of BlueNext - Claire Dufour, Pierre Guigon and David Rapin, for their enthusiastic help whenever necessary.
4
Last but not least, I would like to thank my family and friends for all their love and encouragement. My parents and my brother are faithful and supportive in all my pursuits. And most of all thanks to my husband Fu Qiang who has always been supportive, encouraging, and patient in my life.
5
Abstract in English
This thesis provides an integrated evaluation of the overall technical and economic mitigation potential in Chinese agriculture and the conditions of putting a carbon price in this sector. The research scope is cropland emissions and particularly those related to synthetic nitrogen fertilizer use. The thesis is articulated around the construction of a bottom-up marginal abatement cost curve (MACC) which offers a rational framework for combining biophysical and economic data to reflect mitigation costs and potentials. This tool allows the aggregation of mitigation potentials arising from the application of a subset of cost-effective measures above a notional baseline level. An analysis of Chinese climate policies reveals that agriculture is nearly absent in the current national mitigation strategy. We therefore intend to assess the technical, economic and political feasibility of integrating agriculture into domestic mitigation policies. In the first place, the emissions trends and calculation methods are assessed to determine a rigorous approach to build baseline scenarios from projected business-as-usual activities to 2020. Secondly, we identify nine cropland mitigation measures and evaluate their abatement rates and future applicability beyond the baseline scenario to conclude a total feasible technical mitigation potential. The economic potential of each scenario is then compared by using estimated implementation costs of different mitigation measures relative to conventional farming practices. The MACC results show that agriculture provides significant mitigation potentials and is able to offset about one-third of the baseline emissions. In addition, realisation of one-third of this mitigation potential is cost-negative for farmers. We finally examine the conditions of using economic instruments to reduce emissions at the lowest cost for the agricultural sector. Given the institutional, behavioural and social obstacles, we strongly suggest restructuring the current fertilizer subsidy regime to send a clear political signal from central planning. Scaling-up offset projects using carbon intensity as the standardized baseline is recommended and could pave the way for an experimental emission trading scheme in agriculture. In light of China’s strong concern on safeguarding its food security, case studies on regional cereal production are carried out in all steps, including the analysis of provincial greenhouse gas intensity of production, regional abatement potential related to synthetic nitrogen fertilizer use as well as disparities of implementation cost among certain regions.
Key words: Chinese agriculture, marginal abatement cost curve, cost effectiveness, mitigation
6
Résumé en français
Cette thèse offre une évaluation du potentiel d'atténuation technique et économique global dans l'agriculture Chinoise et des conditions nécessaires à la formation d’un prix du carbone dans ce secteur. Le champ de recherche inclut les émissions venant de terres cultivées et en particulier celles liées à l'utilisation d'engrais azotés synthétiques. Il s'articule autour de la construction d'une courbe de coûts marginaux de réduction (MACC), qui offre un cadre rationnel pour combiner les données biophysiques et économiques afin de refléter les coûts et les potentiels d'atténuation. Cet outil permet d'agréger le potentiel d'atténuation découlant de l'application d'un sous-ensemble de mesures coût-efficacité en dessus d'un niveau de référence désignée. Une analyse des politiques climatiques chinoises révèle que l'agriculture est presque absente de la stratégie nationale d'atténuation. Nous avons donc l'intention d’examiner la faisabilité du point de vue technique, économique et politique, d’intégrer l'agriculture dans les politiques domestiques d’atténuation. En premier lieu, la tendance et les méthodes de calcul des émissions sont évaluées afin de déterminer une approche rigoureuse permettant de construire des scénarios de référence à partir de prévisions des activités ‘business-as-usual’ pour 2020. Deuxièmement, nous identifions neuf mesures d'atténuation des sols cultivés, nous évaluons leur taux d'abattement et leur applicabilité future au-delà du scénario de base pour obtenir un potentiel total d'atténuation techniquement faisable. Leur traduction en potentiel économique est alors faite en comparant les coûts de mise en œuvre des différentes options d'atténuation relatives aux pratiques agricoles conventionnelles. Les résultats des MACC montrent que l’agriculture offre un potentiel d'atténuation important, qui pourrait compenser environ un tiers des émissions de référence et dont un tiers pourrait être réalisé au coût négatif pour les agriculteurs. Nous examinons enfin l’utilisation des instruments économiques pour réduire les émissions au moindre coût dans le secteur agricole. Compte tenu des obstacles institutionnels, comportementaux et sociaux, nous suggérons fortement d’engager une réforme dans le système des subventions d'engrais afin d'envoyer un signal politique clair aux agriculteurs. L’utilisation de l’intensité du carbone comme référence normalisée est recommandé pour améliorer et élargir l'accès aux projets de compensation, et peut aussi préparer le terrain pour un possible programme expérimental d'échange de quotas d’émissions dans l'agriculture. En cohérence avec la priorité de protéger la sécurité alimentaire en Chine, des études de cas sur la production régionale de céréales sont introduites dans toutes ces étapes, y compris l'analyse de l'intensité des gaz à effet de serre de la production dans chaque province, le potentiel régional de réduction des émissions liées à l'utilisation d’engrais azotés ainsi que la disparité de coûts de mise en œuvre dans certaines régions.
Mots clés: agriculture chinoise, courbe de coûts marginaux de réduction, coût-efficacité, potentiel
7
Table of Contents
Abstract in English ... 5
Résumé en français... 6
Introduction ... 13
Chapter 1 -
General overview of climate policies in China ... 25
1. Chinese GHG emissions and drivers of CO2 emissions growth ... 26
1.1. GHG emissions according to national inventories ... 26
1.2. Historic trends of CO2 emissions from fossil fuel combustion and cement production ... 27
1.3. Drivers of CO2 emissions growth in China... 29
2. From international engagement to national climate policies ... 31
2.1. Framework of climate policy marking in China ... 31
2.2. China’s engagement in international climate negotiations ... 31
2.3. Inclusion of climate targets into national development plans ... 33
3. Policies and actions to meet the mitigation targets ... 34
3.1. Climate and energy related policies throughout 2011-2015 ... 34
3.2. Energy intensity evolution in China ... 36
3.3. Scenarios of future CO2 emissions in China ... 38
3.4. China on track to meet the 2015 and 2020 climate targets? ... 39
4. Conclusion ... 40
Chapter 2 -
Agriculture emissions: past trends and construction of future
baseline scenario ... 43
1. Chinese agriculture development and major policies ... 44
1.1. Rapid agriculture development and food security priority ... 44
1.2. Current and near-future national agriculture policies ... 46
2. Accounting agricultural emissions and past trends ... 47
2.1. Primary source of CH4 and N2O emissions ... 47
2.2. Origin of important CO2 emissions ... 49
8
3.1. General methodologies of accounting N2O emissions from cropland ... 50
3.2. A case study of GHG intensity of cereal production ... 52
4. Building a baseline for future GHG emissions from Chinese agriculture ... 55
4.1. Projection of future agriculture activities ... 55
4.2. Projection of N consumption by crop production ... 56
4.3. Results of business as usual scenario emissions from agriculture ... 58
5. Conclusion ... 59
Chapter 3 -
Technical mitigation potential in China’s croplands ... 61
1. Mitigation measures and abatement rates ... 62
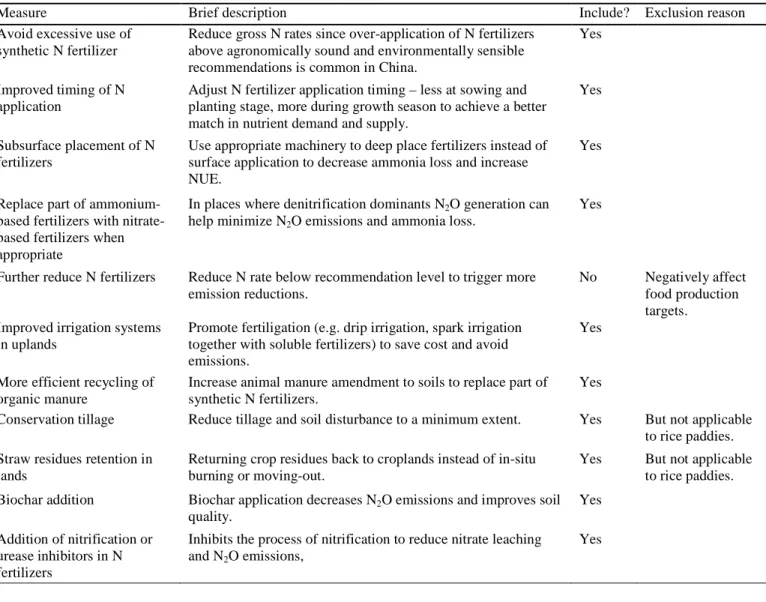
1.1. Selection of mitigation measures ... 62
1.2. Estimation of abatement rates of mitigation measures ... 66
1.3. Treatment of measure interactions ... 70
2. Which technical potential can be realized from Chinese croplands? ... 72
2.1. Measure adoption additional to the baseline scenario ... 72
2.2. Maximum feasible mitigation potential from croplands ... 74
3. Case study: mitigation potential from cereal production in China ... 74
3.1. Current and historical GHGI of cereal production at the provincial level ... 75
3.2. Abatement rate of N fertilizer management at provincial level ... 80
3.3. Mitigation potential from best N management practices ... 81
4. Conclusion ... 84
Chapter 4 -
Economic mitigation potential in Chinese croplands ... 87
1. MACC tool introduction and approach selection ... 88
1.1. Literature review of existing agriculture MACCs ... 88
1.2. Choice of methodological approach for MACC construction ... 90
2. Estimation of measure implementation cost ... 91
2.1. Evaluating benefits/costs implications of adopting mitigation measures ... 92
2.2. Forecast of future production input and input price ... 94
2.3. Illustration of cost calculation of the measure organic addition to rice paddies ... 95
3. MACC results and abatement scenarios ... 96
3.1. MACC construction and results ... 96
9
3.3. Regional disparities in MACC results ... 100
4. Discussions and sensibility analysis ... 102
4.1. Comparisons with other MACC studies ... 102
4.2. Uncertainties and sensitivity analysis ... 105
4.3. Significances and limits of MACC studies ... 106
5. Conclusion ... 109
Chapter 5 -
How can economic incentives trigger abatement in Chinese
agriculture? ... 111
1. Pricing carbon in agriculture from theory to practice ... 112
1.1. Theoretical background on integrating environmental issues into the economy ... 112
1.2. States of carbon pricing around the world ... 113
1.3. States of carbon pricing in agriculture ... 114
2. States of carbon pricing in China ... 116
2.1. Development of carbon emission trading schemes in China ... 116
2.2. Regulatory conditions of domestic offset markets ... 121
2.3. Carbon tax discussions in China ... 122
2.4. Subsidies for synthetic fertilizers is a negative carbon tax ... 123
3. Difficulties and specificities of pricing carbon in China’s agriculture ... 124
3.1. Diffuse nature of agriculture emissions and mitigation actions: the need for aggregator ... 125
3.2. Difficulties in accurate measurement and verification of emission and abatement ... 126
3.3. The specialty of soil carbon storage ... 128
4. Suggestions on pricing carbon in China’s agriculture ... 129
4.1. Restructure fertilizer subsidies ... 129
4.2. Up-scaling carbon crediting schemes ... 130
4.3. ETS pilot covering the agricultural sector ... 132
5. Conclusion ... 134
General Conclusion ... 137
References ... 141
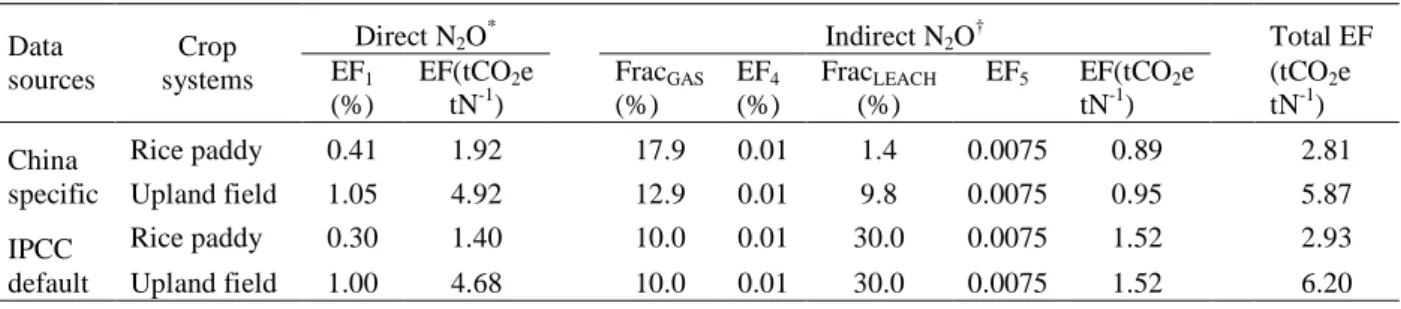
Annex 1: Selected values for estimating N
2O emissions from croplands ... 151
10
Annex 3: Past and predicted future agriculture activities ... 154
Annex 4: Mitigation potential from the livestock sector ... 156
Annex 5: GHGI at regional level in 2010 and implications for mitigation
strategies ... 163
Annex 6: Estimates of N
2O abatement rates of mitigation measures C1-C4 165
Annex 7: Considerations for measure implementation cost estimation ... 168
Annex 8: Comparative table of market design among pilots ... 169
Annex 9: VER rules and development of CCER projects ... 174
Annex 10: Discussions on levying carbon tax in China ... 177
11
List of Figures
Figure 0-1 Development process of a bottom-up MACC for Chinese agriculture (cropland
emissions) ... 21
Figure 1-1 Composition of China’s GHG emissions by gas in 2005(a) and 1994(b) ... 27
Figure 1-2 Composition of China’s GHG emissions by sector in 2005(a) and 1994(b) ... 27
Figure 1-3 Evolution of China’s CO2 emissions and global share from 1980 to 2010 ... 28
Figure 1-4 Growth trends of CO2 emissions and energy use in China from 1990 to 2008 ... 29
Figure 1-5 Drivers of CO2 emissions growth in China from 1981 to 2010 ... 30
Figure 1-6 World cumulative CO2 emissions 1850 – 2005: total and per capita ... 32
Figure 1-7 Energy intensity evolution during the FYP periods from 1980 to 2010 ... 37
Figure 1-8 China’s position towards target reaching (2011-2020) ... 39
Figure 2-1Trend of crop production and N fertilizer inputs in China from 1960 to 2010 ... 44
Figure 2-2 Trend of animal products in China from 1980 to 2009 ... 45
Figure 2-3 Historical changes of national average GHGI of rice, wheat and maize production ... 54
Figure 2-4 Baseline GHG emissions from Chinese agriculture to 2020 ... 59
Figure 3-1 GHGI of rice (a), wheat (b) and maize (c) production in different provinces in 2010 . 75 Figure 3-2 Geographic pattern of rice (a), wheat (b) and maize (c) GHGI in 2010 ... 77
Figure 3-3 Historical changes of provincial GHGI of rice (a), wheat (b) and maize (c) production ... 78
Figure 3-4 Relationship between reduction percentages of N fertilizers and N2O emissions ... 81
Figure 4-1 Illustration of a ‘histogram’ MACC ... 89
Figure 4-2 Illustration of a ‘curve’ MACC ... 89
Figure 4-3 MACC for China agricultural sector (a) and cropland (b): maximum feasible abatement potential in 2020 (discount rate = 4.5%). ... 97
Figure 4-4 Projected BAU and abatement emissions scenarios for the whole agricultural sector (a) and croplands (b) ... 99
Figure 4-5 Illustration of MACC for wheat and maize related measure C1, C2 and C6 in three provinces ... 101
12
List of Tables
Table 1-1 Key energy and climate indicators in the China’s Five-Year Plans ... 34
Table 1-2 Major climate and energy related policies throughout 2005-2015 in China ... 35
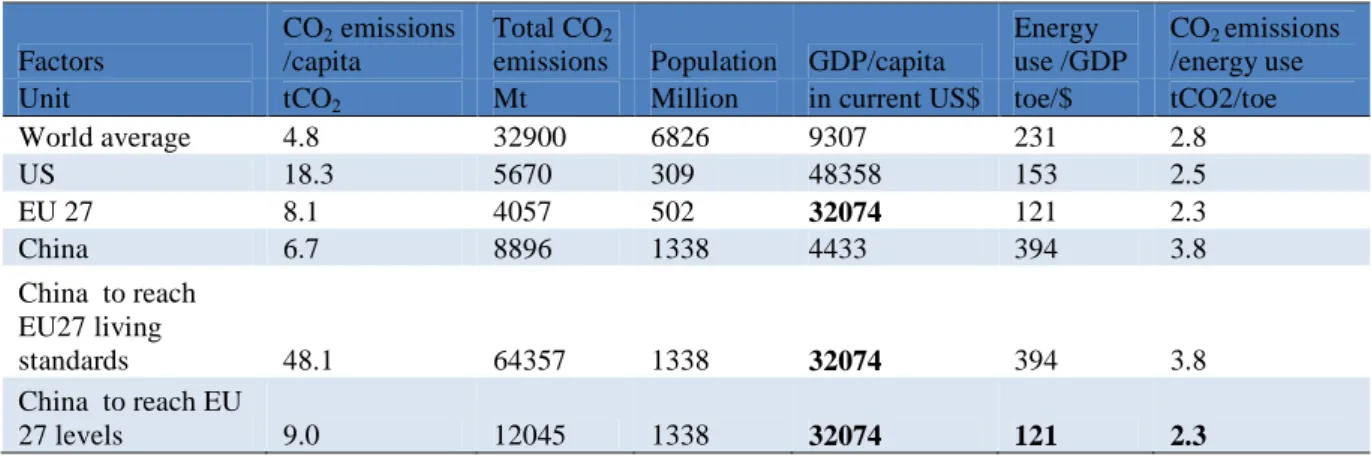
Table 1-3 Comparisons of levels of CO2 emission drivers in China and other countries (2010) .. 38
Table 2-1 GHG emission sources and contribution in Chinese agriculture ... 48
Table 2-2 GHG emission factors for N inputs to China’s croplands ... 51
Table 2-3 Total N fertilizer use in agriculture and national average application rate ... 57
Table 3-1 Initial list of crops/soils measures and reasons for inclusion/exclusion ... 62
Table 3-2 Description of selected crops/soils mitigation measures and target crops ... 65
Table 3-3 Mitigative effects and stand-alone abatement rates of cropland mitigation measures .. 69
Table 3-4 Measure adoption under baseline and abatement scenarios ... 73
Table 3-5 Average abatement rate, additional application area and mitigation potential of cropland measures ... 74
Table 3-6 Application area and overall N2O mitigation potential from measures C1-C4 ... 83
Table 4-1 Benefits/costs implications of cropland measure implementation ... 93
Table 4-2 National average inputs (price) of rice production in 2010 and 2020 ... 94
Table 4-3 Illustration of calculating cost of measure organic addition to rice paddies ... 95
Table 4-4 Cost and cost effectiveness of cropland mitigation measures ... 96
Table 4-5 Example of cost effectiveness of some measures at the regional level ... 101
Table 4-6 Comparison of agriculture MACCs results ... 103
Table 4-7 Comparison of MACCs results across sectors ... 104
Table 5-1 Average annual credits issued (ktCO2e) and number of agricultural projects registered under each standard (as of May 2014) ... 116 Table 5-2 Explanation, unit and values of variables for estimating the negative carbon tax rate 124
13
Acronyms
ACR American Carbon Registry
BAU Business as usual
BP British Petroleum
CAAS Chinese Academy of Agricultural Sciences
CAIT Climate Analysis Indicators Tool
CAR Climate Action Reserve
CAS Chinese Academy of Sciences
CCB Climate, Community and Biodiversity
CCER Chinese Certified Emissions Reduction
CCS Carbon Capture and Storage
CCX Chicago Climate Exchange
CDIAC Carbon Dioxide Information and Analysis Center
CDM Clean Development Mechanism
CER Certified Emission Reduction
CFI Carbon Farming Initiative
CH4 Methane
CMA Chinese Meteorological Administration
CO2 Carbon dioxide
CO2e Carbon dioxide equivalent
COP Conference of the Parties
CPAs Component project activities
DNA Designated National Authority
DOE Designated Operational Entity
DRC Development and Reform Commission
EB Executive Board
EDGAR Emission Database for Global Atmospheric Research
EF Emission Factor
FAO Food and Agriculture Organization of the United Nations
14
ERU Emission Reduction Unit
ETS Emissions Trading Scheme
EU European Union
EU ETS European Union Emissions Trading Scheme
FAPRI Food and Agricultural Policy Research Institute
FYP China’s Five-Year Plan for social and economic development
GDP Gross Domestic Product
GHG Greenhouse gas
GHGI Greenhouse gas intensity
GtCO2e Gigaton of carbon dioxide equivalent
GWP Global warming potential
HFC Hydrofluorocarbon
HFC-23 Trifluoromethane hydrofluorocarbon 23
IEA International Energy Agency
IPCC Intergovernmental Panel on Climate Change
JI Joint Implementation
JRC EU’s Joint Research Centre
ktCO2e Kiloton of carbon dioxide equivalent
LULUCF Land Use, Land-Use Change and Forestry
MACC Marginal abatement cost curve
MEP Ministry of Environmental Protection
MFA Ministry of Foreign Affairs
MOA Ministry of Agriculture
MOST Ministry of Science and Technology
MRV Monitoring, Reporting and Verification
MtCO2e Megaton of carbon dioxide equivalent
Mt Megaton
MW Megawatt
N2O Nitrous oxide
NAMA Nationally Appropriate Mitigation Action
15
NCCC National Committee on Climate Change
NDRC China’s National Development and Reform Commission
NEA National Energy Administration
NPV Net Present Value
NUE Nutrient Use Efficiency
NZ ETS New Zealand Emissions Trading Scheme
OECD Organization of Economic Cooperation and Development
PFPN Partial Factor Productivity of N fertilizer
PoA Program of Activities
REDD Reducing Emissions from Deforestation and Forest Degradation
RGGI Regional Greenhouse Gas Initiative
SAIN China-UK Sustainable Agriculture Innovation Network
sCER Secondary Certified Emission Reduction
SF6 Sulfur hexafluoride
SOC Soil Organic Carbon
tce Tons of coal equivalent
tCO2e Ton of carbon dioxide equivalent
UK United Kingdom
UN United Nations
UNFCCC United Nations Framework Convention on Climate Change
US United States
USDA US Department of Agriculture
US EPA US Environmental Protection Agency
US IEA US Energy Information Administration
VAT Value Added Tax
VCS Verified Carbon Standard
WB World Bank
WRI World Resources Institute
17
Introduction
China has become the world’s largest energy consumer and emitter of greenhouse gas (GHG), primarily attributed to accelerated economic development and industrial growth since the economic takeoff in 1980s and the country’s heavy reliance on coal. China’s per capita carbon emissions were only one-third of the US levels in 2010 but were expected to surpass the EU soon. China also consumes a lot more energy than western countries to produce one unit of GDP, giving rise to serious environmental problems that appeared to be hurdles to sustainable development. The Chinese government thus devoted to significantly improve the efficiency of domestic energy use. Consequently, China in the nation’s Five-Year Plans for social and economic development started to include a reduction target for energy intensity since 1980. The target was renewed in the 12th Five-Year Plan to cut the energy use per unit of GDP by 16% between 2011 and 2015.
Additionally, facing the negative impacts of global climate change as a result of excessive anthropogenic GHG emissions, the Chinese government for the first time in history set a goal in the recent national Five-Year Plan to improve the carbon intensity of the economy by 17% by 2015 from 2010 levels. This target is an interim translation of China’s voluntary commitments submitted to the Copenhagen Accord pledging to reduce its carbon emissions per unit of GDP by 40-45% by 2020 compared to the 2005 levels. While addressing climate change issues, the central government uses it as a vehicle to drive the comprehensive transition to a low-carbon economy. China has implemented a range of policies to improve energy efficiency and increase use of non-fossil energy and forest coverage. However, given the amplitude of global climate change challenge, targeting only the energy and forestry sectors without engaging other economical sectors, the current national mitigation strategy may not be sufficient to achieve the ambitious goal to decouple GHG emissions from economic growth.
So far, the agricultural sector has been only insufficiently incorporated in national mitigation policies. This absence is partially due to significant fragmentation in the agricultural systems and emissions sources, particularly in rural China where small hold farms is in predominance each only possessing in average less than one hectare of cropland. In addition, land-based emissions resulting from biological processes are spatially distributed depending on local bio-physical and climate conditions and farming practices. Owing to this high regional heterogeneity and diversity, it is difficult to accurately measure and verify GHG emissions and abatement potentials from agriculture. More importantly, the agricultural sector has historically played an essential role in China’s economy as it accounts for about 10% of the national GDP, providing food and primary material for other sectors, and in support of the livelihood of over 600 million farmers. In fear of imposing negative impacts on the agricultural sector and consequently national food security,
18
which has consistently been a top priority in China, the authorities have little motivation to regulate agriculture emissions.
However, exclusion of agriculture from national mitigation strategy presents a missed opportunity since the sector is a major contributor to national GHG emissions only second to the energy sector. It accounted for 11% of China’s GHG emissions in 2005 and was responsible for over 70% of national N2O emissions and approximately 50% of CH4 emissions. Agriculture
emissions mainly arise from livestock enteric fermentation, croplands, rice cultivation and livestock manure management. However, little progress has been made in crop and animal productivity in the past decade despite of the continuously increasing production inputs, particularly synthetic N fertilizers. This has led to major environmental issues, such as water contamination, soil degradation and erosion and GHG emissions. Therefore, Chinese agriculture stands now at the pivotal crossroads to shift to a more sustainable production mode by updating its production systems and improving farming practices.
In this regard, inclusion of climate mitigation efforts into agricultural policies could enhance the efficiency of agricultural production and accelerate low-carbon transition in this sector if agricultural management techniques could be upgraded to reduce GHG emissions without negative impacts on food security. In addition, if there exist mitigation options in this sector that are more cost-effective in reducing GHG emissions compared to those in other sectors of the economy and if they could deliver significant potentials, integrating agriculture into the national mitigation strategy would lower the overall social cost of addressing climate change. Indeed, existing global reviews (e.g. Oenema et al., 2001; IPCC, 2007; Smith et al., 2008, 2013) suggest that agriculture offers significant technical potential to mitigate climate change through both emissions reductions and carbon sequestration in terrestrial ecosystems. In addition, some reviews (e.g. Wreford et al., 2010) indicate that many abatement measures in agriculture afford win-wins solutions, i.e. simultaneously mitigating GHG emissions and improving productivity.
There have been many efforts to identify technically feasible mitigation measures that are applicable in both arable and livestock systems and to examine their technical abatement potentials in China (Lin et al., 2005; Lu et al., 2009; Huang and Tang, 2010; Nayak et al., 2014). These research results provide insights on how mitigation potentials can be applied across the range of biophysical conditions that characterize Chinese farming systems. However, there are few synthesis estimates of the overall technically feasible mitigation potential offered by agriculture, nor any estimation of the cost-effectiveness of abatement measures in this sector. Such kind of information is crucial in assisting policy-makers to decide the extent to which agriculture could be incorporated into national mitigation policies and which abatement options should be prioritized. This is the core question that this thesis tries to explore, giving a special focus to cropland emissions from fertilization.
19
The objective of this thesis is therefore fourfold, articulating around the evaluation of the cost-effectiveness and the potential of agricultural mitigation.
- It aims to firstly review the emission status and emission sources of Chinese agriculture and assessing its role in the national mitigation strategy. This will allow us to see if agricultural emissions can be estimated sufficiently rigorous to construct baseline scenarios to project near-term GHG emissions.
- The second objective is to identify possible options to change farming practices that could be compatible to the objectives of safeguarding national food security, and to evaluate the magnitude of abatement potentials offered by the mitigation measures against the baseline.
- In the third place, we will investigate the economic implications for farmer when adopting mitigation measures compared to the baseline farming practices, based on which we will deliver the cost-effectiveness analysis of identified abatement options and suggestion on priority of mitigation actions for purpose of policy-making.
- The final objective is to examine the development of carbon pricing mechanisms (tradable permits and taxes) in China and elaborate how the economic instruments could be used to reduce agricultural emissions most cost-effectively.
Responding to these questions requires a research tool that is able to incorporate the assessments on technical mitigation potentials with that of the economic analysis from the agricultural sector: the Marginal Abatement Cost Curve (MACC). MACCs show the cost-effectiveness of different mitigation options as well as the overall abatement potential that can be offered. They also enable comparison of the cost-effectiveness of abatement options within a special sector and/or between different sectors of the society. This made MACCs an important tool to assist policy makers in prioritizing mitigation options during the last decades with a plentiful of literature dedicated to MACC construction and analysis.
There are two families of approaches that have been used to construct a MACC: top-down and bottom-up. A top-down analysis allocates an exogenously determined emission reduction requirement downward through modeling assumptions to conclude an overall abatement cost to the economy. This approach employs either microeconomic supply-side models (De Cara et al., 2005; Hediger, 2006; USEPA, 2006; De Cara & Jayet, 2011) or macroeconomic partial or general equilibrium models (IPCC, 2007; Schneider et al., 2007; Smith et al., 2008; Domínguez et al., 2009). Engineering-oriented bottom-up approaches of MACC studies (Beach et al., 2008; Moran et al., 2011; Schulte et al., 2012; Pellerin et al., 2013) analyze the abatement cost and mitigation potential of individual measures by taking into account heterogeneities in terms of abatement potential, applicability and implementation costs of mitigation options.
Owing to the fragmented nature of Chinese agriculture emissions and the attempt to making maximum use of the field experiment data collected, this thesis will apply the bottom-up
20
approach to construct a MACC for the Chinese agricultural sector. This MACC excise will consider the extent of biophysical data on agricultural mitigation measures and thereby allowing for the aggregation of the mitigation potential arising from the application of a subset of cost-effective measures above a notional baseline level of activity that we denote as the business as usual (BAU) scenario.
This thesis is structured around the derivation and utilization of a MACC for Chinese agriculture i.e. i) identification of BAU GHG emissions; ii) evaluation of the technical and economic potentials; iii) assessment of possible economic tools to realize the identified mitigation potentials. The basic steps for constructing a bottom-up agriculture MACC is illustrated by Figure 0-1, following the general methodology (e.g. as described in Moran et al. (2011)) but with adjustments to better accommodate national context and reflect country specificities. Another point to bear in mind is that this study will only address GHG emission within the farm gate as opposed to conducting life-cycle analysis. This thesis is therefore structured in five chapters, which articulate and extend the contents of the three major academic papers (Wang et al., 2014, 2015; Quemin & Wang, 2014) that the candidature published during the PHD study.
The first chapter is a general overview of Chinese climate policies to assists us in understanding the current status and challenges of integrating agriculture into the national mitigation strategy. The reader will first be informed of the historical and current GHG emissions in China and the contributors to the increasing carbon emissions. This will help understand Chinese government’s positions in international climate negotiations as well as its considerations of incorporating climate change objectives into national social and economic development plans. After, we will discuss major energy and climate policies adopted in China, examining their efficiency in reducing energy intensity in the past and the sufficiency to achieve future climate targets. This background overview will show that despite agriculture being a major source of increasing GHG emissions in China, this sector is currently hardly integrated in the national mitigation strategy.
Chapter 2 focuses on the construction of a most plausible baseline for near-term GHG emissions from predicted BAU activities of the Chinese agricultural sector until 2020. We will first present agricultural development in China and its implications on GHG emissions. It will show high level of emphasis from the authorities’ concerning food security that can be seen in all agriculture policies. This core principle will be incorporated into the construction of baselines used to assess mitigation potentials in the following chapters. For instance, increase of agricultural production is well underlined in projecting future agricultural activities that will align mitigation objectives with the food security priority. An analysis of agriculture GHG emissions will be carried out to identify the most appropriate methodologies for calculating emissions in this sector. It will show that agriculture GHG emissions will continue to increase in the timeframe to 2020 under the BAU scenario with livestock emissions growing faster than those from
croplands. In addition, the studies will
cereal crops on a provincial and historical scale to reveal the curve of the carbon footprint of crop
Figure 0-1 Development process of a bottom
Chapter 3 assesses the technical primarily those from cropland emissions 0-1. The bottom-up MACC exercise have wide application opportunities comparing the selected mitigation
baselines, we will be able to estimate the per area abatement rate Quantification of the abatement rates
rely on meta-analysis that collected data from China. After, the additional area
estimating the overall feasible mitigation potential represents approximately
one-and organic fertilizer management potentials from cropland emissions related to N-use in cereal production figure. We will see that abatement rate provinces corresponding to the
21
the studies will specially focus on the GHG intensity of the three m cereal crops on a provincial and historical scale to reveal the geographic variations and historical
of crop production.
process of a bottom-up MACC for Chinese agriculture (
Source: Author
technical mitigation potentials that are feasible in Chinese agriculture, cropland emissions, following the steps presented in the upper part of MACC exercise starts with identifying agriculture mitigation measures that
opportunities in China and offer significant abatement potential mitigation measures with the common practices u
estimate the per area abatement rates, i.e. tCO
abatement rates will take into account effects of measure interactions that collected data from hundreds of experiments carried
areas available for measure application will be examined to the overall feasible mitigation potentials from indentified measures. This
-third of the baseline agriculture emissions in 2020. management practices are expected to provide the largest from cropland emissions, we will perform an in-depth analysis of
in cereal production at the regional level to calculate a batement rates and mitigation potentials vary the high differences in regional GHG intensity
the GHG intensity of the three major variations and historical
Chinese agriculture (cropland emissions)
ble in Chinese agriculture, the upper part of Figure mitigation measures that and offer significant abatement potentials. By measures with the common practices under the defined tCO2e abated per hectare.
measure interactions and experiments carried out throughout application will be examined to allow for indentified measures. This potential in 2020. Since synthetic practices are expected to provide the largest mitigation depth analysis of mitigation measures an aggregated national vary significantly among of cereal production.
22
In Chapter 4, a literature review of existing agriculture MACCs will first be carried out to explain the choice of applying the bottom-up approach to construct the MACC for Chinese agriculture. After, we will outline the stages in moving from a technical potential to an estimate of feasible economic mitigation potential, as illustrated by the lower half of Figure 0-1. First, we will estimate the implementation cost of each measure by comparing changes in the economic performance of applying mitigation options by farmers with those under the baseline. The costs/benefits considered in our approach will only include those occurring directly to farmers, i.e. without extending beyond the farm gate. We also account for anticipated future price rise for various agricultural inputs/outputs. Per area abatement cost is then combined with the per area abatement rate to estimate cost effectiveness of mitigating one tonne GHG (expressed as ¥/tCO2e)
of each measure. We will then construct the MACC and the abatement scenarios for the agricultural sector to 2020 and conclude that over one-third of the total mitigation potential could be realized at negative costs while another one-third from low-cost abatement measures. We will also discuss regional MACCs since a national MACC is not able to reflect the heterogeneity in cost-effectiveness and mitigation potentials at the regional level. This information would be more valuable to assist regional policy-makers. A comparison of the Chinese agriculture MACC with similar studies in the other countries will allow us to see the pertinence of the thesis outcome. Additionally, comparing our results with MACCs from other economic sectors will show the importance of integrating agriculture into national mitigation strategy. A sensitivity analysis will be performed to test the robustness of the various assumptions underpinning MACC construction. Finally significances and limits of the MACC study will be discussed.
Chapter 5 explores how the research outcomes on MACC analysis could support policy making on combating climate change in agriculture. The authorities generally adopt “command and control” approaches by setting up standards and rules to address environmental issues. But the economists argue that economic tools are more cost effective in alternating the behavior of economic agents through the introduction of a price on carbon, which reflects the cost of excessive emissions in a context where traditional markets fail to account for environmental externalities. In China, the development of seven carbon emission trading pilots and the government’s intention to initiate a national scheme has attracted much attention and thereby an extensive analysis will be carried out. Another economic tool - carbon tax- is also under discussion in China, but we will put more emphasis on the adverse impacts of N fertilizer subsidies, which could be regarded as a negative carbon tax. We will see that agriculture is marginalized in the current carbon pricing schemes because of high transaction costs arising from the diffuse nature of emission sources and abatement actions, difficulties of accurate emission measurement and verification, and specificities of carbon storage in soils. Taking these barriers into account, we will propose some suggestions on an effective use of economic instruments in regulating agricultural emissions. It is urgently needed to restructure the current subsidy systems to create a better economic signal on fertilizer use. Finally, we shall recommend the designing
23
elements to scale-up crediting schemes, especially via the use of regional GHG intensity results as baselines. Advancement in the national offset markets shall aliment the preparation of a pilot ETS covering agriculture with innovative features.
25
Chapter 1 -
General overview of climate policies in
China
China has made remarkable progress in terms of economic development since the Reform and Opening-up in the early 1980s. With GDP growth rates averaging 9-10% over the past 30 years, China has now become the second largest economy in the world (World Bank, 2013). However this strong economic performance has been achieved at a high cost of environment with air, water and soil pollution spreading to large areas of the nation (e.g. MEP et al., 2014). Regarding climate change challenges, China is now the world’s largest annual emitter of GHG emissions and the top energy consumer. During the 2000s, environmental and climatic issues have gradually stepped in the society as major concerns and they are progressively prioritized in the National Plans for Economic and Social Development.
Collective actions from all nations are needed to effectively tackle the vast threats of global warming and climate change. It is hard to achieve the ambitious climate goals successfully without considerable efforts from China, which is determined by China’s engagement in international climate negotiations and its policies and actions domestically to address climate change. Full comprehension of China’s climate strategies needs to be built on a better understanding of the nation’s development challenges and the causes to its GHG emissions. It is also essential to analyze how mitigation strategies and actions will shape the future emissions curves and whether they could guarantee the fulfillment of climate targets. For the purpose of this thesis research, it is central to consider the agriculture contribution to the national GHG emissions and how this sector is taken into account in the national climate strategies.
In this chapter, we are first going to present China’s GHG emissions profile and the growth drivers of CO2 emissions (section 1), followed by an overview of China’s participation in
international climate negotiations and how climate dimension is gradually integrated into national development designs (section 2). Section 3 gives an in-depth analysis of the climate policies and actions and how they framed the energy intensity evolution in the past and will affect future energy and climate performance in China. This background overview allows us to identify the challenges of incorporating agriculture into national climate strategies (section 4).
26
1.
Chinese GHG emissions and drivers of CO
2emissions growth
This section first presents the magnitude of GHG emissions in China and the major contributing sectors (section 1.1). Investigation on the historic evolution of CO2 emissions is
performed to understand the emission trends (section 1.2) and the factors driving CO2 emissions
growth in China (section 1.3).
1.1. GHG emissions according to national inventories
China, as a non-Annex I Party to the United Nations Framework Convention on Climate Change (UNFCCC), is not obligated to report its GHG emissions on an annual basis. As of 2014, the Chinese Government has published two national inventories of GHG emissions - those of 1994 and 2005, incorporated into the Initial and Second National Communication on Climate Change submitted to the UNFCCC in 2004 and 2012, respectively (NCCC, 2004, 2012). In compiling the inventories, China followed the IPCC Guidelines for National Greenhouse Gas Inventories (revised 1996, Good Practice and 2006 versions) and selected emission sources, activity data and emission factors according to national circumstances. China chose to estimate only carbon dioxide (CO2), methane (CH4), nitrous oxide (N2O) emissions when conducting the
first inventory, but reported on all the six GHGs for the second one. In the meantime, more emission sources under the five sectors, i.e. energy, industrial processes, agriculture, waste management and land use change and forestry, were accounted in the 2005 inventory.
According to the national inventories, in 2005 China’s GHG emissions totaled 7,976 million tons (Mt) CO2 equivalent (CO2e) excluding Land Use, Land Use Change and Forestry
(LULUCF), more than double the amount in 1994 (3,650 Mt CO2e). The total net carbon removal
through LULUCF was estimated to be about 421 and 407 Mt CO2e in 2005 and 1994,
respectively, attributable to the government’s continuous efforts to raise the national forestry coverage (a net increase of about 4.1 Mha forestry each year during 2003-2008). Among the GHG emission sources, fossil fuel combustion was the largest contributor accounting for over 70% of global warming potential (GWP) weighted emissions (Figure 1-1 and Figure 1-2). Agricultural production came at the second place and was the primary source of CH4 and N2O emissions
followed by industrial processes which were an importance source of CO2 emissions. The two
sectors together represented approximately 21% of national total emissions in 2005 while around 2% arose from waste management in the form of CH4.
Prior to the release of the second national inventory, the International Energy Agency (IEA, 2011) and the Climate Analysis Indicators Tool (CAIT, 2013) of the World Resources Institute (WRI) also estimated China’s GHG emissions for 2005. Their results of 7,527 and 7,059 Mt CO2e are lower than the national statistic (7,976). The discrepancies can be partially attributed to
the inconsistencies between the energy consumption data from the national statistical system and that of the IEA (Zhu, 2013). In the future, the Chinese government is committed to start reporting
27
its emissions more frequently, even on a biennial basis with the assistance from developed countries, as outlined in the Copenhagen Accord.
Figure 1-1 Composition of China’s GHG emissions by gas in 2005(a) and 1994(b)
a (2005) b (1994)
Source: China’s Second and Initial National Communication on Climate Change (NCCC, 2012, 2004)
Figure 1-2 Composition of China’s GHG emissions by sector in 2005(a) and 1994(b)
a (2005) b (1994)
Source: China’s Second and Initial National Communication on Climate Change (NCCC, 2012, 2004)
1.2. Historic trends of CO2 emissions from fossil fuel combustion and cement production
For the purpose of illustrating historic trends, data on GHG and CO2 emissions need to be
updated at regular time intervals or preferably on an annual basis. However, such information is absent in official statistics and it is thus necessary to direct to other sources that release CO2
emissions data at constant intervals, such as those by the IEA, the British Petroleum (BP), the Emission Database for Global Atmospheric Research (EDGAR) of the EU’s Joint Research Centre (JRC)/PBL Netherlands Environmental Assessment Agency, the Carbon Dioxide Information and Analysis Center (CDIAC), the US Energy Information Administration (EIA) and
CO2 80% CH4 13% N2O 5% HFCs 2% PFCs0% SF60% CO2 73% CH4 20% N2O 7% Energy 77% Agricultu re 11% Industrial processes 10% Waste manag. 2% Energy 74% Agricultu re 15% Industrial processes 7% Waste manag. 4%
28
the WRI’s CAIT. National experts (e.g. Zhu, 2013) indicated the compatibility of IEA estimates with national inventories of CO2 emissions; we thereby use the CAIT database to illustrate CO2
emissions evolution in China (CAIT, 2013). The CAIT database include CO2 emissions from
fossil fuel combustion, drawing from estimates by the IEA, and those from cement production, drawing from estimates by the CDIAC. Generally, CO2 emissions from cement production
account for over 70% of CO2 emissions from the whole industrial processes in China. Figure 1-3
presents the evolution of national CO2 emissions and China’s share of the world’s total from
1980 to 2010. Figure 1-4 highlights the growth rates of CO2 emissions in relation to the growth
rates of energy use in China from 1990 to 2008 (CAIT, 2013).
Figure 1-3 Evolution of China’s CO2 emissions and global share from 1980 to 2010
Source: WRI’s CAIT (2013)
China’s CO2 emissions from fossil fuel combustion and cement production, excluding
LULUCF, amounted to 8,896 Mt in 2010 and accounted for about 26.8% of the world emissions. As Figure 1-3 illustrates, while the national CO2 emissions in 2010 were more than twice their
1990 levels, this growth occurred principally between 2002 and 2010 after a slight decrease during 1996-2000. Since 1979, following on China’s Economic Reform and Opening-up, annual carbon emissions increased nearly 6-folds. But it should be mentioned that about 33% of the emissions were produced making goods for export in 2006 compared to only 12% in 1987(Wang & Watson, 2008). National CO2 emissions have been evolving at slightly higher pace than the
total primary energy consumption - the essential driver of CO2 emissions.
The per capita CO2 emissions in China were about 6.65 tons in 2010, which were about
one-third those of the US (18.33 tons) and approached the EU-27 levels (8.08 tons). The BP report (2014) predicts that per capita carbon emissions in China will surpass the EU in 2017 and the OECD average in 2033, but remain below the US level in 2035.
1.5 1.8 2.5 3.2 3.3 5.7 8.9 18.2 18.8 22.3 23.0 24.7 29.1 33.2 8.0% 9.5% 11.1% 13.9% 13.5% 19.5% 26.8% 0% 5% 10% 15% 20% 25% 30% 0 5 10 15 20 25 30 35 1980 1985 1990 1995 2000 2005 2010 C O2 em is si o n s (b il li o n t ) Year
29
Figure 1-4 Growth trends of CO2 emissions and energy use in China from 1990 to 2008
Source: WRI’s CAIT (2013)
1.3. Drivers of CO2 emissions growth in China
To help explain the causes of CO2 emissions growth, carbon emissions can be divided into
four drivers: population, per capita GDP, energy intensity of the economy, and the CO2 content of
the energy use (Kaya, 1990). The relationship can be expressed as:
Per capita GDP CO2 intensity Energy intensity CO2 intensity per unit of GDP
The contribution of the four drivers to overall CO2 emissions at 5-year intervals during
1981-2010 is calculated by the author using the method developed by Kaya. Results are plotted in Figure 1-5. CO2 emissions data are from the CAIT database, GDP and population information is
extracted from the World Bank database (2013), and the energy use is collected from the BP statistical review (2013). The results illustrate that among the four drivers, only the energy intensity of GDP has been in a steady decrease since 1980 accelerated by policy interventions and concerted efforts, especially after 2005 (see section 3.2 for more details). Figure 1-5 also
30
indicates that the growth in total CO2 emissions from 1981 to 2010 was largely triggered by the
increase in per capita GDP (responsible for over 70% growth), but was nearly inelastic to population growth. The impact of China’s carbon intensity of energy consumption on CO2
emissions was not consistent over time. It declined from 1996 to 2000 as the share of coal in the primary energy mix reduced from 73.5% in 1996 to 68% in 2002 while the share of oil increased from 18.7% to 22.3 % (NBS, 2011). The trend reversed when oil prices started to rise quickly in 2002, stimulating the consumption of coal. As a result, the share of coal reached a periodic peak of 70.4% in 2009. Not only was more coal consumed in this period, but lower-grade coal with higher carbon content was used to meet the unexpected energy demand brought on by rapid economic growth (Levine & Aden, 2008). Consequently, carbon intensity of energy use grew by 15% from 2001 to 2010, contributing 8.8% to the increase in CO2 emissions since 2001.
Figure 1-5 Drivers of CO2 emissions growth in China from 1981 to 2010
Note: For each period, the evolution of CO2 emissions (expressed as a difference of natural logarithms) is presented
by the first bar on the left, which is the net sum of the impact of the evolution of its drivers on the same period shown on the right.
Source: Author’s calculation based on data from CAIT, WB and BP (2013)
The decomposition analysis of CO2 emissions drivers indicates the possible channels that
would be preferred by the Chinese government to control its emissions growth in the future while sustaining required economic development. Efforts are therefore needed to reduce the energy use per GDP by upgrading industrial performance and conserving energy, and to move towards a cleaner energy mix by alleviating reliance on coal and accelerating the development of non-fossil fuels. This corresponds to the core pieces of energy- and climate-related policies that will be elaborated in section 3. -0.6 -0.4 -0.2 0.0 0.2 0.4 0.6 0.8 1981-1985 1986-1990 1991-1995 1996-2000 2001-2005 2006-2010 CO2 emissions (t) Population ('1000) GDP/capita ($) CO2 emissions /energy use (tCO2/toe)
Energy use/GDP (toe/1000$)
31
2.
From international engagement to national climate policies
2.1. Framework of climate policy marking in China
Originally, the Chinese Meteorological Administration (CMA), along with the Chinese Academy of Sciences (CAS), the Ministry of Science and Technology (MOST) and the Ministry of Foreign Affairs (MFA), directed climate change coordination efforts to reflect China’s initial perception of climate change as a scientific and international issue. As climate change evolved from a scientific topic into an issue also involving economic development and political negotiations, the State Planning Commission (SPC) became the hub for climate change policies in China in 1998. The SPC was renamed as the National Development and Reform Commission (NDRC) in 2003 and holds the broad administrative and planning control over China’s social and economic development.
NDRC’s climate responsibilities are entrusted to the Department of Climate Change, including formulating key strategies and policies dealing with climate change, representing China in international climate negotiations, and coordinating the work of conducting national GHG inventories. Other ministries and government agencies participate in climate-related policy-making by providing their corresponding expertise. For example, the Ministry of Environmental Protection (MEP) formulates concrete regulations and standards, the MFA assists the NDRC in international climate negotiations, the MOST provides technical advice, and the CMA participates in the work of IPCC.
2.2. China’s engagement in international climate negotiations
Grounds underpinning China’s positions in climate negotiations
In order to better understand China’s standpoints in climate negotiations and consequent actions, it is worth taking a look at the basis underpinning the government’s positions, which are the nation’s cumulative CO2 emissions. Although China now contributes over 25% of the world’s
annual CO2 emissions as the top emitter, it is responsible for merely 9% of cumulative emissions
between 1850 and 2006 (Figure 1-6 (a)). In terms of cumulative CO2 emission per capita (Figure
1-6 (b)), it is far less than the levels in developed countries and is about 1/5 of the world average. China therefore advocates taking into account these elements in proposing its international mitigation obligations and considering equity in sharing atmospheric resources. Throughout various climate talks and negotiations, China has reiterated the principle of ‘Common but Differentiated Responsibilities’ that urges developed countries tobear primary responsibility for the historical concentration of GHGs in the atmosphere and thus to take the lead in combating climate change. China also states that developed countries should provide financial resources and
32
technical assistance for developing countries to adopt appropriate measures to mitigate and adapt to climate change.
Figure 1-6 World cumulative CO2 emissions 1850 – 2005: total and per capita
(a) (b)
Source: CAIT of WRI and Tsinghua University
Evolution of China’s engagement in climate negotiations
China has been engaged in international climate discussions since the early 1990s. It formally ratified the UNFCCC in 1992 as a non-Annex I country and the Kyoto Protocol on August 30, 2002, as a non-Annex B country. China was not bound by any emission reduction obligations under the Kyoto Protocol, nor was it willing to take commitments that might constrain its economic growth. In the following years, although global warming gradually received more attention in China as well as internationally, no explicit climate goal was defined nationally. Still, the First National Assessment Report on Climate Change (NARCC) was released in 2006, which assessed the impact of climate change on the main range of economic sectors and put forward both mitigation and adaptation policies and measures. The Second NARCC was published in November 2011.
Since 2007, climate change has quickly become a much-talked-about topic in both the political and scientific spheres, and has rapidly emerged as one of the priorities on the Chinese government’s agenda. The cornerstones of climate-related policies in China were the National Climate Change Program (NCCP), released in June 2007, and the China’s Policies and Actions for Addressing Climate Change (CPAACC) in October 2008. The latter was updated by the NDRC on an annual basis thereafter. In addition, the National Climate Change Adaptation Strategy was published in November 2013. These national communications outlined China’s efforts both to mitigate and adapt to the impacts of climate change, its long-standing positions in climate negotiations, its consideration of integrating climate change into national economic and social development strategies and the significance of setting up a national leading committee on addressing climate change.
Rest of the World 25% Brazil 1% India 2% Russia 8% China 9% EU-27 27% United States 28%
33
With the issue of climate change continuing to heat up on the international agenda and as the top annual CO2 emitter, China has been under increasing pressure from industrialized countries to
take on more mitigation responsibilities. More importantly, the adverse impact on living conditions, agriculture production and health caused by rapid growth in carbon emissions triggered wider discussion at the national scale on the need for China to switch to a more environment-friendly development pattern. In this context, the Chinese government has begun to consider the possibility of making firm commitments on climate change as an important vehicle to redirect economic development pathway. A notable milestone is China’s climate mitigation actions submitted under the Copenhagen Accord, the core elements of which were the voluntary pledges to reduce its CO2 emissions by 40-45% per unit of GDP by 2020 compared to 2005
levels, and increase the share of non-fossil fuels in primary energy consumption to around 15%, forest coverage by 40 million hectares, and forest stock volume by 1.3 billion cubic meters by 2020 from 2005 levels. These engagements reflect both China’s long-held position to conserve its development rights by putting an intensity constraint on carbon emissions, and its willingness in making greater strides to minimize its carbon footprint.
China stepped up its efforts at the Conference of Parties (COP) 17 in Durban, voicing its intention to be engaged in a post-2020 legally binding framework for emission reduction under certain conditions. This was the first time that China mentioned a timeline for taking on future legally binding obligations to control its emissions growth, although contingent upon progress of international climate talks and China’s domestic development by 2020. Such proposals may be presented at the end of 2014 or early 2015.
2.3. Inclusion of climate targets into national development plans
Early 2011 witnessed the translation of these voluntary international commitments into domestic policies as they were integrated into the national economic and social development plan, i.e. the 12th Five Year Plan (FYP), as the vehicle for the transition towards a low-carbon economy. The Outline of the 12th FYP, released in 2011 to cover the period of 2011-2015, established the policy orientation of promoting green and low-carbon development, and explicitly set out mandatory targets on both energy intensity and carbon intensity among a range of sustainable development goals. In the meantime, compulsory goals were set for the share of non-fossil fuel in China’s energy mix and the increase of forest coverage and forest stock volume. While objectives for carbon intensity and forest stock volume were the first-ever to be introduced in a FYP, the other goals followed up on and expanded the ambitions of the 11th FYP (2006-2010). Table 1-1 illustrates the progression of energy and climate related targets in the 11th FYP, the 12th FYP and those for 2020.
34
Table 1-1 Key energy and climate indicators in the China’s Five-Year Plans
Indicators 11th FYP 11th FYP 12th FYP 13th FYP Nature of
target
(2006-2010) (2006-2010) (2011-2015) (2016-2020)
Target Result Target Anticipated target
Energy Intensity (%
reduction in 5 years) 20% 19.1% 16% Not yet available mandatory
Carbon Intensity (% reduction in 5 years) NA
20.5%(according
to ERI research) 17% 40-45% vs 2005 mandatory Non-fossil fuels in primary energy consumption 9%2 9.6%2 11.4% 15% mandatory Forest coverage Up to 20% from 18.2% 20.4% 21.7% 23% mandatory
Forest stock volume NA
13.7 from
12.5billion m3 14.3 billionm3 15 billion m3 mandatory Annual GDP growth
rate 7.5% 11.2% 7% Not yet available expected
National energy consumption3 NA 3.25 from 2.36 billion tce1 (+6.6% annually) 4.0 billion tce (+4.2%
annually) Not yet available expected National electricity consumption3 NA 4192 from 2494 billion Kwh (+10.9% annually) 6150 billion Kwh(+8.0%
annually) Not yet available expected Note: 1. tce stands for metric tons of coal equivalent, unit used by China for energy statistics. 1 tce equals 29.31 GJ
or 7 million kcal at low heat value.
2. The target was set for renewable energy instead of non-fossil fuel and was outlined in the ‘11th FYP for Energy Development -released in 2007.
3. Cap on total energy consumption and electricity consumption were identified in the “12th FYP for Energy Development”, released in January 2014.
Source: Data compiled from FYPs and government reports
3.
Policies and actions to meet the mitigation targets
3.1. Climate and energy related policies throughout 2011-2015
To address both the economic development and climate change challenges, climate policies in China shall accommodate the GDP growth priority but reorient it to be less carbon intensive. In line with this core principle, policies in four fields were prioritized to control emissions: accelerate the adjustment of the industrial structure, promote energy conservation, develop low-carbon energy sources, and increase forest low-carbon sinks (Table 1-2). Most of the policies and measures for 2011-2015 under these four pillars showed a continuation and expansion of those defined for the 11th FYP period.